. 2018 Jan 9;27(1):167-179.e7.
doi: 10.1016/j.cmet.2017.10.003. Epub 2017 Nov 2.

17β-Estradiol Directly Lowers Mitochondrial Membrane Microviscosity and Improves Bioenergetic Function in Skeletal Muscle

Affiliations

17β-Estradiol Directly Lowers Mitochondrial Membrane Microviscosity and Improves Bioenergetic Function in Skeletal Muscle

Maria J Torres et al. Cell Metab. .

Abstract

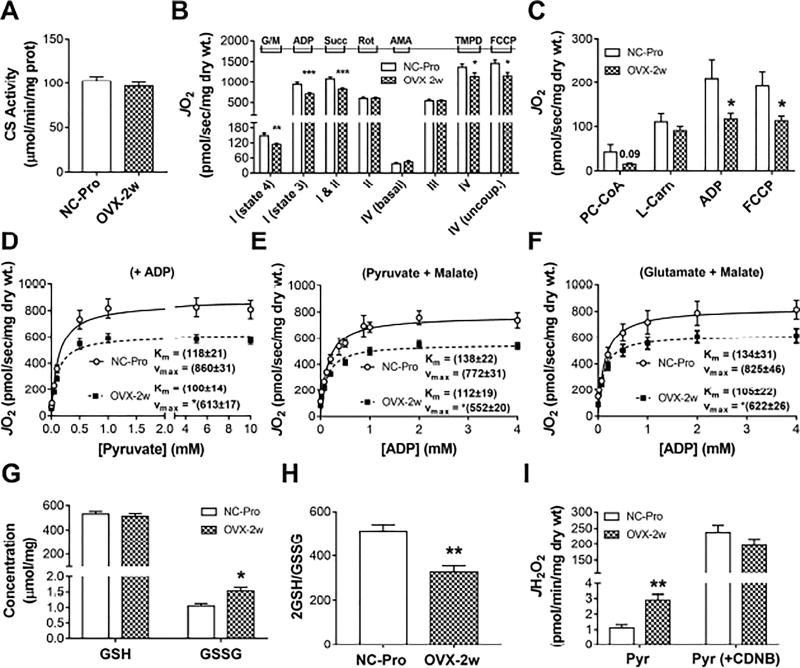
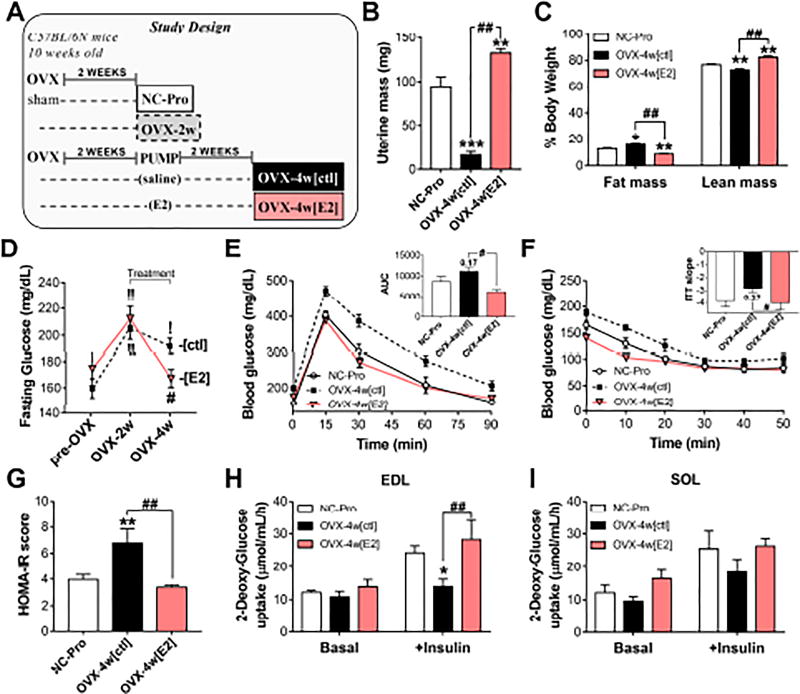
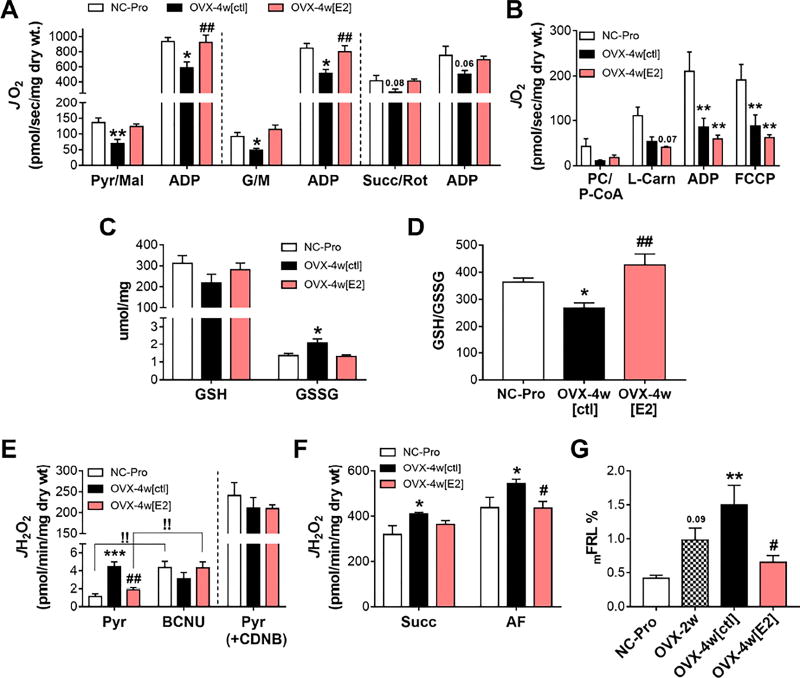
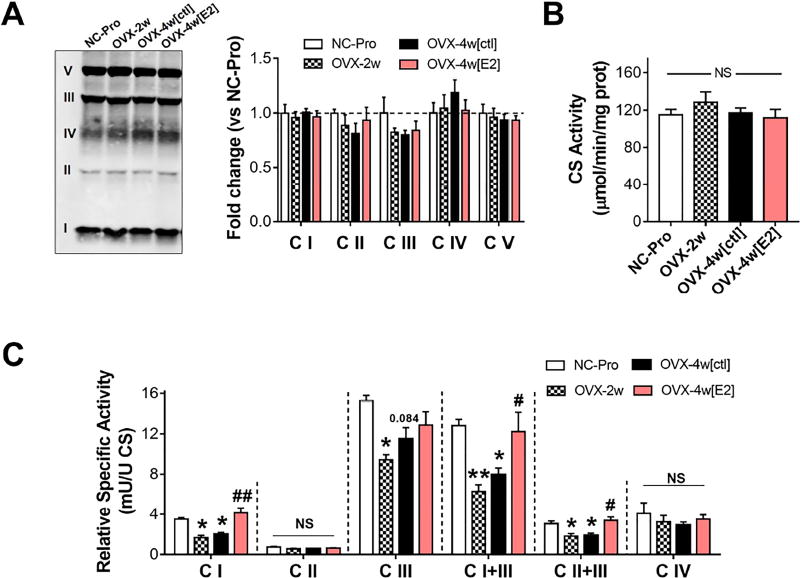
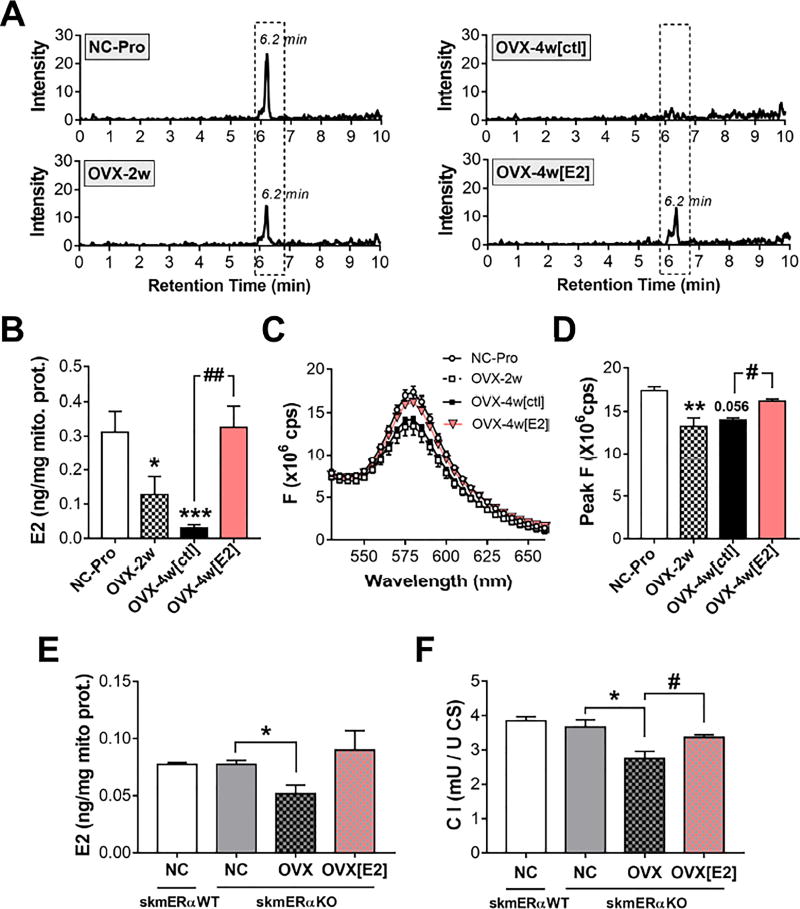
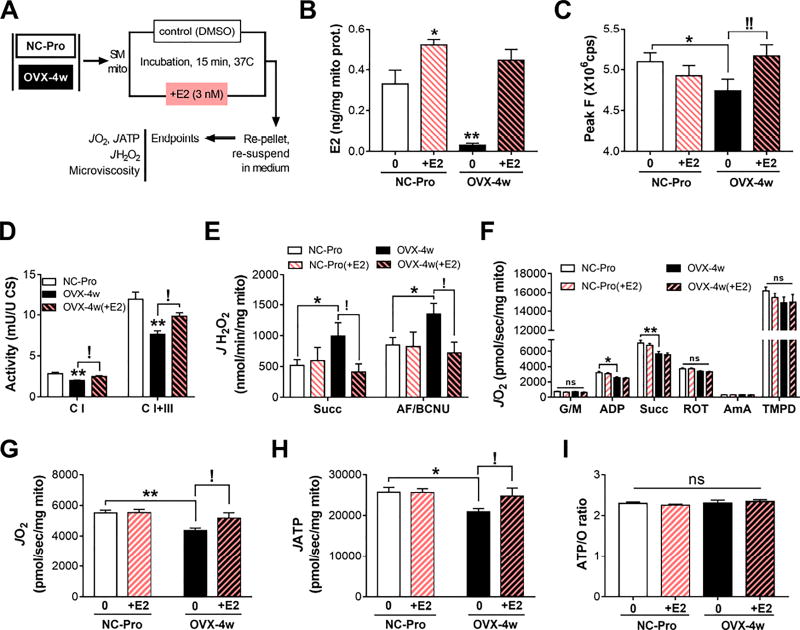
Menopause results in a progressive decline in 17β-estradiol (E2) levels, increased adiposity, decreased insulin sensitivity, and a higher risk for type 2 diabetes. Estrogen therapies can help reverse these effects, but the mechanism(s) by which E2 modulates susceptibility to metabolic disease is not well understood. In young C57BL/6N mice, short-term ovariectomy decreased-whereas E2 therapy restored-mitochondrial respiratory function, cellular redox state (GSH/GSSG), and insulin sensitivity in skeletal muscle. E2 was detected by liquid chromatography-mass spectrometry in mitochondrial membranes and varied according to whole-body E2 status independently of ERα. Loss of E2 increased mitochondrial membrane microviscosity and H2O2 emitting potential, whereas E2 administration in vivo and in vitro restored membrane E2 content, microviscosity, complex I and I + III activities, H2O2 emitting potential, and submaximal OXPHOS responsiveness. These findings demonstrate that E2 directly modulates membrane biophysical properties and bioenergetic function in mitochondria, offering a direct mechanism by which E2 status broadly influences energy homeostasis.

Keywords: estrogen; hormone replacement therapy; hydrogen peroxide; insulin resistance; membrane viscosity; menopause; mitochondria; ovariectomy.


Conflict of interest statement

CONFLICTS OF INTEREST

The authors report no conflicts of interest.

Figures

Figure 1
Figure 1. 2 week-OVX decreases mitochondrial function and induces an oxidative shift in SM cellular redox environment
(A) Citrate synthase activity in RG. (B) JO2 measured in PmFbs from RG. (C) Fatty acid-supported JO2. Abbreviations: glutamate/malate (G/M), succinate (Succ), rotenone (Rot), antimycin A (AmA), ascorbate (Asc), N,N,N′,N′-Tetramethyl-p-phenylenediamine dihydrochloride (TMPD), palmitoyl-carnitine (PC), almitoyl-CoA (P-CoA), L-carnitine (L-Carn). (D–F) Mitochondrial respiratory kinetics. Pyruvate titrations in the presence of malate and ADP (D), and ADP titrations in the presence of G/M (E) or pyruvate/malate (F). Kinetic parameters KM and Vmax were determined from fitting to Michaelis Menten functions. Changes in Vmax were significant (*p<0.05). (G) Total GSH and GSSG concentration and resulting GSH/GSSG ratios (H) in RG. (I) JH2O2 measured in PmFbs pre-incubated with or without 1-chloro-2,4-dinitrobenzene (CDNB) for GSH depletion, then added pyruvate. Values are means ± SEM; * p<0.05; ** p<0.005; *** p<0.0005, N = 8-15 mice/group.
Figure 2
Figure 2. E2 therapy reverses the OVX-induced pro-diabetogenic state
(A) Study design. (B) Uterine mass at sacrifice. (C) Body Composition. (D) Fasting blood glucose. ! p<0.05, !! p<0.005 vs. pre-OVX for each group, and # p<0.05 vs. OVX-4w[ctl]. (E) Glucose tolerance test. Inset: Area under the curve (AUC). (F) Insulin tolerance test. Inset: slope of the least-squared-regression line calculated from the first 20 min. (G) HOMA-IR scores calculated as in Figure S2E. (H–I) Ex-vivo basal and insulin-stimulated 3H-2-Deoxy-glucose uptake in whole EDL (H) and soleus (I) muscles. Values are means ± SEM, * p<0.05, ** p<0.005 vs. NC-Pro and # p<0.05, ## p<0.005 vs. OVX-4w[ctl], N = 6 mice/group.
Figure 3
Figure 3. E2 therapy restores mitochondrial function and cellular redox balance in SM
(A) JO2 measured in PmFbs from RG. C I-supported JO2 measured by the sequential addition of pyruvate/malate (Pyr/Mal) and ADP (left panel); or glutamate/malate (G/M) and ADP (middle panel), and C II-supported JO2 measured in the presence of rotenone (Rot), succinate (Succ), and ADP (right panel). (B) Fatty acid-supported JO2 in RG PmFbs, as in Figure 1C. (C) Total GSH and GSSG levels in whole gastrocnemius. (D) Resulting 2GSH/GSSG ratios. (E) Left: JH2O2 measured after the addition of Pyr, followed by 1,3-bis(2-chloroethyl)-1-nitrosourea (BCNU). !! p<0.005 vs Pyr. Right: PmFBs were pre-incubated with 1-chloro-2,4-dinitrobenzene (CDNB), then added pyruvate. (F) JH2O2 measured after the addition of succinate, auranofin. (G) Mitochondrial free radical leak (JH2O2/JO2*2) under succinate-supported respiration. Values are means ± SEM, * p<0.05; ** p<0.005; *** p<0.0005 vs. NC-Pro, and # p<0.05, ## p<0.005 vs. OVX-4w[ctl], N = 6 mice/group.
Figure 4
Figure 4. E2 therapy restores OVX-induced loss of C I, C I/II+III activities
(A) Western blot analysis of OXPHOS complexes and (B) citrate synthase activity in isolated mitochondria. (C) Relative specific activity of respiratory complexes normalized to CS activity (1 CSU = 1 µmol/min/mg prot). See Figure S4. Values are means ± SEM, * p<0.05, ** p<0.005 vs. NC-Pro, and # p<0.05, ## p<0.005 vs. OVX-4w[ctl], N = 4-5 mice/group.
Figure 5
Figure 5. E2 decreases microviscosity in biomimetic mitochondrial membranes
(A) Sample fluorescence MC-540 emission spectra from LUVs made with PC:PE:PS and increasing [E2], or cholesterol (negative control). (B) Peak MC-540 F values from (A). Values are means ± SEM, from 3 independent LUVs preparations. * p<0.05; ** p<0.005 vs [E2] 0%. (C) Representative pressure-area (π-A) isotherms of DPPC monolayers containing 5 mol% E2 or cholesterol. (D) Average mean molecular area (Mma) at relevant surface pressures extrapolated from 3 independent π-A isotherms. (E) The surface elasticity moduli (Cs−1) as a function of Mma, corresponding to the respective π-A isotherms shown in panel C. (F) Cs−1 calculated from 3 independent π-A isotherms (dotted lines). Values are means +/− SEM.
Figure 6
Figure 6. E2 localizes to mitochondrial membranes and decreases microviscosity independent of ER α
(A) Representative extracted ion chromatograms for E2. (B) E2 content in mitochondrial membrane extracts measured by LC/MS. (C) Fluorescence MC-540 emission spectra in intact SM mitochondria. (D) Peak MC-540 F values from C. Data are means +/− SEM, * p<0.05, ** p<0.005, *** p<0.0005 vs NC-Pro, and # p<0.05, ## p<0.005 vs. OVX-4w[ctl], n=6-8 mice/group. (E) E2 content and respective CI relative specific activity (F). Values are means +/− SEM, * p<0.05 vs. NC-skmERαKO, and # p<0.05 vs. OVX-skmERαKO, N = 3-4 mice/group.
Figure 7
Figure 7. In-vitro E2 exposure of OVX mitochondria restores membrane microviscosity JH2O2 emitting potential and OXPHOS steady-state flux
(A) Experimental design. (B) E2 content in mitochondrial membranes. Values are means +/− SEM, N = 7-14 mice/group. (C) Peak F values from MC-540 emission spectra in fresh intact SM mitochondria pre-incubated +/− 3 nM E2. Values are means +/− SEM of three replicate measures, N = 8 mice/group. (D) Specific activities of complexes, measured as in Figure 4. N = 7 mice/group. (E) JH2O2 and (F) maximal JO2 capacity measured in isolated mitochondria as in Figure 1B. (G) JO2, (H) JATP, and (I) resulting ATP/O ratios (JATP/JO2), in the presence of G/M/Pyr/Succ and ADP. Values are means ± SEM. For all panels, * p<0.05, ** p<0.005 vs. NC-Pro, and ! p<0.05, !! p<0.005 vs. OVX-4w. N = 7 mice/group.

References

    1. Andersen OS, Koeppe RE., 2nd Bilayer thickness and membrane protein function: an energetic perspective. Annu Rev Biophys Biomol Struct. 2007;36:107–130. - PubMed
    1. Anderson EJ, Lustig ME, Boyle KE, Woodlief TL, Kane DA, Lin CT, Price JW, 3rd, Kang L, Rabinovitch PS, Szeto HH, et al. Mitochondrial H2O2 emission and cellular redox state link excess fat intake to insulin resistance in both rodents and humans. J Clin Invest. 2009;119:573–581. - PMC - PubMed
    1. Appiah D, Winters SJ, Hornung CA. Bilateral oophorectomy and the risk of incident diabetes in postmenopausal women. Diabetes Care. 2014;37:725–733. - PubMed
    1. Arias-Loza PA, Muehlfelder M, Pelzer T. Estrogen and estrogen receptors in cardiovascular oxidative stress. Pflugers Arch. 2013;465:739–746. - PubMed
    1. Bailey CJ, Ahmed-Sorour H. Role of ovarian hormones in the long-term control of glucose homeostasis. Effects of insulin secretion. Diabetologia. 1980;19:475–481. - PubMed

Publication types

MeSH terms

LinkOut - more resources