. 2017 Nov 16;68(4):745-757.e5.
doi: 10.1016/j.molcel.2017.10.008. Epub 2017 Nov 2.

R-ChIP Using Inactive RNase H Reveals Dynamic Coupling of R-loops with Transcriptional Pausing at Gene Promoters

Affiliations

R-ChIP Using Inactive RNase H Reveals Dynamic Coupling of R-loops with Transcriptional Pausing at Gene Promoters

Liang Chen et al. Mol Cell. .

Abstract

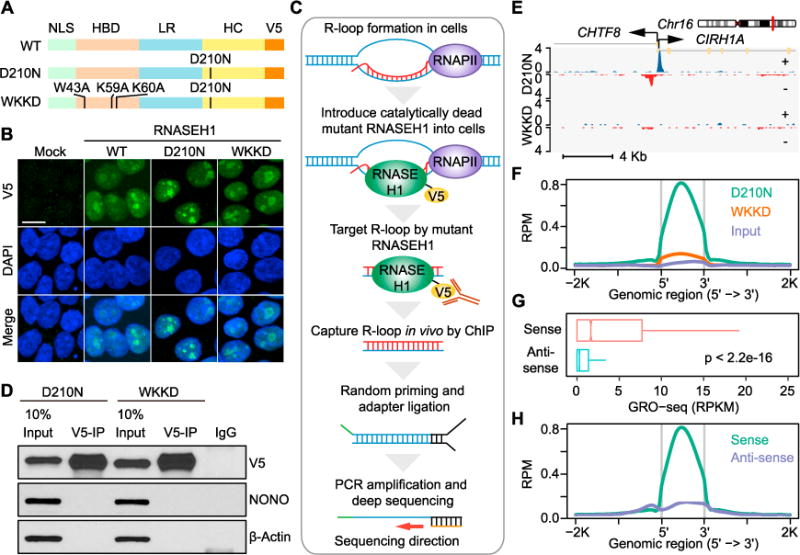
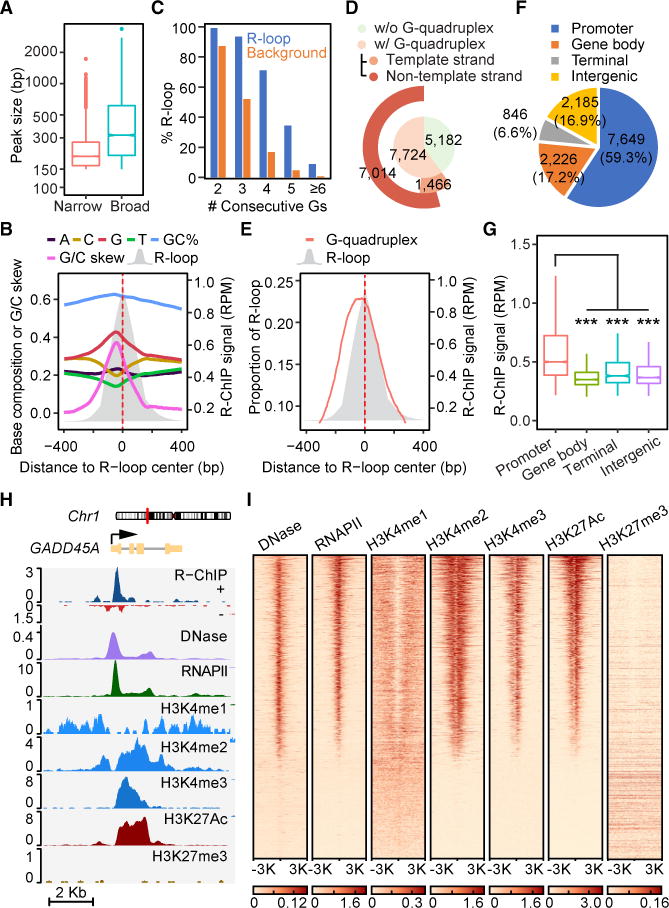
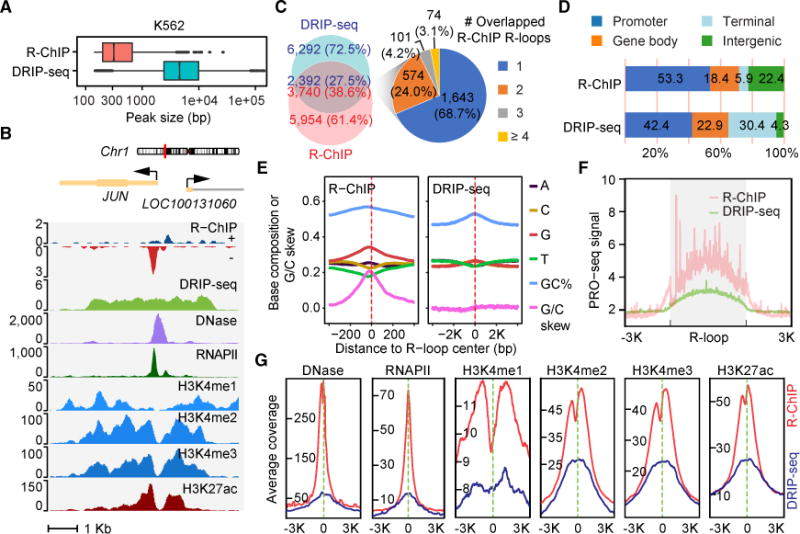
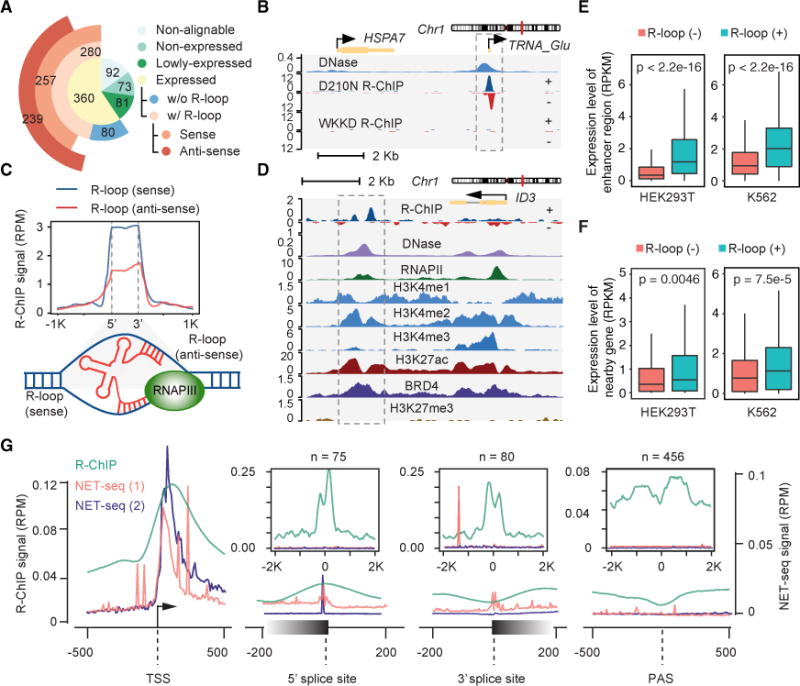
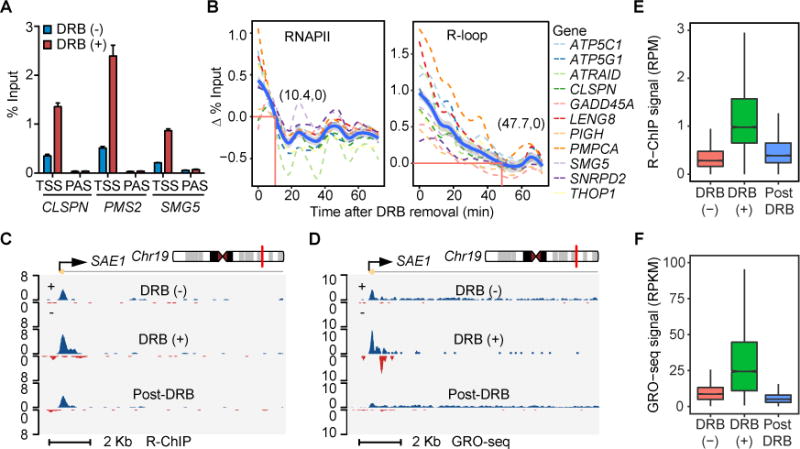
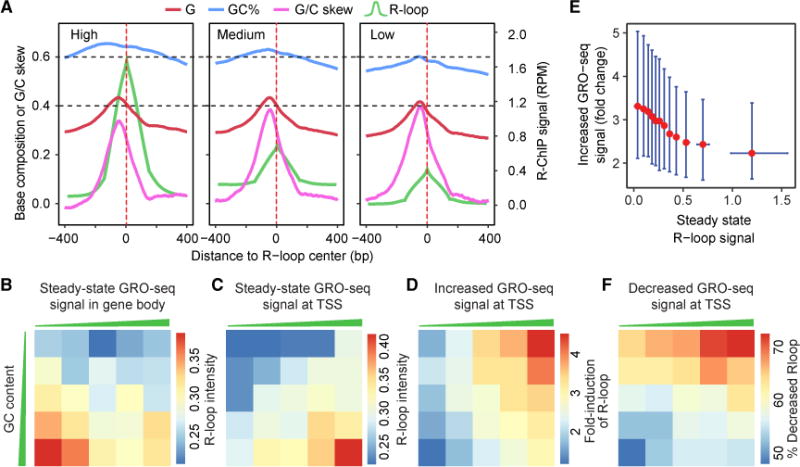
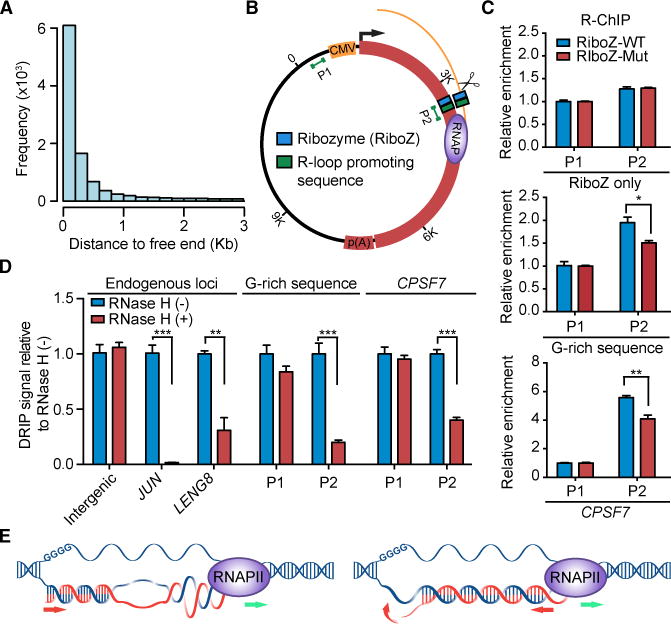
R-loop, a three-stranded RNA/DNA structure, has been linked to induced genome instability and regulated gene expression. To enable precision analysis of R-loops in vivo, we develop an RNase-H-based approach; this reveals predominant R-loop formation near gene promoters with strong G/C skew and propensity to form G-quadruplex in non-template DNA, corroborating with all biochemically established properties of R-loops. Transcription perturbation experiments further indicate that R-loop induction correlates to transcriptional pausing. Interestingly, we note that most mapped R-loops are each linked to a nearby free RNA end; by using a ribozyme to co-transcriptionally cleave nascent RNA, we demonstrate that such a free RNA end coupled with a G/C-skewed sequence is necessary and sufficient to induce R-loop. These findings provide a topological solution for RNA invasion into duplex DNA and suggest an order for R-loop initiation and elongation in an opposite direction to that previously proposed.

Keywords: Direction of R-loop elongation; Genomic Profiling of R-loops; RNASEH1; Requirement of free RNA end.


Figures

Figure 1
Figure 1. Genome-wide R-loop Profiling by Strand-Specific R-ChIP
(A) Design of RNASEH1 expression vectors. NLS, nuclear localization signal; HBD, RNA/DNA hybrid binding domain; LR, linker region; HC, RNA/DNA hybrid catalytic domain; V5, V5 tag. (B) Localization of exogenously expressed wild-type (WT) and mutant (D210N and WKKD) RNASEH1 in HEK293T cells by immunocytochemistry. Green: V5, Blue: DAPI; scale bar, 20 μm. (C) Schematic presentation of the R-ChIP strategy. (D) Immunoprecipitation of exogenously expressed RNASEH1 (D210N and WKKD mutants) by using anti-V5 antibody with similar efficiency. The levels of RNASEH1 were analyzed by western blotting relative to invariant nuclear protein NONO and cytoplasmic protein β-actin. (E) A representative genomic region showing the R-ChIP signals in cells expressing D210N or WKKD mutant proteins. Blue: + strand, Red: − strand. (F) The signal intensity profiles of R-ChIP within the peak regions in HEK293T cells expressing D210N versus WKKD relative to input. (G) The signal intensity of GRO-seq from the same (sense) or opposite (anti-sense) strand of individual R-ChIP peak regions. Wilcoxon test was used to calculate the p value. (H) The strand specificity of R-ChIP signals. The signals associated with a R-ChIP peak were divided into sense (in the same orientation of the peak) and anti-sense (in the opposite orientation of the peak) groups for comparison. See also Figure S1.
Figure 2
Figure 2. Sequence Features and Genomic Distribution of R-ChIP Signals
(A) The size distribution of R-ChIP peaks determined by the narrow or broad peak calling strategies of MACS2. See also Figure S2. (B) Base composition, G/C content, and G/C skew associated with a composite R-loop map. (C) Percentages of total R-loops according to associated consecutive G numbers (G-clusters) in the ±50 bp flanking region of the G/C skew summit in comparison with background. (D) Coincidence between R-ChIP mapped R-loops and potential G-quadruplex forming regions, emphasizing predominant overlap with G-quadruplex forming regions on the non-template DNA strand. (E) R-loop profile relative to sequences that have the potential to form G-quadruplex. (F) The genomic distribution of R-ChIP mapped R-loops. Various genomic regions are color coded according to the labels on the top. (G) The signal intensity distribution of R-ChIP peaks in different genomic regions. (H) A representative genomic region covering the GADD45A gene locus, showing R-ChIP signals relative to open chromatin (DNase-seq), RNAPII occupancy, and various chromatin marks.(I) The heatmap presentation of DNase-seq signals and ChIP-seq signals for RNAPII, H3K4me1, H3K4me2, H3K4me3, H3K27ac, and H3K27me3 in regions ±3 Kb from R-loop centers.
Figure 3
Figure 3. Systematic Comparison of R-loops Captured by the Catalytically Dead RNASEH1 versus S9.6
(A) The size distribution of R-loops determined by R-ChIP (n = 9,694) and DRIP-seq (n = 8,684) in K562 cells. (B) A representative genomic region covering the JUN locus, showing R-ChIP in comparison with DRIP-seq signals relative to various chromatin marks in K562 cells. (C) Left: overlap of peaks identified by R-ChIP and DRIP-seq. Right: R-ChIP and DRIP-seq overlapped peaks were divided into 4 groups according to the number of R-ChIP peaks covered by a single DRIP-seq peak. Each group in the pie chart is color coded according to the labels on the right. (D) The genomic distribution of R-loops mapped with R-ChIP and DRIP-seq. (E) The sequence features associated with R-loops mapped with R-ChIP and DRIP-seq. Note the 10-fold difference in R-loop size detected by R-ChIP versus DRIP-seq. (F) The signal intensity profiles of PRO-seq over the composite peak based on R-ChIP or DRIP-seq. (G) The signal intensity profiles of various chromatin marks in regions ±3 Kb from the center of R-ChIP or DRIP-seq mapped R-loops. See also Figures S3 and S4.
Figure 4
Figure 4. Other R-loop Hotspots in the Human Genome
(A) The number of tRNA genes in different categories according to reads alignability, expression level, and association with the R-loop captured by R-ChIP in HEK293T cells. See also Figures S5A–S5C. (B) A representative genomic region, showing R-ChIP enrichment at both sense and anti-sense strands of the TRNA_Glu gene locus in HEK293T cells. (C) Top: the signal intensity profile of R-loops on sense (non-template) and anti-sense (template) strands of tRNA genes, respectively. Bottom: a model showing R-loop formation through the interaction of a nascent tRNA transcript with both sense and anti-sense strands of DNA. See also Figure S5D. (D) A representative genomic region, showing R-ChIP captured R-loops downstream of the ID3 gene in comparison with various chromatin marks. (E) eRNA production levels associated with R-loop (−) versus (+) enhancers in HEK293T and K562 cells. Wilcoxon test was used to calculate indicated p values. (F) Transcription levels of neighboring genes ±50 Kb from R-loop (−) versus (+) enhancers in HEK293T and K562 cells. Wilcoxon test was used to calculate indicated p values. (G) R-ChIP signal intensities in comparison with nascent transcription levels detected by NET-seq (1: Mayer et al., 2015 on HEK293T cells; 2: Nojima et al., 2015 on HeLa cells) at TSSs, 5′ and 3′ splice sites, and poly(A) sites. The inserts display the signal intensity profiles of R-ChIP mapped R-loops (n = the number of R-loops) associated with 5′ splice sites, 3′ splice sites, and poly(A) sites. In each case, R-loops that were also associated with other genomic regions, e.g., promoter and enhancer regions, were excluded. Note the absence of RNAPII pausing at poly(A) sites or any of internal R-loops. See also Figure S5E.
Figure 5
Figure 5. Elevated RNAPII Pausing at TSS Allows for Increased R-loop Formation
(A) Induction of TSS-associated R-loops upon DRB treatment (2 hr) on three representative genes detected by R-ChIP-qPCR. Results were calculated as the percentage of input and presented as mean ± SEM (n = 3 technical replicates). (B) Dynamics of the RNAPII occupancy and R-loop level following DRB removal at TSS regions of 11 representative genes by RNAPII ChIP-qPCR and R-ChIP-qPCR. Cells were first treated with DRB for 2 hr and then collected every 6 min after DRB removal. Thick blue line: average RNAPII ChIP-qPCR and R-ChIP-qPCR values of 11 genes. Red lines indicate the time point, at which the average RNAPII occupancy or R-loop level returned to the baseline level in untreated cells. The associated numbers indicate the time (min) for returning to the baseline. (C and D) A representative genomic region covering the TSS region of SAE1, showing R-ChIP (C) and GRO-seq (D) signals in response to DRB treatment [DRB(+)] and removal (Post-DRB). (E and F) Signal intensity distribution of overall R-loop levels detected by R-ChIP (E) and RNAPII activities by GRO-seq (F) at TSSs in response to DRB treatment [DRB(+)] and removal (Post-DRB). See also Figure S6.
Figure 6
Figure 6. Correlation of R-loop Levels with G/C Content and RNAPII Pausing at TSSs
(A) R-loops were divided into three groups according to the R-ChIP signal intensity (green). The sequence features associated with each group are shown. (B) Division of promoter proximal regions (−30 to +300 bp from TSSs) into five groups according to local G/C content levels (y axis) and comparison with the overall transcriptional output measured by GRO-seq in gene bodies (x axis) in association with the median peak intensity of TSS-associated R-loops (color-coded squares). (C) Comparison between TSS-associated R-loop levels and TSS-associated transcription activities in different G/C groups. (D) Comparison between induced R-loop and induced GRO-seq signals at TSSs in different G/C groups after DRB treatment (2 hr). (E) Comparison between DRB-induced GRO-seq signals and steady-state R-loop levels at TSSs. Data are shown as median and interquartile range. (F) Comparison between decrease in R-loop levels and decline in GRO-seq signals in different G/C groups after DRB removal for 30 min.
Figure 7
Figure 7. Requirement of a Free RNA End for Promoting R-loop Formation and Proposed Model for R-loop Initiation and Elongation
(A) The distance distribution of known free RNA ends relative to R-ChIP mapped R-loops. (B) The R-loop reporter plasmid: WT or mutant hepatitis d ribozyme with or without a R-loop-promoting sequence were cloned into ~2.6 Kb downstream of the CMV promoter in a pcDNA5-based expression vector carrying part of the luciferase gene fused to the 3′UTR of the FUBP1 gene. Two pairs of primers targeting a promoter upstream region (P1) and the potential R-loop forming region (P2) were used for R-ChIP and DRIP analyses, as indicated. (C) R-ChIP-qPCR results on RNASEH1/D210N-expressing HEK293T cells transfected with plasmid containing WT or mutant ribozyme without any R-loop-promoting sequence (top), with a G-rich R-loop-promoting sequence (middle), or with a R-loop-promoting sequence from CPSF7 (bottom). Results were calculated as fold enrichment of signals at the P2 region relative to total input and then normalized against control signals from the P1 region. Data are presented as mean ± SEM (n = 4 technical replicates). *p < 0.05; **p < 0.01, unpaired Student’s t test. (D) DRIP-qPCR analysis on HEK293T cells transfected with plasmid containing WT ribozyme and individual R-loop-promoting sequences. Purified DNA from each sample was mock-treated or treated with RNase H before DRIP. Examined are one intergenic control region and two endogenous R-loop prone gene promoters identified by R-ChIP, as well as P1 and P2 regions on individual transfected plasmids. Results were calculated as relative DRIP-qPCR signals after setting signals from mock-treated samples as 1 and presented as mean ± SEM (n = 4 or 5 technical replicates). **p < 0.01; ***p < 0.001, unpaired Student’s t test. See also Figure S7 for stepwise data processing and normalization against the spike-in control. (E) Current and revised models for R-loop formation and elongation.

Comment in

References

    1. Belotserkovskii BP, Soo Shin JH, Hanawalt PC. Strong transcription blockage mediated by R-loop formation within a G-rich homopurine-homopyrimidine sequence localized in the vicinity of the promoter. Nucleic Acids Res. 2017;45:6589–6599. - PMC - PubMed
    1. Boguslawski SJ, Smith DE, Michalak MA, Mickelson KE, Yehle CO, Patterson WL, Carrico RJ. Characterization of monoclonal antibody to DNA.RNA and its application to immunodetection of hybrids. J Immunol Methods. 1986;89:123–130. - PubMed
    1. Bonnet A, Grosso AR, Elkaoutari A, Coleno E, Presle A, Sridhara SC, Janbon G, Geli V, de Almeida SF, Palancade B. Introns protect eukaryotic genomes from transcription-associated genetic instability. Mol Cell. 2017;67:608–621. - PubMed
    1. Cerritelli SM, Frolova EG, Feng C, Grinberg A, Love PE, Crouch RJ. Failure to produce mitochondrial DNA results in embryonic lethality in Rnaseh1 null mice. Mol Cell. 2003;11:807–815. - PubMed
    1. Chambers VS, Marsico G, Boutell JM, Di Antonio M, Smith GP, Balasubramanian S. High-throughput sequencing of DNA G-quadruplex structures in the human genome. Nat Biotechnol. 2015;33:877–881. - PubMed