

Evolving Choice Inconsistencies in Choice of Prescription Drug Insurance
- PMID: 29104294
- PMCID: PMC5665392
- DOI: 10.1257/aer.20130778
Evolving Choice Inconsistencies in Choice of Prescription Drug Insurance
Abstract
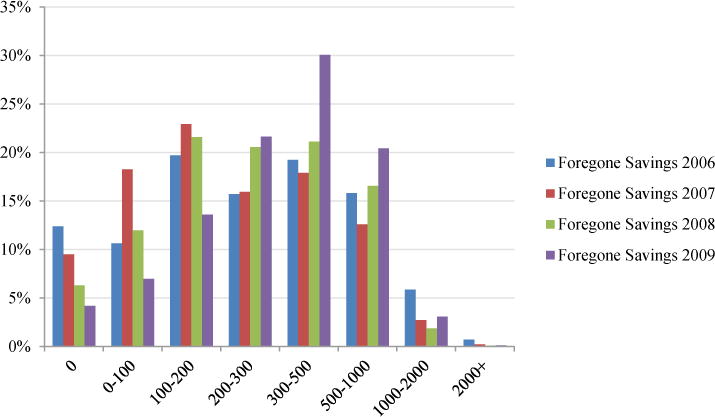
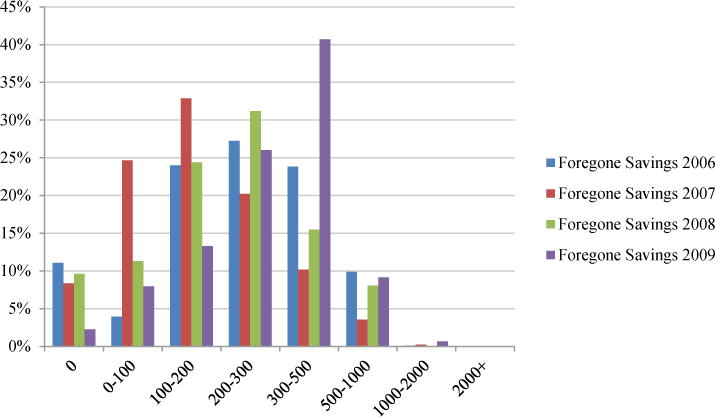
We study choice over prescription insurance plans by the elderly using government administrative data to evaluate how these choices evolve over time. We find large "foregone savings" from not choosing the lowest cost plan that has grown over time. We develop a structural framework to decompose the changes in "foregone welfare" from inconsistent choices into choice set changes and choice function changes from a fixed choice set. We find that foregone welfare increases over time due primarily to changes in plan characteristics such as premiums and out-of-pocket costs; we estimate little learning at either the individual or cohort level.
Conflict of interest statement
The authors declare that they have no relevant or material financial interests that relate to the research described in this paper.
Figures
References
-
- Abaluck Jason, Gruber Jon. National Bureau of Economic Research Working Paper 14759. 2009. Choice Inconsistencies Among the Elderly: Evidence from Plan Choice in the Medicare Part D Program.
-
- Abaluck Jason, Jonathan Gruber. Choice Inconsistencies among the Elderly: Evidence from Plan Choice in the Medicare Part D Program: Dataset. American Economic Review. 2011 http://www.aeaweb.org/articles.php?doi=10.1257/aer.101.4.1180. - PMC - PubMed
-
- Agarwal Sumit, Driscoll John, Gabaix Xavier, Laibson David. American Law & Economics Association Annual Meetings. Bepress; 2008. The age of reason: Financial decisions over the lifecycle; p. 97.
-
- Decarolis Francesco. Medicare Part D: Are Insurers Gaming the Low Income Subsidy Design? American Economic Review. 2015;105(4):1547–80. 2015. - PubMed
-
- Ericson Keith. Consumer Inertia and Firm Pricing in the Medicare Part D Prescription Drug Insurance Exchange. AEJ Economic Policy. 2014;6(1):38–64.
Publication types
MeSH terms
Grants and funding
LinkOut - more resources
Full Text Sources
Other Literature Sources
Medical