

Chronic Osteomyelitis Increases the Incidence of Type 2 Diabetes in Humans and Mice
- PMID: 29104510
- PMCID: PMC5666334
- DOI: 10.7150/ijbs.21379
Chronic Osteomyelitis Increases the Incidence of Type 2 Diabetes in Humans and Mice
Abstract
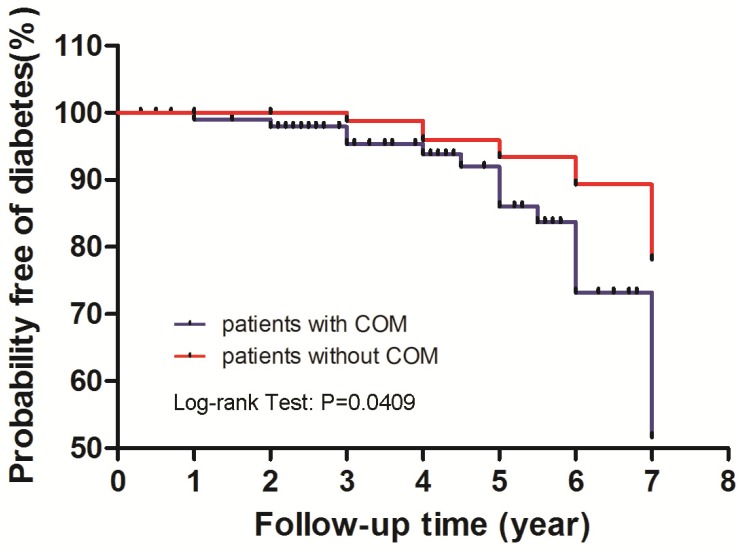
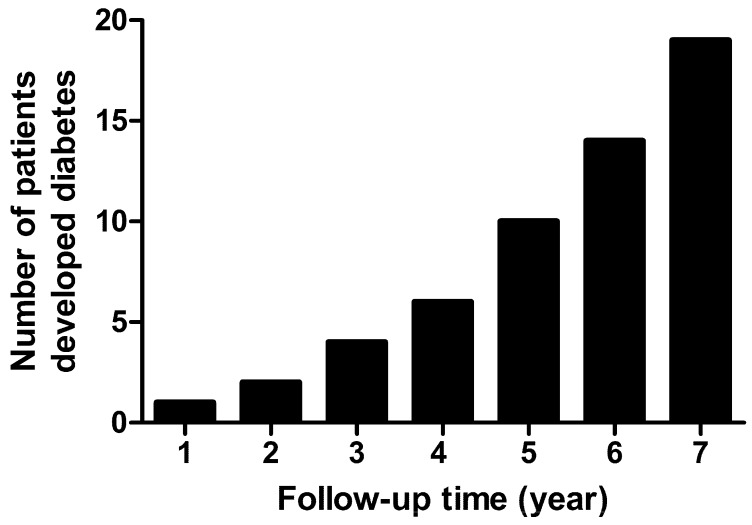
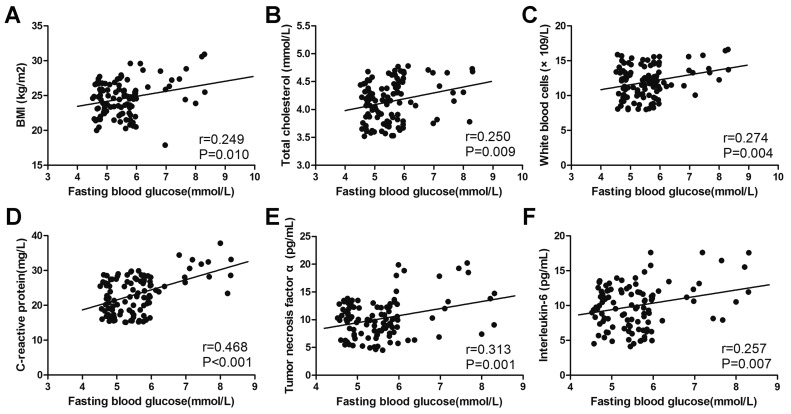
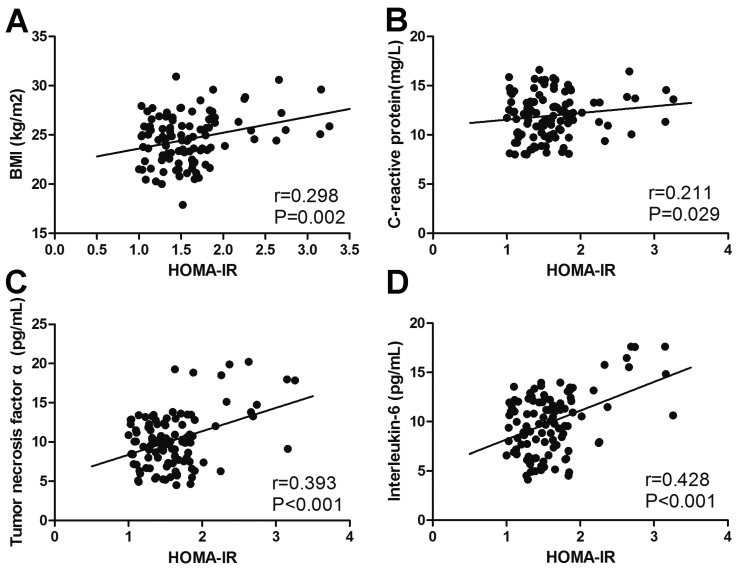
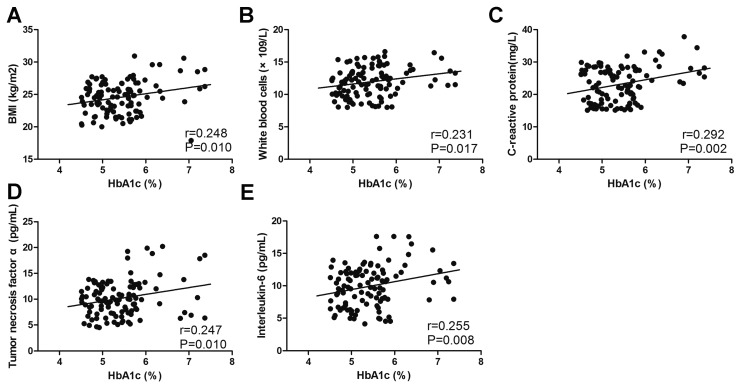
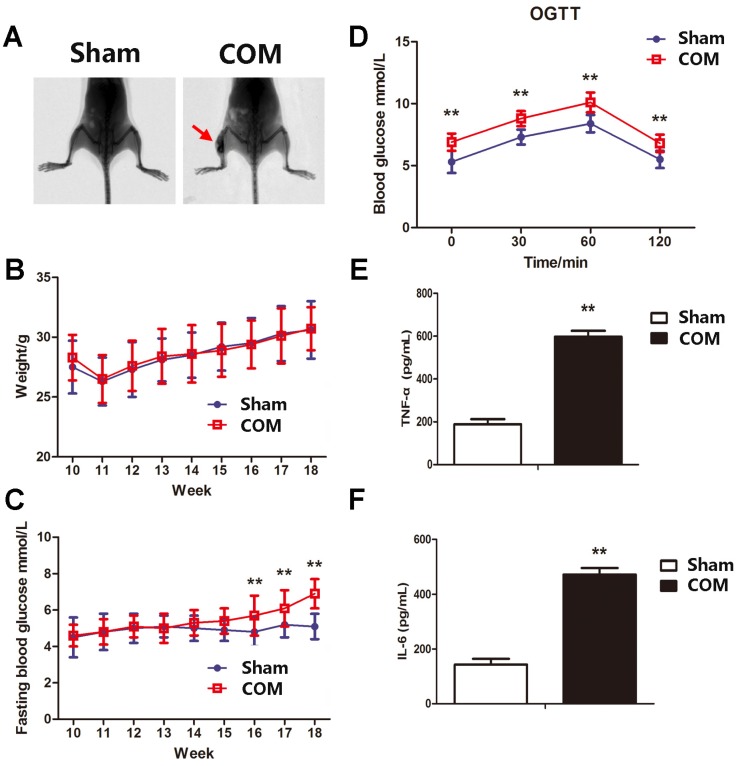
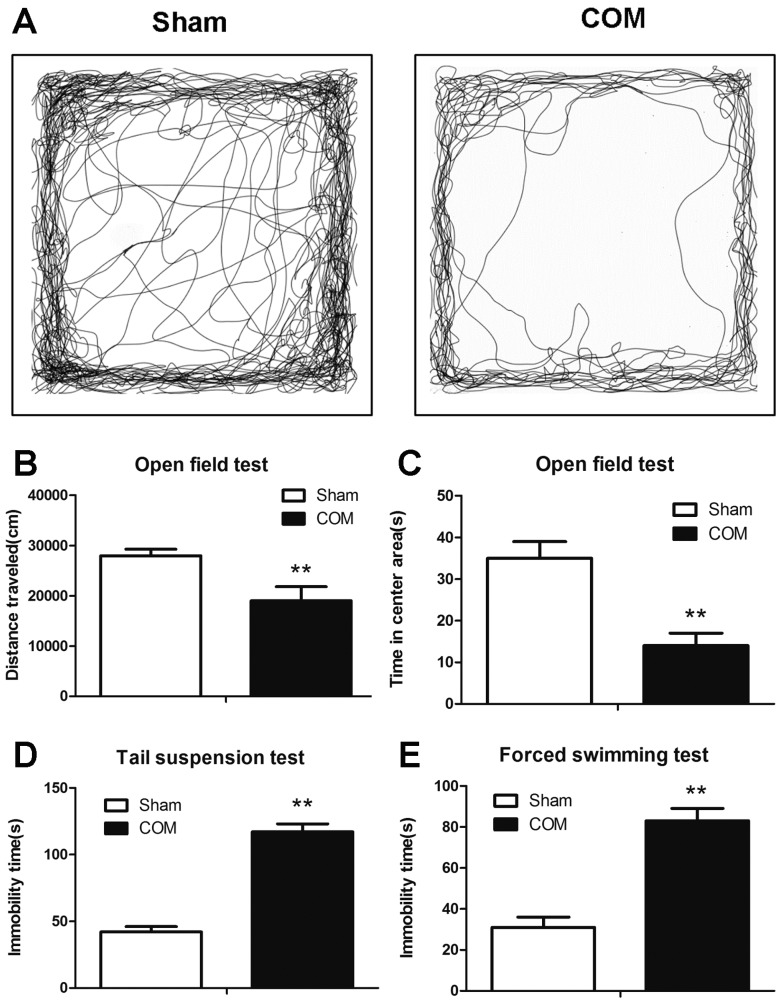
Background: To compare the risk of type 2 diabetes (T2DM) between patients with and without chronic osteomyelitis (COM), both in humans and in mice, and to explore risk factors in COM patients who developed T2DM. Methods: One hundred seven patients with COM and 114 patients without COM were consecutively enrolled and retrospectively analysed. Clinical data concerning the time to develop diabetes, glucose metabolism, lipid metabolism, inflammatory factors, mental health and frequency of specialist visits were collected. A mouse model of osteomyelitis was used to verify the presence of impaired glucose metabolism and depression. All data were processed by SPSS. Results: The incidence of T2DM was 2.37-fold higher in patients with COM than in those without. In COM patients, subjects with T2DM (DDM) had higher BMI, less exercise and more frequent visits to specialists than those without (Con). Glucose and lipid metabolism were worse in patients with DDM. Patients with DDM had higher levels of white blood cells (12.9±2.1×10⁹/L vs. 11.7±2.2×10⁹/L, p=0.027), CRP (28.4±4.5 mg/L vs. 22.0±4.8 mg/L, p<0.001), TNF-α (13.5±5.0 pg/mL vs. 9.4±2.6 pg/mL, p= 0.003) and IL-6 (12.9±3.2 pg/mL vs. 9.2±2.7 pg/mL, p<0.001). Significantly increased fasting blood glucose concentrations and impairment of oral glucose tolerance tests were also observed in mice modelling osteomyelitis, which were accompanied by elevated TNF-α and IL-6 levels. Furthermore, the proportion of depression (63.2% vs. 35.2%, p=0.003) and severe anxiety (31.6% vs. 9.1%, p=0.002) were significantly higher in the DDM group. Osteomyelitis mice showed obvious depressive-like behaviours. The levels of TNF-α, IL-6, CRP, BMI, and LDL; lack of exercise; SAS; HAQ; and SF36 assessment were risk factors for the development of T2DM in COM patients. Conclusions: Chronic osteomyelitis increased the incidence of T2DM in both humans and mice. Inflammation, mental illness and lack of exercise were risk factors for the occurrence of T2DM in osteomyelitis. Comprehensive consideration of patient history, including metabolism and mental health, is needed in planning future treatment.
Keywords: chronic osteomyelitis; diabetes; inflammation; insulin resistance; mental health.; risk.
Conflict of interest statement
Competing Interests: The authors have declared that no competing interest exists.
Figures
References
-
- Schmitt SK. Osteomyelitis. Infect Dis Clin North Am. 2017;31:325–38. - PubMed
-
- Donath MY. Targeting inflammation in the treatment of type 2 diabetes: time to start. Nat Rev Drug Discov. 2014;13:465–76. - PubMed
-
- Xu Y, Wang L, He J. et al. Prevalence and control of diabetes in Chinese adults. JAMA. 2013;310:948–59. - PubMed
-
- Petrakis I, Kyriopoulos IJ, Ginis A. et al. Losing a foot versus losing a dollar; a systematic review of cost studies in diabetic foot complications. Expert Rev Pharmacoecon Outcomes Res. 2017;17:165–80. - PubMed
Publication types
MeSH terms
Substances
LinkOut - more resources
Full Text Sources
Other Literature Sources
Medical
Research Materials
Miscellaneous
