. 2017 Oct 20:8:1323.
doi: 10.3389/fimmu.2017.01323. eCollection 2017.

Endothelial Regulator of Calcineurin 1 Promotes Barrier Integrity and Modulates Histamine-Induced Barrier Dysfunction in Anaphylaxis

Affiliations

Endothelial Regulator of Calcineurin 1 Promotes Barrier Integrity and Modulates Histamine-Induced Barrier Dysfunction in Anaphylaxis

Constanza Ballesteros-Martinez et al. Front Immunol. .

Abstract

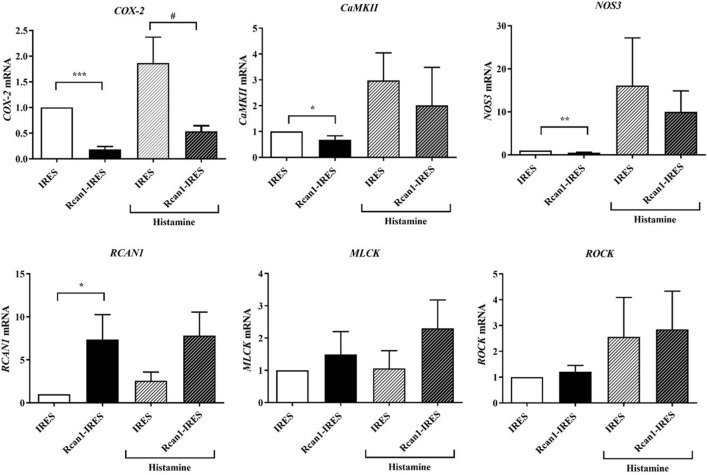
Anaphylaxis, the most serious and life-threatening allergic reaction, produces the release of inflammatory mediators by mast cells and basophils. Regulator of calcineurin 1 (Rcan1) is a negative regulator of mast-cell degranulation. The action of mediators leads to vasodilation and an increase in vascular permeability, causing great loss of intravascular volume in a short time. Nevertheless, the molecular basis remains unexplored on the vascular level. We investigated Rcan1 expression induced by histamine, platelet-activating factor (PAF), and epinephrine in primary human vein (HV)-/artery (HA)-derived endothelial cells (ECs) and human dermal microvascular ECs (HMVEC-D). Vascular permeability was analyzed in vitro in human ECs with forced Rcan1 expression using Transwell migration assays and in vivo using Rcan1 knockout mice. Histamine, but neither PAF nor epinephrine, induced Rcan1-4 mRNA and protein expression in primary HV-ECs, HA-ECs, and HMVEC-D through histamine receptor 1 (H1R). These effects were prevented by pharmacological inhibition of calcineurin with cyclosporine A. Moreover, intravenous histamine administration increased Rcan1 expression in lung tissues of mice undergoing experimental anaphylaxis. Functional in vitro assays showed that overexpression of Rcan1 promotes barrier integrity, suggesting a role played by this molecule in vascular permeability. Consistent with these findings, in vivo models of subcutaneous and intravenous histamine-mediated fluid extravasation showed increased response in skin, aorta, and lungs of Rcan1-deficient mice compared with wild-type animals. These findings reveal that endothelial Rcan1 is synthesized in response to histamine through a calcineurin-sensitive pathway and may reduce barrier breakdown, thus contributing to the strengthening of the endothelium and resistance to anaphylaxis. These new insights underscore its potential role as a regulator of sensitivity to anaphylaxis in humans.

Keywords: anaphylaxis; endothelial cells; histamine; regulator of calcineurin 1; vascular permeability.


Figures

Figure 1
Figure 1
Histamine increases Rcan1-4 protein and mRNA expression in human vein (HV)-endothelial cells (ECs). HV-ECs were treated with epinephrine (1 µM), histamine (1 µM), or platelet-activating factor (PAF) (0.1 µM) at indicated times. (A) Representative immunoblots show Rcan1-1 (35 kDa) and Rcan1-4 (28 kDa) expression in stimulated extracts. (B) Quantifications were normalized to β-actin and expressed as times of relative change to nonstimulated (basal) cells. Data represent means ± SEM of three and four experiments performed at 30 and 60 min, respectively. One-way ANOVA followed Bonferroni’s multiple comparisons test was performed for each time studied [*P = 0.0375 vs basal (30 min), ****P < 0.0001 (60 min)]. (C) qPCR analysis of Rcan1-1 and Rcan1-4 mRNA with indicated stimulus and times normalized to the endogenous 18s gene. Data represent means ± SEM of four experiments performed at 15, 30, and 60 min. One-way ANOVA followed Bonferroni’s multiple comparisons test was performed (**P = 0.0052 vs basal). (D–E) HV-ECs were treated with epinephrine, histamine, and histamine in the presence of epinephrine at indicated times. (D) Representative immunoblots. (E) Quantifications were normalized to β-actin and expressed as times of relative change to nonstimulated (basal) cells. Data represent means ± SEM of five experiments performed at 15, 30, and 60 min. One-way ANOVA followed Bonferroni’s multiple comparisons test was performed (****P < 0.0001, ***P = 0.0009 vs basal). (F) qPCR analysis of total Rcan1 mRNA with indicated stimulus and times normalized to endogenous gene expression. Data represent means ± SEM of six experiments performed at 15, 30, and 60 min. One-way ANOVA followed Bonferroni’s multiple comparisons test was performed (****P < 0.0001, **P = 0.0019).
Figure 2
Figure 2
Rcan1-4 expression is modulated in response to histamine in other cellular microenvironments—HA-ECs, HMVEC-D, and lungs from experimental anaphylaxis. HA-ECs and HMVEC-D were treated with epinephrine (1 µM) and/or histamine (1 µM). (A) Representative immunoblots show Rcan1-1 (35 kDa) and Rcan1-4 (28 kDa) expression in stimulated HA-ECs for 15, 30, and 60 min. (B) Quantifications were normalized to β-actin and expressed as times of relative change to nonstimulated (basal) cells. (C) Representative immunoblots show Rcan1-1 (35 kDa) and Rcan1-4 (28 kDa) expression in HMVEC-D for 60 min. (D) Quantifications were normalized to β-actin and expressed as times of relative change to nonstimulated (basal) cells. Data represent means ± SEM of five experiments performed per cellular type at 60 min. One-way ANOVA followed Bonferroni’s multiple comparisons test was performed for each cellular type studied (HA-ECs; *P = 0.0115, vs basal, HMVEC-D; *P = 0.0135, vs basal). (E) Immunoblots include representative lung extracts from wild-type control mice C57BL6, injected i.v. with Hist, active systemic anaphylaxis (ASA), or passive systemic anaphylaxis (PSA). (F) Quantification was normalized to GAPDH and expressed as times of relative change to control mice. Data represent means ± SEM of five animals per group. Unpaired t-tests were performed vs control (Rcan1-1 *P = 0.0462; Rcan1-4 *P < 0.02).
Figure 3
Figure 3
Histamine induces Rcan1-4 protein expression via its H1 receptor and CsA sensitive manner. Cells were preincubated with diphenhydramine hydrochloride (H1 receptor antagonist) and famotidine (H2 receptor antagonist) for 30 min at indicated concentrations previously to histamine 1 µM stimulation. (A) Representative immunoblots show Rcan1-1 (35 kDa) and Rcan1-4 (28 kDa) expression in stimulated human vein (HV)-endothelial cells (ECs). (B) Quantifications were normalized to β-actin and expressed as times of relative change to nonstimulated (basal) cells. Data represent means ± SEM of five experiments performed. One-way ANOVA followed Bonferroni’s multiple comparisons test was performed (*P < 0.05). (C,D) Representative immunoblots show Rcan1-1 (35 kDa) and Rcan1-4 (28 kDa) expression in stimulated HV-ECs and HA-ECs preincubated with diphenhydramine hydrochloride, famotidine and a combination of both at a concentration of 10−5 M. (E,F) Rcan1 immunoblot in extracts from HV-ECs stimulated with histamine 1 µM at indicated times after pretreatment as indicated (30 min) with 200 ng/ml CsA (cyclosporine A). Representative immunoblots show Rcan1-1 (35 kDa) and Rcan1-4 (28 kDa) expression in stimulated HV-ECs. (F) Quantifications were normalized to β-actin and expressed as times of relative change to non-stimulated (basal) cells. Data represent means ± SEM of five and six experiments, respectively, performed on HV-ECs (black bars) and HMVEC-D (white bars) at 60 min. One-way ANOVA followed Bonferroni’s multiple comparisons tests were performed (HV-ECs *P = 0.0232; HMVEC-D **P = 0.0022). (G) qPCR analysis of Rcan1-1 and Rcan1-4 mRNA with indicated stimulus normalized to the endogenous 18s gene. Data represent means ± SEM of four experiments performed at 60 min. One-way ANOVA followed Bonferroni’s multiple comparisons test was performed (*P = 0.0197 vs basal).
Figure 4
Figure 4
Regulator of calcineurin 1 (Rcan1) maintains the endothelial barrier integrity in human vein (HV)-endothelial cells (ECs). (A) Integrity of endothelial monolayers was evaluated using TW assays. (B) Quantification of FITC-Dextran molecules extravasated to the TW container and expressed as times of relative change to untreated (basal) cells for 5 (left bars), 30, and 120 min (right bars). Data represent means ± SEM of duplicates determined by TW in five independent experiments performed on HMVEC-D. One-way ANOVA followed Bonferroni’s multiple comparisons tests were performed for each time studied (*P < 0.05, **P < 0.001). (C) Quantifications expressed as times of relative change to untreated HV-ECs or HA-ECs, respectively, for 30 min. Data represent means ± SEM of duplicates determined by TW in five independent experiments performed in each genotype. Unpaired t-tests were performed vs basal cells (***P = 0.0003 vs basal HV-ECs). (D) The correct infection with lentiviral constructions expressing IRES-GFP or Rcan1-GFP were detected by fluorescence microscopy and analyzed by Western blot. The panel shows Rcan1-IRES-GFP extracts modified by infection expressing both exogenously overexpressed isoforms (Rcan1-1 and Rcan1-4). (E) Quantification of FITC-dextran molecules extravasated to the TW container and expressed as times of relative change to IRES-GFP cells not treated with histamine 1 µM for 30 min. Data represent means ± SEM of duplicates determined by TW in six (IRES-GFP) and seven (Rcan1-IRES-GFP) independent experiments performed on HV-ECs. One-way ANOVA followed Bonferroni’s multiple comparisons tests was performed (**P < 0.0057, ##P < 0.0094, &&P < 0.0012 vs IRES-GFP control). (F) Quantification of FITC-dextran molecules extravasated to the TW container and expressed as times of relative change to IRES-GFP cells for 5, 30, and 120 min. Data represent means ± SEM of duplicates determined by TW in three independent experiments performed on HV-ECs. One-way ANOVA followed Bonferroni’s multiple comparisons tests was performed (***P = 0.0007, **P = 0.0069 vs IRES-GFP).
Figure 5
Figure 5
Regulator of calcineurin 1 (Rcan1)-IRES-GFP inhibits COX2, CaMKII, and nitric oxide synthase 3 (NOS3) expression in human vein (HV)-endothelial cells (ECs). Figure shows the qPCR analysis of COX2, CaMKII, NOS3, MLC-kinase (MLCK), ROCK1, and RCAN1 mRNA of IRES-GFP and Rcan1-IRES-GFP HV-ECs treated or not with Hist 1 µM for 60 min. Values represent amounts of mRNA normalized to the endogenous gene. Unpaired t-test analysis was applied to untreated or histamine-treated cells. Data represent means ± SEM of duplicates determined by qPCR from indicated independent experiments: COX-2; ****P < 0.0001, Rcan1-IRES-GFP control (n = 13) vs IRES-GFP control (n = 12); #P = 0.0130, Rcan1-IRES-GFP histamine (n = 14) vs IRES-GFP histamine (n = 15); CaMKII; *P = 0.0454, Rcan1-IRES-GFP control (n = 9) vs IRES-GFP control (n = 8); Rcan1-IRES-GFP histamine (n = 6) vs IRES-GFP histamine (n = 6); NOS3; **P = 0.0044, Rcan1-IRES-GFP control (n = 6) vs IRES-GFP control (n = 6); Rcan1-IRES-GFP histamine (n = 5) vs IRES-GFP histamine (n = 5); RCAN1; *P = 0.0392, Rcan1-IRES-GFP control (n = 10) vs IRES-GFP control (n = 10); Rcan1-IRES-GFP histamine (n = 11) vs IRES-GFP histamine (n = 9); MLCK; Rcan1-IRES-GFP control (n = 9) vs IRES-GFP control (n = 10); Rcan1-IRES-GFP histamine (n = 8) vs IRES-GFP histamine (n = 6); ROCK1; Rcan1-IRES-GFP control (n = 10) vs IRES-GFP control (n = 11); Rcan1-IRES-GFP histamine (n = 11) vs IRES-GFP histamine (n = 9).
Figure 6
Figure 6
Regulator of calcineurin 1 (Rcan1)-deficient mice prevent histamine-induced vascular subcutaneous and systemic permeability but not systemic anaphylaxis. (A) Experimental mice models addressed in WT and Rcan1−/− mice. (B) Representative skin pictures of WT and Rcan1−/− mice s.c. injected with mediators at indicated concentrations. Evans blue extravasation was determined in four mice per genotype after subcutaneous injection of 20 µl of the indicated doses of histamine or PAF. Figure shows the amounts of Evans blue determined in skin dorsal punches as described in the Section “Materials and Methods.” Data represent means ± SEM. Unpaired t-tests were performed vs WT mice for each treatment and doses, *P = 0.0138 vs WT (5 ng/ml), *P = 0.0441 vs WT (50 ng/ml). (C) Graphic shows individual values of aorta and lung extravasation determined in seven (WT) and eight (Rcan1−/−) mice after 15 min of i.v. histamine injection together with Evans blue. Figure shows the amounts of Evans blue determined in tissues as described in the Section “Materials and Methods.” Data represent means ± SEM. Unpaired t-tests were performed vs WT mice. Aorta; *P = 0.0357, Lung; *P = 0.0319, Heart; ns = 0.1879 compared with Histamine WT mice.

References

    1. Sampson HA, Munoz-Furlong A, Campbell RL, Adkinson NF, Jr, Bock SA, Branum A, et al. Second symposium on the definition and management of anaphylaxis: summary report – Second National Institute of Allergy and Infectious Disease/Food Allergy and Anaphylaxis Network symposium. J Allergy Clin Immunol (2006) 117(2):391–7. 10.1016/j.jaci.2005.12.1303 - DOI - PubMed
    1. Khan BQ, Kemp SF. Pathophysiology of anaphylaxis. Curr Opin Allergy Clin Immunol (2011) 11(4):319–25. 10.1097/ACI.0b013e3283481ab6 - DOI - PubMed
    1. Joint Task Force on Practice Parameters; American Academy of Allergy, Asthma and Immunology; American College of Allergy, Asthma and Immunology; Joint Council of Allergy, Asthma and Immunology. The diagnosis and management of anaphylaxis: an updated practice parameter. J Allergy Clin Immunol (2005) 115(3 Suppl 2):S483–523. 10.1016/j.jaci.2005.01.010 - DOI - PubMed
    1. Brown SG. The pathophysiology of shock in anaphylaxis. Immunol Allergy Clin North Am (2007) 27(2):165–75,v. 10.1016/j.iac.2007.03.003 - DOI - PubMed
    1. Finkelman FD, Khodoun MV, Strait R. Human IgE-independent systemic anaphylaxis. J Allergy Clin Immunol (2016) 137(6):1674–80. 10.1016/j.jaci.2016.02.015 - DOI - PMC - PubMed

LinkOut - more resources