. 2017 Dec 1;127(12):4365-4378.
doi: 10.1172/JCI89885. Epub 2017 Nov 6.

S-sulfocysteine/NMDA receptor-dependent signaling underlies neurodegeneration in molybdenum cofactor deficiency

Affiliations

S-sulfocysteine/NMDA receptor-dependent signaling underlies neurodegeneration in molybdenum cofactor deficiency

Avadh Kumar et al. J Clin Invest. .

Abstract

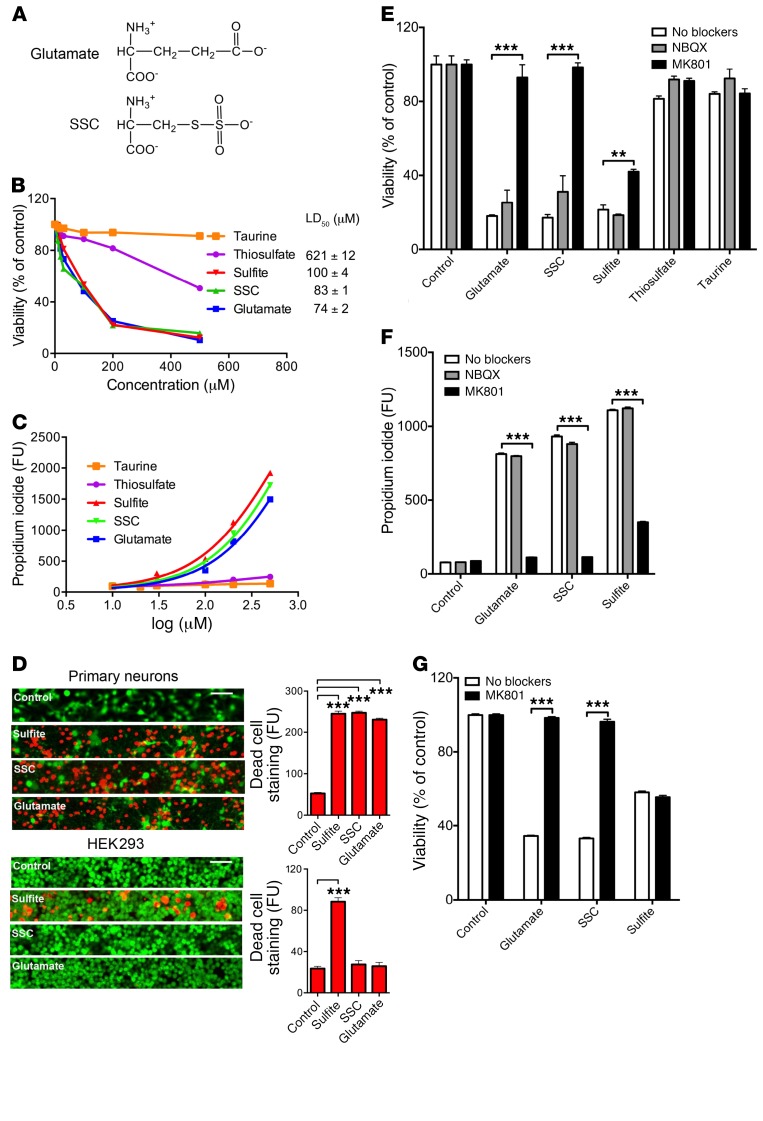
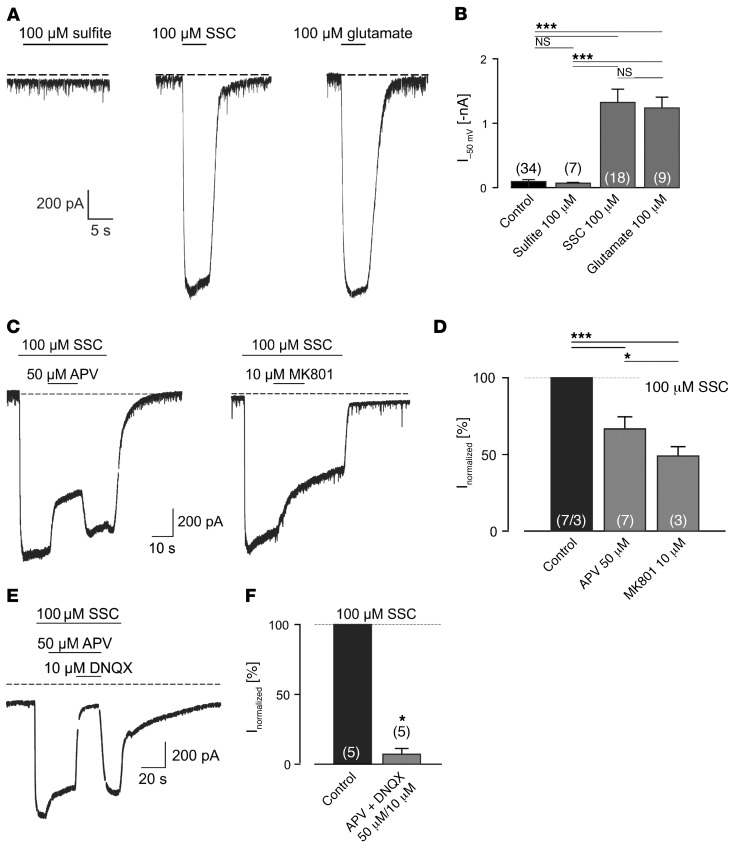
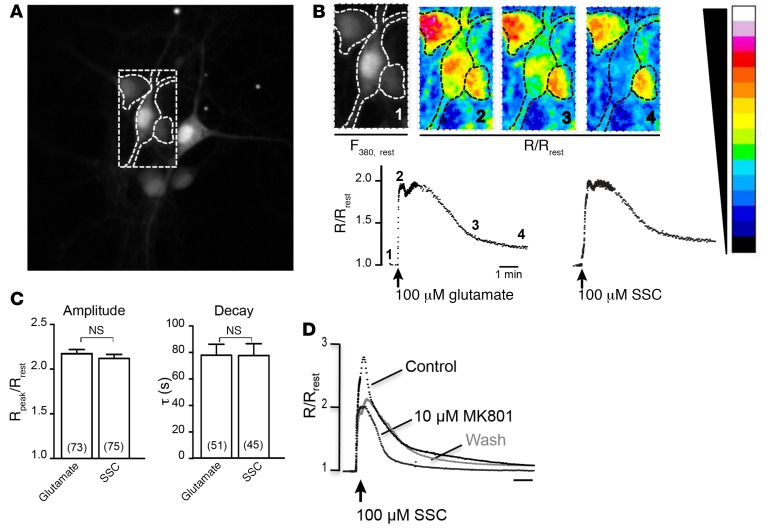
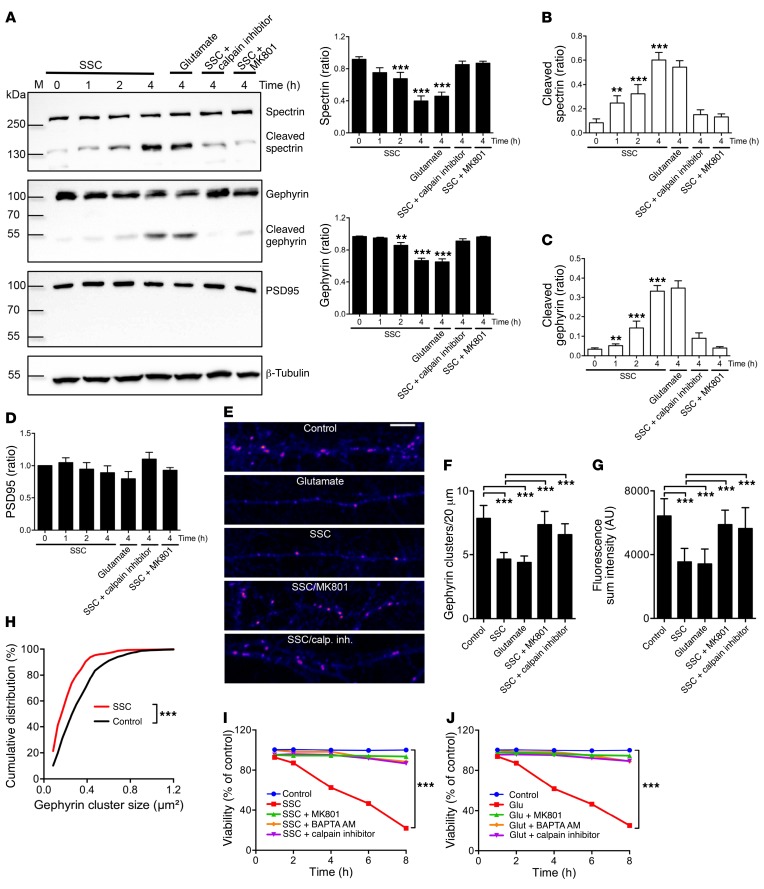
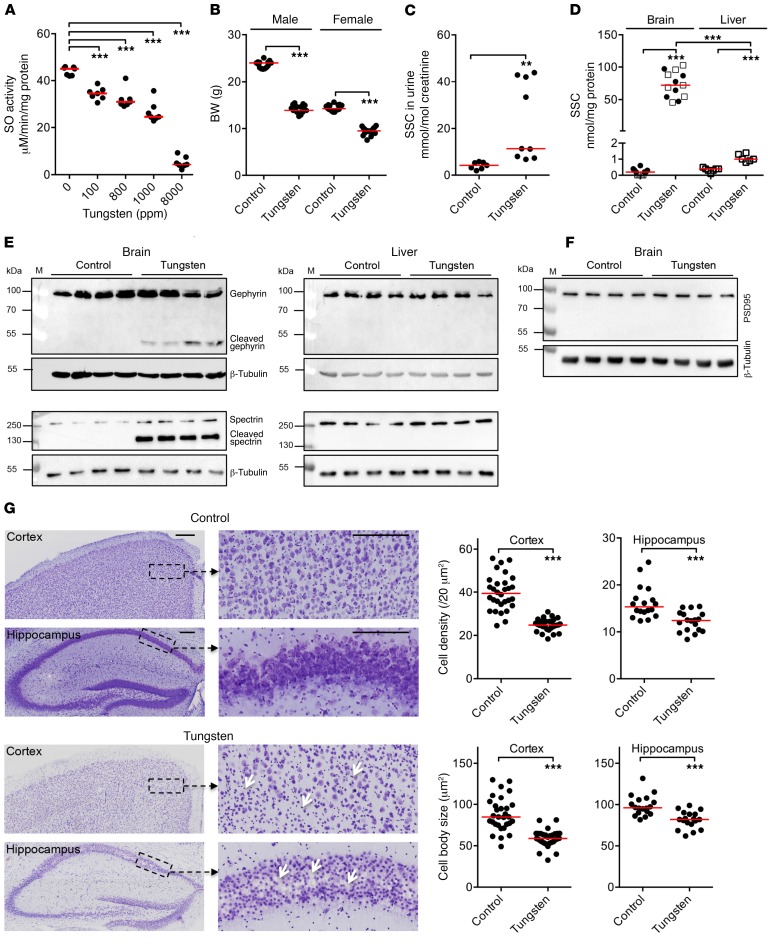
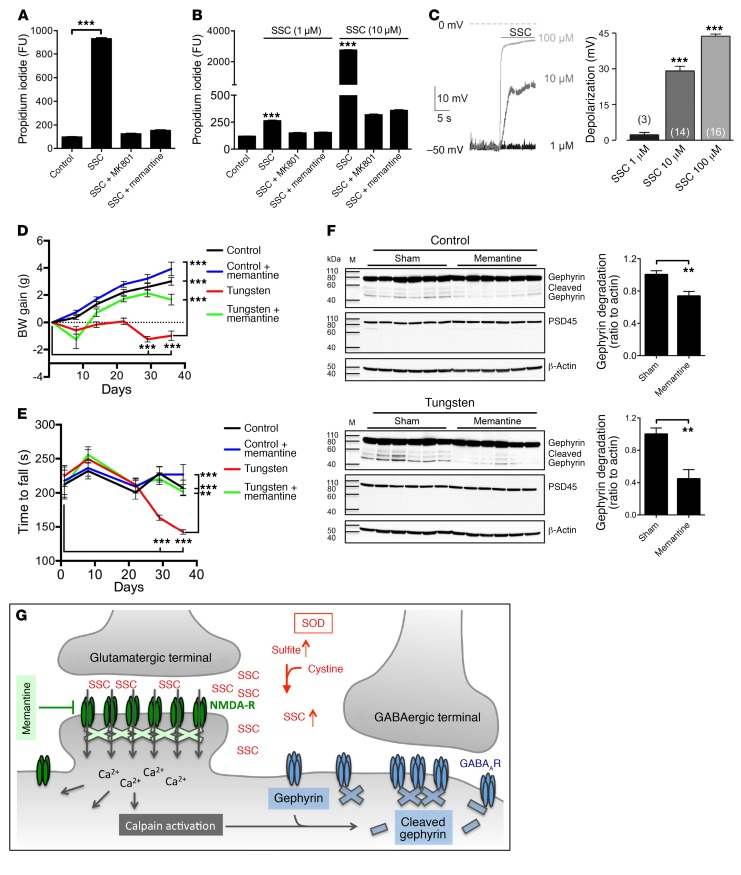
Molybdenum cofactor deficiency (MoCD) is an autosomal recessive inborn error of metabolism characterized by neurodegeneration and death in early childhood. The rapid and progressive neurodegeneration in MoCD presents a major clinical challenge and may relate to the poor understanding of the molecular mechanisms involved. Recently, we reported that treating patients with cyclic pyranopterin monophosphate (cPMP) is a successful therapy for a subset of infants with MoCD and prevents irreversible brain damage. Here, we studied S-sulfocysteine (SSC), a structural analog of glutamate that accumulates in the plasma and urine of patients with MoCD, and demonstrated that it acts as an N-methyl D-aspartate receptor (NMDA-R) agonist, leading to calcium influx and downstream cell signaling events and neurotoxicity. SSC treatment activated the protease calpain, and calpain-dependent degradation of the inhibitory synaptic protein gephyrin subsequently exacerbated SSC-mediated excitotoxicity and promoted loss of GABAergic synapses. Pharmacological blockade of NMDA-R, calcium influx, or calpain activity abolished SSC and glutamate neurotoxicity in primary murine neurons. Finally, the NMDA-R antagonist memantine was protective against the manifestation of symptoms in a tungstate-induced MoCD mouse model. These findings demonstrate that SSC drives excitotoxic neurodegeneration in MoCD and introduce NMDA-R antagonists as potential therapeutics for this fatal disease.

Keywords: Neurodegeneration; Neuroscience.


Conflict of interest statement

Conflict of interest: The authors have declared that no conflict of interest exists.

Figures

Figure 1
Figure 1. Sulfite toxicity in neuronal tissue is mediated by SSC activation of the NMDA-R.
(A) Chemical structure of glutamate and SSC. (B and C) Dose-dependent toxicity of taurine, thiosulfate, sulfite, SSC, and glutamate in cortical neurons after a 12-hour incubation in culture medium, as assessed by MTT assay (n = 3) (B) or propidium iodide staining (n = 9) (C). Cultures were treated with either vehicle (control) or 10, 20, 50, 100, 200, and 500 μM of each of the investigated metabolites, and the LD50 values are highlighted for each metabolite using the MTT assay. (D) Representative images of live/dead staining under control conditions and in the presence of sulfite, SSC, or glutamate in primary neurons and HEK293 cells. Scale bars: 20 μm. The quantification of dead cells (red signal) was performed by measuring the fluorescence of ethidium homodimer-1 (n = 6 for each condition). (E and F) Cell viability of cortical neurons measured by (E) MTT assay for glutamate, SSC, sulfite, thiosulfate, and taurine (each 200 μM) (n = 3) and (F) propidium iodide staining for glutamate, SSC, and sulfite at the same concentration (n = 12) in the presence of the NMDA-R blocker MK801 (1 μM) and the AMPA-R blocker NBQX (20 μM). (G) Cell viability of cortical neurons in ACSF media in the absence and presence of the NMDA-R blocker MK801 for glutamate, sulfite, and SSC (n = 3). Data are presented as the mean ± SEM. **P < 0.01 and ***P < 0.001, by 2-Way ANOVA with Dunnett’s (DF) or Sidak’s (G) multiple comparisons test. FU, fluorescence units.
Figure 2
Figure 2. SSC, not sulfite, evokes somatic membrane currents and depolarizes the neuronal membrane potential.
(A) Current traces of hippocampal neurons at –50 mV in the presence of 0.3 μM TTX and 100 μM sulfite, SSC, or glutamate. (B) Quantification of current amplitudes under basal conditions and in the presence of 100 μM sulfite, 100 μM SSC, or 100 μM glutamate. (C) NMDA-R antagonists markedly decreased SSC-evoked current amplitudes in hippocampal neurons. (D) Quantification of the percentage of inhibition of tonic SSC–evoked currents by NMDA-R antagonists. Current amplitudes in the presence of 10 μM MK801 or 50 μM APV were normalized to SSC-induced current peaks. (E) Application of both APV and DNQX almost completely blocked SSC-elicited currents. (F) Quantification of the additive effect of NMDA-R and AMPA-R blocker on current amplitudes. Data are presented as the mean ± SEM. Numbers in parentheses in B, D, and F indicate the number of recorded neurons. *P < 0.05 and ***P < 0.001, by 1-way ANOVA with Tukey’s multiple comparisons test.
Figure 3
Figure 3. SSC, like glutamate, induces calcium influx (32.
(A) Fluorescence image (F380) of fura-2 AM–loaded cortical neurons. (B) Glutamate and SSC induced a similar Ca2+ influx. (B) Intracellular Ca2+ dynamics of a cortical neuron in response to a 10-second bath application of 100 μM glutamate (left trace) and 100 μM SSC (right trace). The images show the framed region of A at higher magnification and demonstrate the glutamate-induced increase in cytosolic Ca2+ concentration. The numbers indicate the time points of the traces when the images were taken. (C) Maximal amplitude and decay time constant of the glutamate- and SSC-induced rise in cytosolic Ca2+. The numbers in parentheses indicate the number of recorded neurons. (D) SSC-induced Ca2+ dynamics of a cortical neuron before, during, and after application of the NMDA-R blocker MK801. Data are presented as the mean ± SEM. Data were analyzed using a 2-tailed, unpaired Student’s t test.
Figure 4
Figure 4. SSC-mediated calcium influx activates calpain and leads to gephyrin degradation.
(A) Representative Western blots of spectrin, gephyrin, and PSD95 in hippocampal neurons treated with glutamate (100 μM), SSC alone (100 μM), SSC plus calpain inhibitor (10 μM), or SSC plus MK801 (1 μM) at different time points. M, molecular weight marker. Quantification of band intensities of full-length and cleaved spectrin (B), gephyrin (C), and full-length PSD95 (D). At least 5 Western blots per condition from 3 independent neuronal preparations were used. (E) Representative images of dendrites immunostained for gephyrin after a 2-hour incubation with SSC, glutamate, or the indicated inhibitors. Scale bar: 5 μm (F) Gephyrin cluster density, (G) total fluorescence intensity of clusters, and (H) cumulative distribution of gephyrin cluster size in dendrites after treatment of neurons as in E (number of dendritic segments analyzed: control = 59; SSC = 67; glutamate = 71; SSC plus calpain inhibitor = 39; SSC plus MK801 = 54, from 2 independent cultures). (I and J) Time-dependent toxicity studies were conducted in cortical neurons for SSC (I) and glutamate (J) (each 200 μM) in the absence and presence of the NMDA-R blocker MK801 (1 μM), the calcium scavenger BAPTA-AM (10 μM), and calpain 1 inhibitor (10 μM). Data are presented as the mean ± SEM. **P < 0.01 and ***P < 0.001, by 2-way ANOVA with Dunnett’s (BD and HJ) or Tukey’s (F and G) multiple comparisons test.
Figure 5
Figure 5. Induction of MoCD in mice prompts SSC formation and neuronal cell death.
(A) Liver SO activity in mice after 4 weeks of treatment (n = 7/group). (B) Assessment of body weights (n = 32 mice/treatment group) of male and female mice. (C) SSC accumulation in urine (n = 7 control mice, n = 9 tungsten-treated mice). (D) Normalized SSC levels in extracts of brain (black circles and white squares represent 2 individual mice cohorts; n = 12 control, n = 13 SSC) and liver (n = 7 control, n = 6 SSC). (E) Calculated SSC concentration in brain extracts from D (n = 12 control, n = 13 SSC). (E and F) Immunoblots showing the expression of gephyrin and spectrin in brain and liver extracts (E) and the expression of PSD95 in brain extracts (F) from control and tungsten-treated mice (n = 4/group). (G) Nissl-stained images of brain sections from control and tungsten-treated mice, with representative sections of cortical and hippocampal regions and quantification of neuronal density and size in cortex (layers 1 and 2) and hippocampal CA1 regions (n= 32 cortex, n = 18 CA1, derived from 3 mice/group). Scale bar: 200 μm. Data are presented as the mean ± the SEM. Red lines indicate the median value. **P < 0.01 and ***P < 0.001, by 2-way ANOVA with Dunnett’s multiple comparisons test (A), 2-tailed, unpaired Student’s t test (B and C), 1-way ANOVA with Tukey’s multiple comparisons test (D), or 2-tailed, paired Student’s t test (G).
Figure 6
Figure 6. NMDA-R antagonist is beneficial for the treatment of MoCD in mice.
(A) Cell viability of cortical neurons with SSC (200 μM) was assessed with propidium iodide staining in the absence and presence of the NMDA-R blocker MK801 (1 μM) or memantine (10 μM) after a 12-hour incubation in culture medium (n = 15). (B) The toxic effect of low levels of SSC (1 and 10 μM) was assessed using propidium iodide staining in cortical neurons after a 5-day incubation in the absence and presence of MK801 (1 μM) or memantine (10 μM) (n = 15). (C) Recordings in the current-clamp mode revealed a dose-dependent effect of SSC on depolarization of the neuronal membrane potential. Graph represents the quantification of SSC-induced depolarization of the membrane potential. Numbers in parentheses represent the number of recorded neurons. (D and E) Efficacy of memantine treatment in the tungsten treatment study was evaluated by body weight (D) and motoric performance using rotarod testing (E) in the different mouse groups (n = 10 mice/group). (F) Immunoblot shows that memantine treatment decreased gephyrin degradation bands in control and tungsten-treated animals, while no degradation was observed with PSD95 (n = 6 mice/group). (G) Proposed sequence of events causing neurodegeneration in MoCD and SOD. Data are presented as the mean ± SEM. **P < 0.01 and ***P < 0.001, by 2-way ANOVA with Dunnett’s multiple comparisons test (A, B, D, and E), 1-way ANOVA with Tukey’s multiple comparisons test (C), or 2-tailed, unpaired Student’s t test (F).

References

    1. Johnson JL, Waud WR, Rajagopalan KV, Duran M, Beemer FA, Wadman SK. Inborn errors of molybdenum metabolism: combined deficiencies of sulfite oxidase and xanthine dehydrogenase in a patient lacking the molybdenum cofactor. Proc Natl Acad Sci U S A. 1980;77(6):3715–3719. doi: 10.1073/pnas.77.6.3715. - DOI - PMC - PubMed
    1. Johnson JL, Duran M. Molybdenum cofactor deficiency and isolated sulfite oxidase deficiency. In: Scriver C, Beaudet A, Sly W, Valle D, eds. The metabolic and molecular bases of inherited disease. New York, NY: McGraw-Hill; 2001:3163–3177.
    1. Duran M, et al. Combined deficiency of xanthine oxidase and sulphite oxidase: a defect of molybdenum metabolism or transport? J Inherit Metab Dis. 1978;1(4):175–178. doi: 10.1007/BF01805591. - DOI - PubMed
    1. Reiss J, Hahnewald R. Molybdenum cofactor deficiency: Mutations in GPHN, MOCS1, and MOCS2. Human mutation. 2011;32(1):10–18. doi: 10.1002/humu.21390. - DOI - PubMed
    1. Bayram E, et al. Molybdenum cofactor deficiency: Review of 12 cases (MoCD and review) European journal of paediatric neurology: EJPN: official journal of the European Paediatric Neurology Society. 2013;17(1):1–6. doi: 10.1016/j.ejpn.2012.10.003. - DOI - PubMed

Publication types

MeSH terms

Supplementary concepts