. 2017 Dec;23(12):1444-1453.
doi: 10.1038/nm.4432. Epub 2017 Nov 6.

Asprosin is a centrally acting orexigenic hormone

Affiliations

Asprosin is a centrally acting orexigenic hormone

Clemens Duerrschmid et al. Nat Med. 2017 Dec.

Abstract

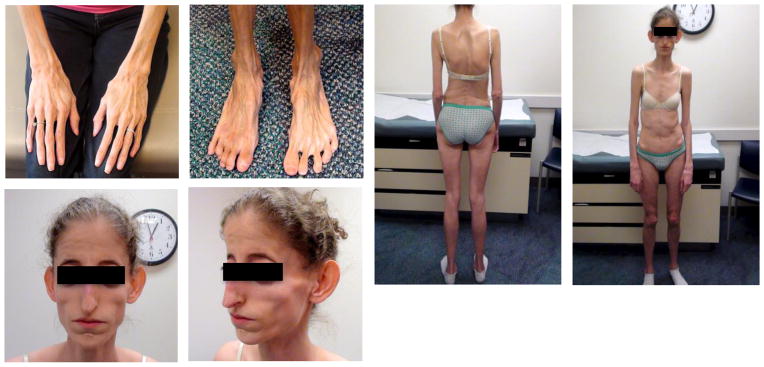
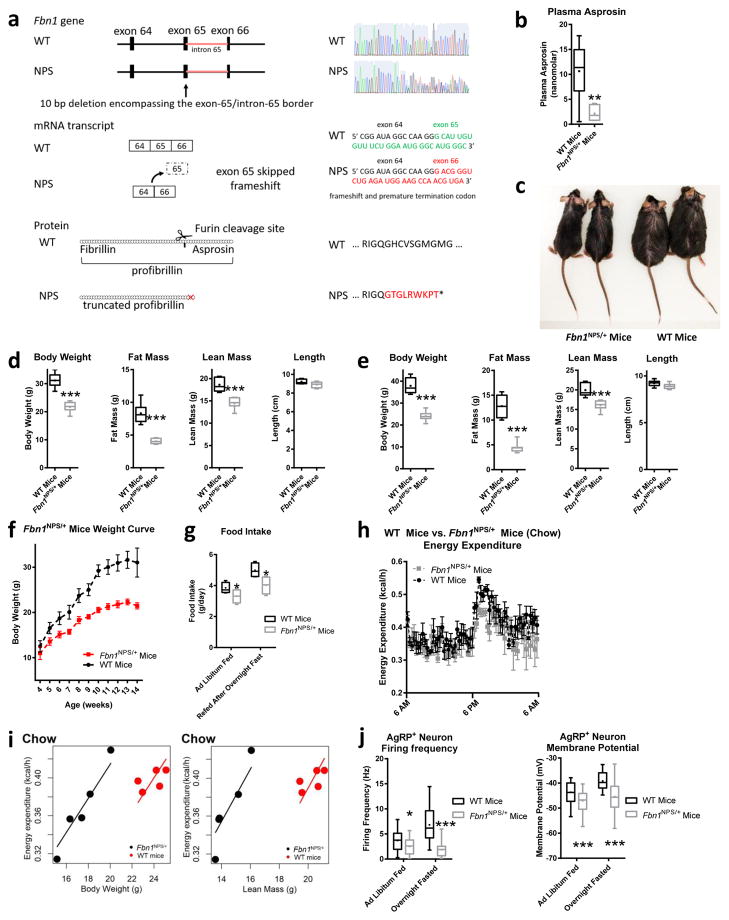
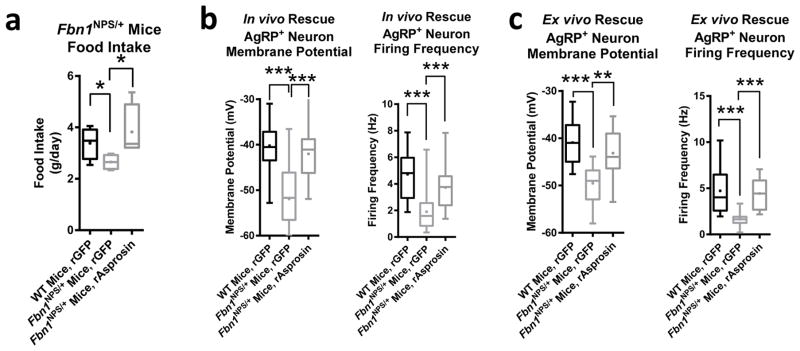
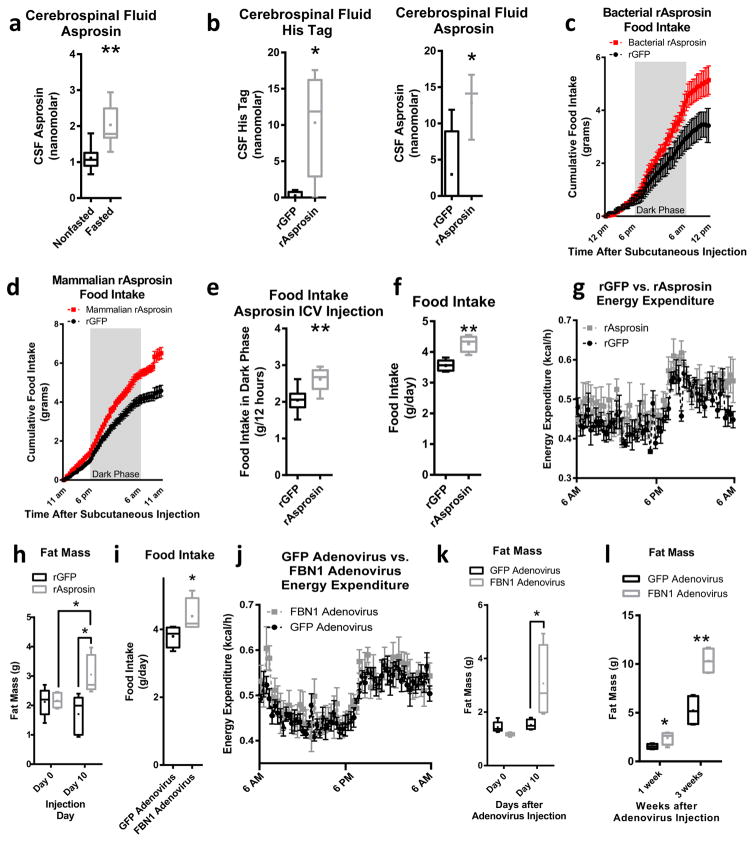
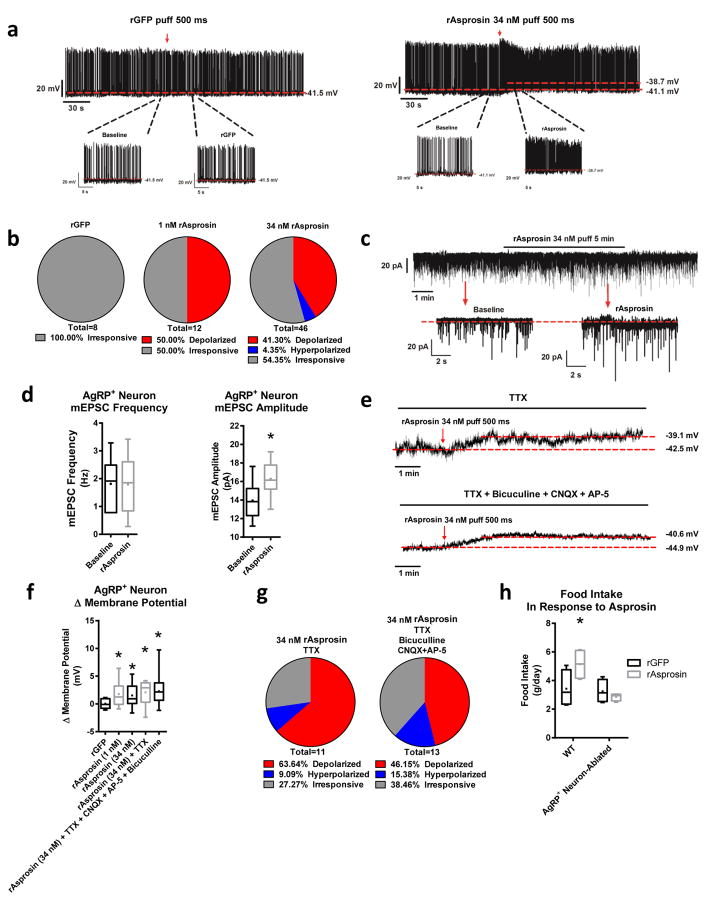
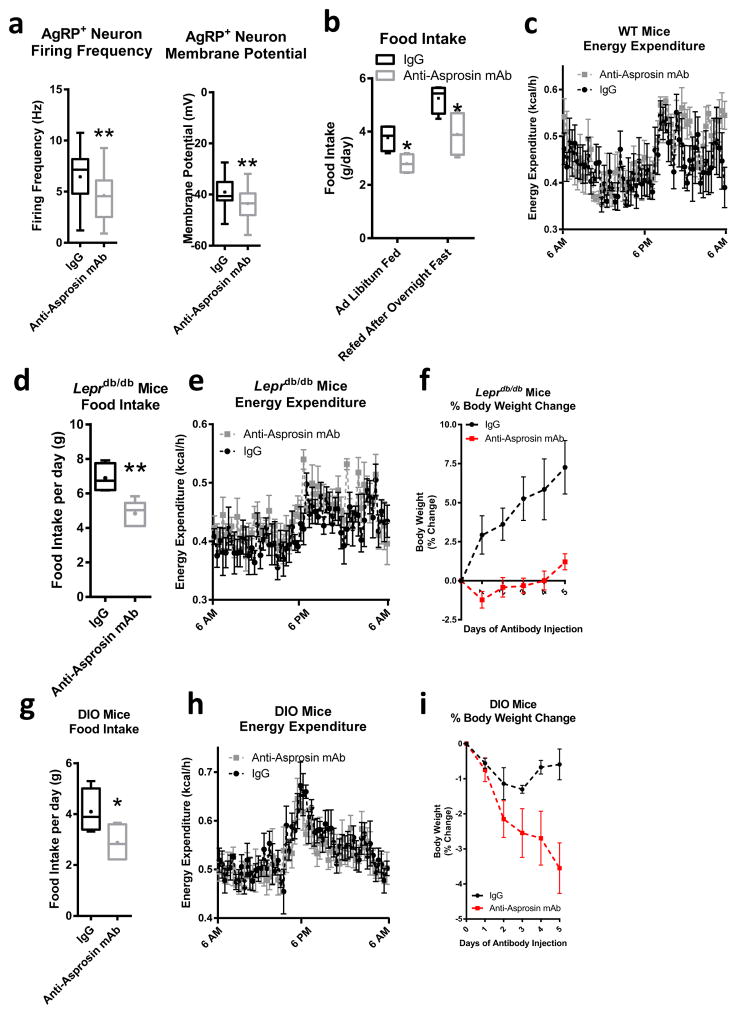
Asprosin is a recently discovered fasting-induced hormone that promotes hepatic glucose production. Here we demonstrate that asprosin in the circulation crosses the blood-brain barrier and directly activates orexigenic AgRP+ neurons via a cAMP-dependent pathway. This signaling results in inhibition of downstream anorexigenic proopiomelanocortin (POMC)-positive neurons in a GABA-dependent manner, which then leads to appetite stimulation and a drive to accumulate adiposity and body weight. In humans, a genetic deficiency in asprosin causes a syndrome characterized by low appetite and extreme leanness; this is phenocopied by mice carrying similar mutations and can be fully rescued by asprosin. Furthermore, we found that obese humans and mice had pathologically elevated concentrations of circulating asprosin, and neutralization of asprosin in the blood with a monoclonal antibody reduced appetite and body weight in obese mice, in addition to improving their glycemic profile. Thus, in addition to performing a glucogenic function, asprosin is a centrally acting orexigenic hormone that is a potential therapeutic target in the treatment of both obesity and diabetes.


Conflict of interest statement

Disclosures

No competing financial interests exist for any of the authors.

Figures

Fig. 1
Fig. 1
Neonatal Progeroid syndrome (NPS) is associated with hypophagia. Representative pictures of two individuals with NPS.
Fig. 2
Fig. 2
Introducing the NPS mutation in mice results in hypophagia, reduced adiposity and protection from diet-induced obesity. (a) Schematic depiction of the CRISPR/Cas9 strategy employed to generate Fbn1NPS/+ mice. A small (10 bp) deletion was introduced at the junction of exon 65 and intron 65 (top left), resulting in loss of a splice site, leading to skipping of exon 65 (middle left) and truncation of profibrillin (bottom left), identical to the molecular events in an individual with NPS (WT and heterozygous mutant sequence trace, WT and mutant mRNA sequence at the deletion site, and resulting WT and mutant protein sequence – top, middle, and bottom right, respectively). (b) Sandwich Elisa for endogenous asprosin in plasma of WT and Fbn1NPS/+ mice (WT n = 6, NPS n = 7). (c) Photograph of a representative set (n = 12 for each group) of 5-month-old male WT mice and Fbn1NPS/+ littermates on a high-fat diet for 3 months. (d,e) Body composition data using DEXA scans for d WT and Fbn1NPS/+ mice on normal chow (WT n = 8, NPS n = 7) and e for WT and Fbn1NPS/+ mice on a high-fat diet for 3 months (n = 8 per group). (f) Weight curves of WT and Fbn1NPS/+ mice 4 to 14 weeks old (n = 6 per group, P = 0.008). (g) Cumulative food intake over 24 hr in mice from d in the ad libitum fed and overnight fasted state using the CLAMs system. (h) Energy expenditure was measured over 24 hr mice from d using the CLAMs system (P = 0.16). (i) Analysis of energy expenditure of Fbn1NPS/+ mice and WT littermates from d on normal chow by ANCOVA (n = 5 per group, body weight P = 0.009, lean mass P = 0.016). (j) Firing frequency and membrane potential of AgRP+ neurons from ad libitum fed and over-night fasted WT and Fbn1NPS/+ mice (Firing frequency: fed, WT n = 24; fed, NPS n = 23; fasted, WT n = 25; fasted, NPS n = 20. Membrane potential: fed, WT n = 24; fed, NPS n = 23; fasted, WT n = 25; fasted, NPS n = 28). *P < 0.05, **P < 0.01, and ***P < 0.001. Statistical tests used: two-tailed t-test (b,d,e) or two-way ANOVA (f,g,h,j).
Fig. 3
Fig. 3
Correcting the asprosin deficiency completely rescues hypophagia and depressed AgRP+ neuron activity in Fbn1NPS/+ mice. (a) Cumulative food intake over 24 hr in WT and Fbn1NPS/+ mice after subcutaneous injection of recombinant GFP or mammalian-expressed recombinant asprosin using the CLAMs system (30 μg/mouse, n = 5 per group). (b) Membrane potential and firing frequency of AgRP+ neurons from overnight fasted WT and Fbn1NPS/+ mice 3 hr after ICV injection of recombinant GFP or mammalian-expressed recombinant asprosin as indicated (rAsprosin: 0.5 μg; rGFP: 0.5 μg; membrane potential WT + rGFP: n = 35, NPS + rGFP: n = 31, NPS + rAsprosin: n = 20; firing frequency: WT + rGFP: n = 25, NPS + rGFP: n = 28, NPS + rAsprosin: n = 18). (c) Membrane potential and firing frequency of AgRP+ neurons from overnight fasted WT and Fbn1NPS/+ mice after 2 hr of incubation of intact hypothalamic slices with recombinant GFP or bacterially expressed recombinant asprosin as indicated (rAsprosin: 34 nM; rGFP: 0.5 μg/μL; membrane potential: WT + rGFP: n = 12, NPS + rGFP: n = 14, NPS + rAsprosin: n = 14; firing frequency: WT + rGFP: n = 12, NPS + rGFP: n = 11, NPS + rAsprosin: n = 13). *P < 0.05, and ***P < 0.001. Statistical tests used: one-way ANOVA (a–c).
Fig. 4
Fig. 4
Asprosin crosses the blood-brain-barrier and stimulates appetite (a) Endogenous asprosin in cerebrospinal fluid of ad libitum fed and over-night fasted rats using a sandwich Elisa (n = 7 per group). (b) N-terminal His-tag (on bacterially expressed asprosin) and total asprosin (recombinant + endogenous) in cerebrospinal fluid of fasted rats after intravenous injection of bacterially expressed, His-tagged asprosin using a sandwich Elisa (30 μg/mouse, n = 4 per group). (c) Food intake during 24 hr after a single subcutaneous injection of recombinant GFP or bacterially expressed asprosin in mice using the CLAMs system (30 μg/mouse, n = 5 per group, P = 0.06). (d) Food intake during 24 hr after a single subcutaneous injection of recombinant GFP or mammalian-expressed recombinant asprosin in mice using the CLAMs system (60 μg/mouse, n = 6 per group, P = 0.0003). (e) Cumulative food intake during the dark phase (12 hr) of circadian entrained mice after intracerebroventricular (ICV) injection of recombinant GFP or bacterially expressed recombinant asprosin (rAsprosin: 10 ng; rGFP: 10 ng, n = 8 per group). (f) Cumulative food intake over 24 hr in mice exposed to 10 days of a single daily injection of recombinant GFP or bacterially expressed asprosin using the CLAMs system (30 μg/mouse/day, n = 5 per group). (g) Energy expenditure over 24 hr in mice from f using the CLAMs system (P = 0.15). (h) Fat mass from magnetic resonance imaging (MRI) in mice before and after 10 days of a single daily injection of recombinant GFP or bacterially expressed recombinant asprosin in mice from f. (i) Cumulative food intake over 24 hr in mice 10 days after adenoviral overexpression of GFP or FBN1 using the CLAMs system (n = 5 per group). (j) Energy expenditure over 24 hr in mice from (i) using the CLAMs system (P = 0.46). (k) Fat mass from MRI in mice from i before and 10 days after injection with the GFP or FBN1 adenovirus (n = 5 per group, P = 0.06 between FBN1 group 0 and 10 days). (l) Fat mass from MRI in mice 1 week and 3 weeks after injection with the GFP or FBN1 adenovirus (n = 5 per group). *P < 0.05, and **P < 0.01. Statistical tests used: two-tailed t-test (a,b,e,f,i) or two-way ANOVA (c,d,g,h,j,k,l).
Fig. 5
Fig. 5
AgRP+ neurons are essential for Asprosin-mediated appetite stimulation (a) Representative action potential (AP) firing traces of AgRP+ neurons after GFP and bacterially expressed recombinant asprosin treatment. (b) Response ratio of AgRP+ neurons after GFP, and 1 nM and 34 nM bacterially expressed asprosin treatment (rGFP n = 8, 1 nM rAsprosin n = 12, 34 nM rAsprosin n = 46). (c) Representative traces of miniature excitatory postsynaptic current (mEPSC) in AgRP+ neurons before and after bacterially expressed asprosin treatment. (d) mEPSC frequency and amplitude in AgRP+ neurons before and after bacterially expressed asprosin treatment (n = 6 per group). (e) Representative traces of AgRP+ neuron resting membrane potential in the presence of TTX (1 μM; top), and inhibitor cocktail (AP-5: 30 μM, CNQX:30 μM, bicuculline: 50 μM and TTX 1 μM; bottom). (f) Amplitude changes of resting membrane potential in AgRP+ neurons after treatment with GFP, 1 nM and 34 nM bacterially expressed asprosin, or 34 nM bacterially expressed asprosin in the presence of TTX and inhibitor cocktail (AP-5: 30 μM, CNQX: 30 μM, bicuculline: 50 μM, and TTX 1 μM; rGFP n = 8, rAsprosin 1 nM n = 12, 34 nM n = 44, 34 nM + TTX n = 11, 34 nM + TTX + CNQX + AP5 + bicuculline n = 13). (g) Response ratio of AgRP+ neurons after treatment with bacterially expressed asprosin in the presence of TTX or inhibitor cocktail (AP-5: 30 μM, CNQX: 30 μM, bicuculline: 50 μM, and TTX 1 μM; rAsprosin + TTX n = 11, rAsprosin + inhibitors n = 13). (h) Cumulative food intake on normal-chow in WT and AgRP+ neuron-ablated mice in response to a single dose of GFP or bacterially expressed asprosin (30 μg/mouse, n = 4 per group). *P < 0.05. Statistical tests used: two-tailed t-test (e), one-way ANOVA (f), or two-way ANOVA (h).
Fig. 6
Fig. 6
Immunologic neutralization of asprosin is protective against obesity (a) Firing frequency and membrane potential in AgRP+ neurons from mice 12 hr after IgG control or anti-asprosin monoclonal antibody injection (250 μg/mouse, firing frequency: IgG n = 27, anti-asprosin mAb n = 26; membrane potential: IgG n = 33, anti-asprosin mAb n = 34). (b) Cumulative food intake over 24 hr in 8-week-old WT mice with one daily injection of IgG control or anti-asprosin mAb in the ad libitum fed and overnight fasted state using the CLAMs system (250 μg/mouse, n = 5 per group). (c) Energy expenditure over 24 hr in ad libitum fed mice from b using the CLAMs system (P = 0.4). (d) Cumulative food intake over 24 hr in 8-week-old male Leprdb/db mice with one daily injection IgG control or anti-asprosin mAb using the CLAMs system (250 μg/mouse, n = 5 per group). (e) Energy expenditure over 24 hr in mice from (d) using the CLAMs system (P = 0.22). (f) Weight change over time in mice from d and littermates (n = 6 per group, P = 0.007). Original weights: 43.8 g for IgG group and 46.9 g for anti-asprosin mAb group. (g) Cumulative food intake during 24 hr in 20-week-old male WT mice fed a high-fat diet for 3 months with daily dosing for 5 days of IgG control or anti-asprosin mAb using the CLAMS system (250 μg/mouse, n = 5 per group). (h) Energy expenditure over 24 hr in mice from g using the CLAMs system (P = 0.67). (i) Weight change over time in mice from g and littermates with daily dosing for 5 days with IgG control or anti-asprosin mAb (250 μg/mouse, n = 6 per group, P = 0.05). Original weights: 50.1 g for IgG group and 50.3 g for anti-asprosin mAb group. *P < 0.05, and **P < 0.01. Statistical tests used: two-tailed t-test (a,d,g) or two-way ANOVA (b,c,e,f,h,i).

References

    1. Romere C, et al. Asprosin, a Fasting-Induced Glucogenic Protein Hormone. Cell. 2016;165:566–579. - PMC - PubMed
    1. O’Neill B, Simha V, Kotha V, Garg A. Body fat distribution and metabolic variables in patients with neonatal progeroid syndrome. Am J Med GenetA. 2007;143A:1421–1430. - PubMed
    1. Jacquinet A, et al. Neonatal progeroid variant of Marfan syndrome with congenital lipodystrophy results from mutations at the 3′ end of FBN1 gene. Eur J Med Genet. 2014;57:230–234. - PubMed
    1. Judge DP, Dietz HC. Marfan’s syndrome. The Lancet. 2005;366:1965–1976. - PMC - PubMed
    1. Even PC, Nadkarni NA. Indirect calorimetry in laboratory mice and rats: principles, practical considerations, interpretation and perspectives. Am J Physiol Regul Integr Comp Physiol. 2012;303:R459–76. - PubMed

MeSH terms