. 2017 Dec;23(12):1474-1480.
doi: 10.1038/nm.4433. Epub 2017 Nov 6.

Selective neuronal lapses precede human cognitive lapses following sleep deprivation

Affiliations

Selective neuronal lapses precede human cognitive lapses following sleep deprivation

Yuval Nir et al. Nat Med. 2017 Dec.

Abstract

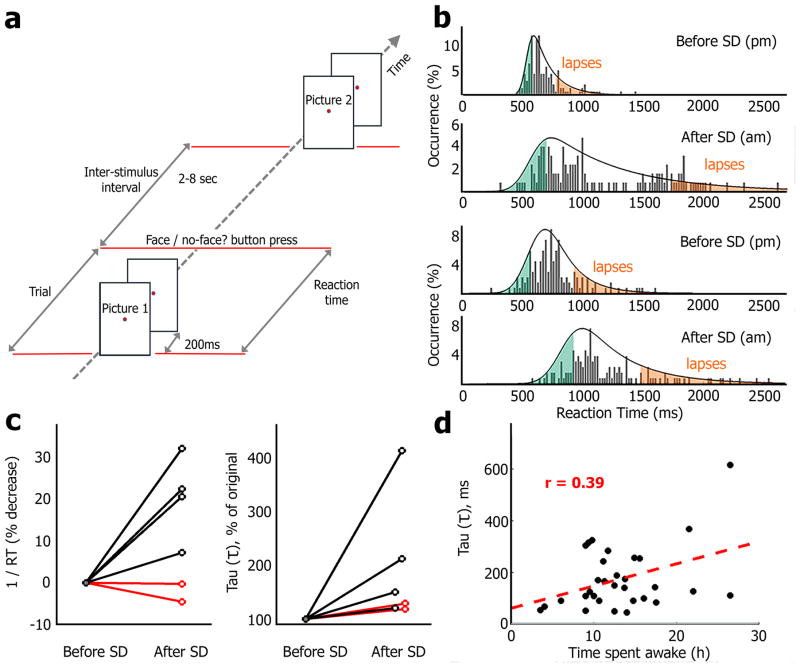
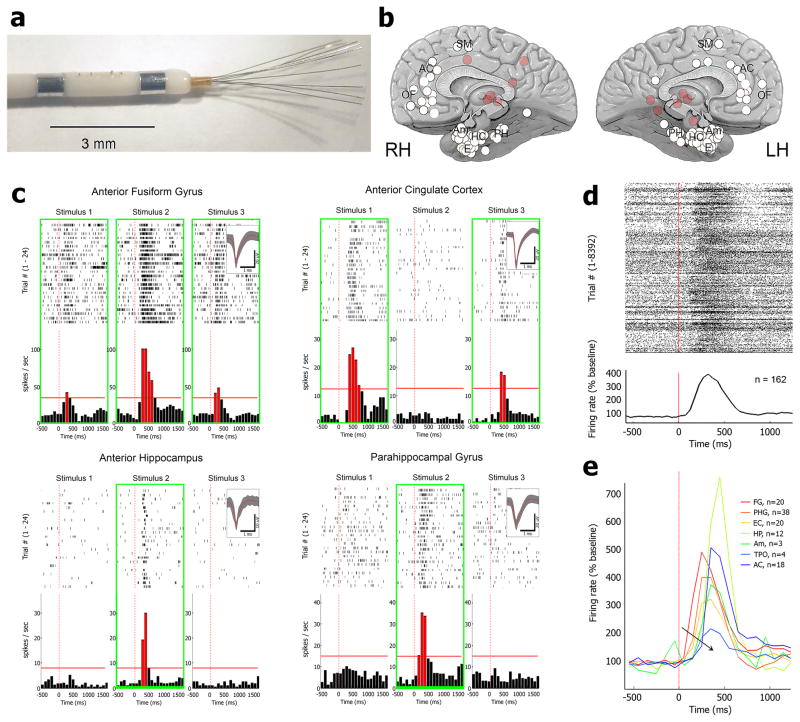
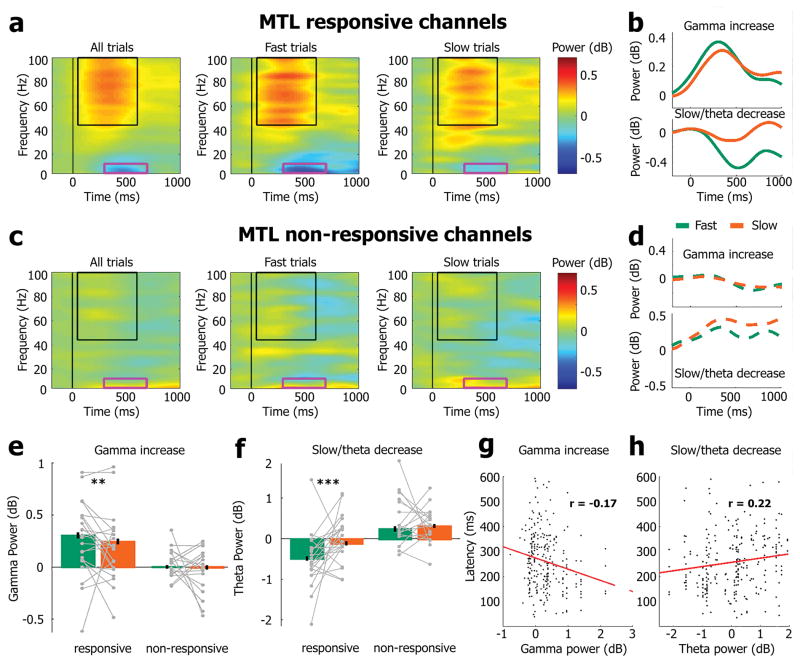
Sleep deprivation is a major source of morbidity with widespread health effects, including increased risk of hypertension, diabetes, obesity, heart attack, and stroke. Moreover, sleep deprivation brings about vehicle accidents and medical errors and is therefore an urgent topic of investigation. During sleep deprivation, homeostatic and circadian processes interact to build up sleep pressure, which results in slow behavioral performance (cognitive lapses) typically attributed to attentional thalamic and frontoparietal circuits, but the underlying mechanisms remain unclear. Recently, through study of electroencephalograms (EEGs) in humans and local field potentials (LFPs) in nonhuman primates and rodents it was found that, during sleep deprivation, regional 'sleep-like' slow and theta (slow/theta) waves co-occur with impaired behavioral performance during wakefulness. Here we used intracranial electrodes to record single-neuron activities and LFPs in human neurosurgical patients performing a face/nonface categorization psychomotor vigilance task (PVT) over multiple experimental sessions, including a session after full-night sleep deprivation. We find that, just before cognitive lapses, the selective spiking responses of individual neurons in the medial temporal lobe (MTL) are attenuated, delayed, and lengthened. These 'neuronal lapses' are evident on a trial-by-trial basis when comparing the slowest behavioral PVT reaction times to the fastest. Furthermore, during cognitive lapses, LFPs exhibit a relative local increase in slow/theta activity that is correlated with degraded single-neuron responses and with baseline theta activity. Our results show that cognitive lapses involve local state-dependent changes in neuronal activity already present in the MTL.


Conflict of interest statement

Competing Financial Interests Statement. None to declare.

Figures

Figure 1
Figure 1. Sleep deprivation (SD) leads to cognitive lapses in a face/non-face categorization Psychomotor Vigilance Task (PVT)
(a) Schematic illustration of the modified PVT where images of people, landmarks, and animals were presented infrequently as participants performed a face/non-face categorization task. (b) Distribution of reaction times (RTs) before and after full-night sleep deprivation (SD) in two representative individuals. For each session, an Ex-Gaussian fit (Methods) defines right exponential tail of cognitive lapses (orange, highest RTs) and an equal number of trials with fastest RTs (green) are used for subsequent comparison of neuronal data. (c) Left, mean 1/RT (% decrease) in 4 session pairs conducted before/after full-night SD (black) and two sessions conducted before/after normal sleep (red). Note that SD was associated with an increase in mean RT, while normal sleep improved behavioral performance. Right, the tau (τ) parameter (exponential tail in ExGaussian defining cognitive lapses) before/after SD (black, n=4 pairs) and before/after normal sleep (red, n=2 pairs). (d) Scatter plot showing significant correlation (Pearson’s r=0.39, p<0.03) between tau (τ, ordinate) and time spent awake (abscissa) across all sessions (n=31, not only those conducted before/after SD).
Figure 2
Figure 2. Human single-neuron responses during the face/non-face categorization PVT experiment
(a) Macro-micro depth electrodes with eight 40-μm platinum-iridium microwires protruding 4–5mm from the most distal macro-electrode contact. 6–12 such electrodes were implanted in each patient to simultaneously monitor activity in multiple brain regions (b) Overview of 104 depth electrode locations in 12 individuals as seen from medial view. Abbreviations: OF, orbitofrontal cortex; AC, anterior cingulate; SM, supplementary motor; PH, parahippocampal gyrus; HC, hippocampus; E, entorhinal cortex; Am, amygdala; LH, left hemisphere; RH, right hemisphere. Opaque red circles mark more lateral regions such as superior temporal gyrus. (c) Four representative examples (raster plots and peri-stimulus-time histograms, PSTH) of single-unit spiking responses to pictures recorded from the Anterior Fusiform Gyrus (top left), Anterior Hippocampus (bottom left), Anterior Cingulate Cortex (top right), and Parahippocampal Gyrus (bottom right). Green boxes mark stimuli eliciting significant responses (red bars) above baseline firing (horizontal red lines) while insets show action potential waveforms. (d) Average response (raster plot and PSTH) across all neurons (n=162) tagged as ‘responsive’, for pictures that were effective in driving a response, reveals a robust increase in spike discharges around 200–500ms after stimulus onset. (e) Average response, shown separately for each brain region monitored, reveals an orderly progression of temporal latencies (black arrow, hot-to-cold colors) from high-order visual cortex to hippocampus and frontal lobe (FG, anterior Fusiform Gyrus; PHG, Parahippocampal Gyrus; EC, entorhinal cortex; HP, hippocampus; Am, amygdala; TPO, temporal-parietal-occipital junction; AC, anterior cingulate cortex).
Figure 3
Figure 3. Reduced, delayed, and lengthened single-unit responses during cognitive lapses
(a) Spiking responses (raster and PSTH) in fast trials (lowest RTs, green) vs. slow trials (highest RTs, orange) of two representative neurons in the anterior hippocampus and the parahippocampal gyrus (same neurons as bottom rows in Figure 2C). Trials in raster plot are sorted based on RTs in each trial (slowest on top). Black ticks, action potentials; Open red circles, response latency detected automatically; Green/gray/orange circles, behavioral response in fast/other/slow trials, respectively. Orange rectangle shading, slow trials; Green rectangle shading, fast trials. (b) Normalized PSTH of all responses (each row represents a response to one of 469 stimuli; 162 responsive neurons) during fast trials (left) and slow trials (right). Responses are aligned to each neuron’s response onset across all trials (x-axis), and amplitude (color scale) is normalized to each neuron’s peak response to go beyond variability across neurons in response timing and amplitude. Vertical and diagonal blue lines mark average time of response onset, and response termination, respectively, for each neuron (sorted by response duration). Green and orange vertical lines mark mean behavioral RT in fast and slow trials, respectively. (c) Color superposition of PSTH responses (each row represents a response to one of 469 stimuli; 162 responsive neurons) in fast and slow trials. Responses are aligned (x-axis) and normalized (y-axis) as in (b). Color brightness (inset legend) represents firing rate magnitude, while hue (green vs. orange) represents stronger responses during fast vs. slow trials at that time (Methods). Vertical and diagonal white lines mark average time of response onset and response termination, respectively, for each neuron (sorted by response duration). Note stronger earlier response in fast trials (green dominance around onset) vs. delayed and lengthened response in slow trials (orange dominating later). (d) Grand-mean PSTH of all responses (n=469 responses in 162 neurons) in fast trials (green) and slow trials (orange). Responses are aligned (x-axis) and normalized (y-axis) as in (b). Green and orange arrows mark mean behavioral RT in fast and slow trials, respectively. (e) Quantification of response magnitude (left), response latency (middle), and response duration (right) in individual responsive neurons during fast trials vs. slow trials (N=376 pictures in 142 units). Different N values with respect to previous panels stem from single-trial analysis (Methods). Slow trials are associated with statistically significant firing rate reduction (**, p<0.005, Wilcoxon signed-rank test), increased temporal latency (***, p<0.0005, Wilcoxon signed-rank test), and longer response duration (**, p<0.005, Wilcoxon signed-rank test). Gray dots/lines depict 16 individual sessions with at least 5 unit responses.
Figure 4
Figure 4. Cognitive lapses are associated with weaker gamma power increase and weaker slow/theta power decrease in MTL LFPs
(a) Time-frequency decomposition of induced power changes in local field potentials (LFPs) of MTL responsive channels (n=270 channels in 31 sessions). Columns denote the average power changes for all trials (left), fast trials (lowest RTs, middle), and slow trials (highest RTs, right). In each subpanel, hot and cold colors mark increases and decreases in power, respectively. Black rectangles mark stimulus-induced increase in gamma frequency (>45Hz) power around 50–600ms after stimulus onset. Pink rectangles mark stimulus-induced decreased power in the slow/theta frequency range (2–10Hz) around 300–700ms after stimulus onset. Slow trials are associated with weaker gamma power increase and weaker slow/theta power decrease. (b) Time course of gamma power increase (top) and slow/theta power decrease (bottom) for fast trials (green) vs. slow trials (orange). (c) Same as (a) for neighboring MTL non-responsive channels (n=198 channels in 31 sessions). Note the absence of significant power modulations during the same slow trials in neighboring channels. (d) Same as (b) for neighboring MTL non-responsive channels. (e) Quantification (median) of gamma power increases (45–100Hz; 50–600ms) for responsive (left) and non-responsive MTL channels (right). Asterisks show significant differences (Wilcoxon signed-rank tests comparing fast trials with slow trials; **, p<0.007). (f) Quantification (median) of slow/theta power decrease (2–10Hz; 300–700ms) for responsive (left) and non-responsive MTL channels (right). In panels (e) and (f), error bars denote SEM computed across LFP channels (n=270 and 198 for responsive and non-responsive channels, respectively), and gray dots/lines mark 22 individual sessions (responsive channels) and 17 individual sessions (unresponsive channels) that had at least 5 LFP channels. Asterisks show significant differences (Wilcoxon signed-rank tests comparing fast trials with slow trials; ***, p<10−7). (g) Scatter plot of single-neuron response latency (y-axis) vs. strength of gamma power increase (x-axis) reveals that during slow trials, increased latency in spiking responses is significantly correlated with weaker increase in LFP gamma (Spearman coefficient r=−0.17, p=0.007, n=255 pictures that elicited significant responses across 87 units and 21 sessions, see Methods). (h) Scatter plot of single-neuron response latency (y-axis) vs. strength of slow/theta power decrease (x- axis) reveals that during slow trials, increased latency in spiking responses is significantly correlated with increased slow/theta LFP power (Spearman coefficient: r=0.22, p=4.5*10−4 in n=255 pictures that elicited significant responses across 87 units and 21 sessions).

References

    1. Colten HR, Altevogt BM, editors. Sleep Disorders and Sleep Deprivation: An Unmet Public Health Problem. Washington (DC): 2006. - PubMed
    1. Duffy JF, Zitting KM, Czeisler CA. The Case for Addressing Operator Fatigue. Review of human factors and ergonomics. 2015;10:29–78. - PMC - PubMed
    1. Goel N, Rao H, Durmer JS, Dinges DF. Neurocognitive consequences of sleep deprivation. Seminars in neurology. 2009;29:320–339. - PMC - PubMed
    1. Lyznicki JM, Doege TC, Davis RM, Williams MA. Sleepiness, driving, and motor vehicle crashes. Council on Scientific Affairs, American Medical Association. Jama. 1998;279:1908–1913. - PubMed
    1. Borbely AA. A two process model of sleep regulation. Hum Neurobiol. 1982;1:195–204. - PubMed