. 2017 Dec;24(12):1139-1145.
doi: 10.1038/nsmb.3500. Epub 2017 Nov 6.

TFIIH generates a six-base-pair open complex during RNAP II transcription initiation and start-site scanning

Affiliations

TFIIH generates a six-base-pair open complex during RNAP II transcription initiation and start-site scanning

Eric J Tomko et al. Nat Struct Mol Biol. 2017 Dec.

Abstract

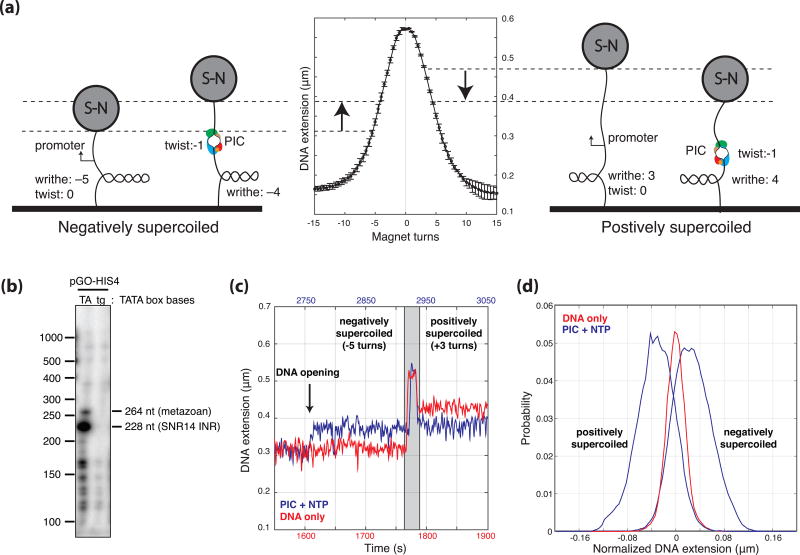
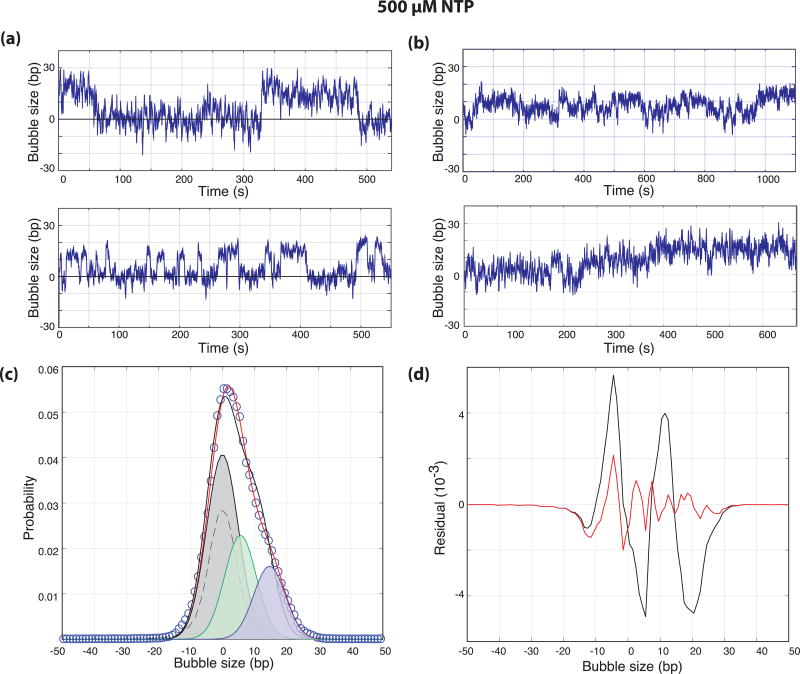
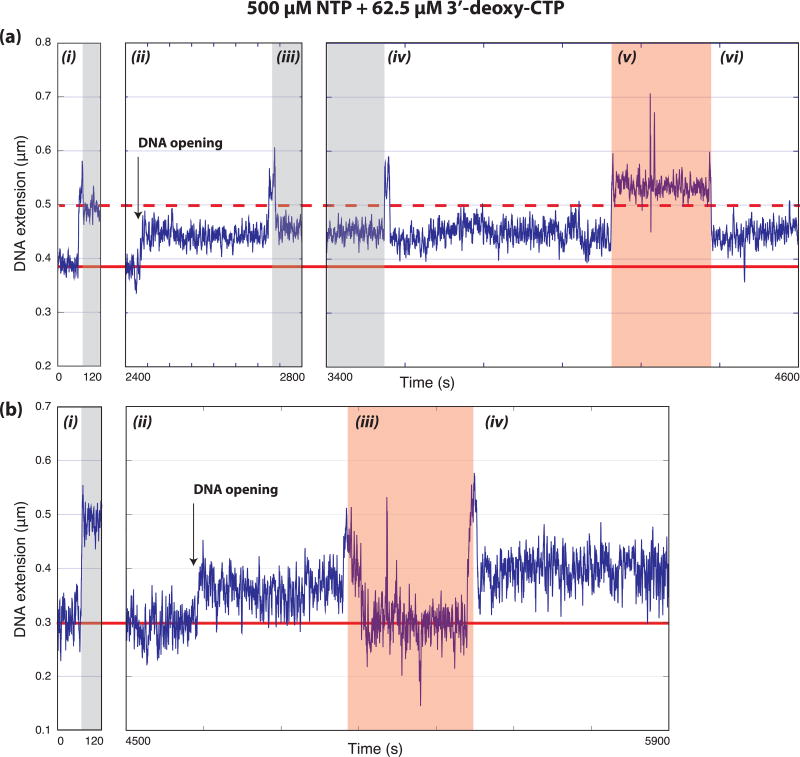
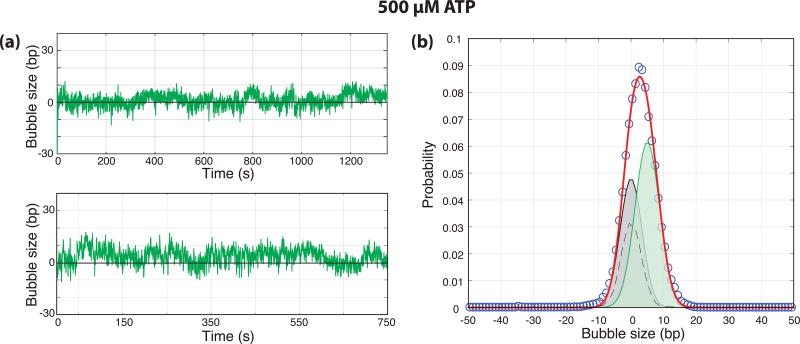
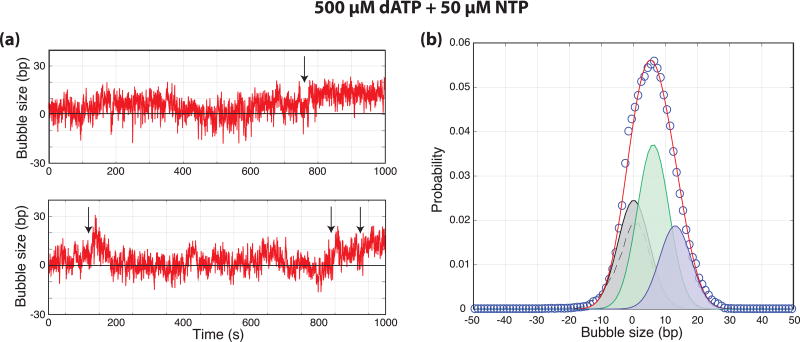
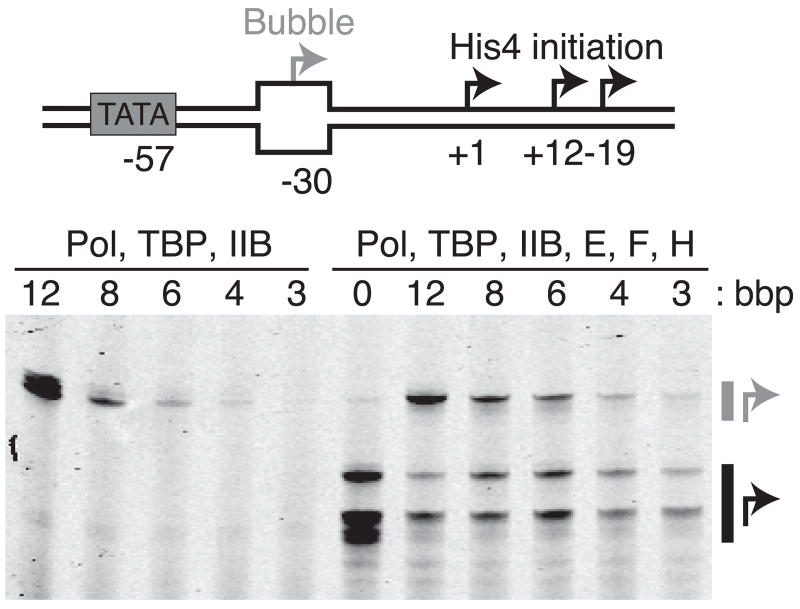
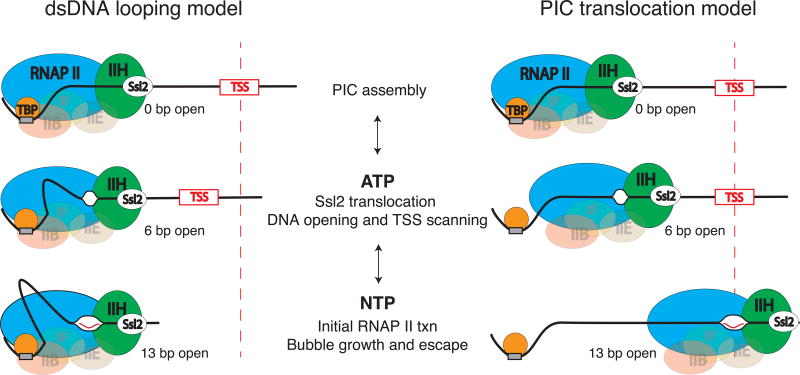
Eukaryotic mRNA transcription initiation is directed by the formation of the megadalton-sized preinitiation complex (PIC). After PIC formation, double-stranded DNA (dsDNA) is unwound to form a single-stranded DNA bubble, and the template strand is loaded into the polymerase active site. DNA opening is catalyzed by Ssl2 (XPB), the dsDNA translocase subunit of the basal transcription factor TFIIH. In yeast, transcription initiation proceeds through a scanning phase during which downstream DNA is searched for optimal start sites. Here, to test models for initial DNA opening and start-site scanning, we measure the DNA-bubble sizes generated by Saccharomyces cerevisiae PICs in real time using single-molecule magnetic tweezers. We show that ATP hydrolysis by Ssl2 opens a 6-base-pair (bp) bubble that grows to 13 bp in the presence of NTPs. These observations support a two-step model wherein ATP-dependent Ssl2 translocation leads to a 6-bp open complex that RNA polymerase II expands via NTP-dependent RNA transcription.


Figures

Figure 1
Figure 1. Experimental Setup
(a) The magnetic tweezers allow for the negative or positive supercoiling of single torsionally constrained dsDNA tethers and the measurement of the end-to-end distance of the tether via the optical tracking of the height of the 1 µm magnetic beads. Due to the conservation of linking number, any DNA opening that occurs (change in twist) is accompanied by an equal and opposite change in the number of writhes. As the height of the bead is linearly proportional to the number of writhes under the conditions of the experiment (i.e. 0.3 pN and between 2–8 turns), the change in twist, and thus the number of base-pairs unwound can be calculated. (b) Primer extension products generated after transcription reactions on the template used for the magnetic tweezers experiments. The template was designed with a dominant start-site 70 bp downstream from TATA driven by the strong initiator sequence from the yeast U4 small nuclear RNA gene SNR14 (228 bp band) and a minor start at the position of the predominant TSS distance in metazoans 34 bp downstream from TATA (264 bp band). (c) DNA extension plotted as a function of time showing a DNA only control (red) and a DNA opening trace (500 µM NTP, blue) with negative (−5 turns) and positive (+3 turns) super-helicity. After DNA opening occurred, the tethers were positively supercoiled by turning the magnets (gray area) to test for stability and to measure the corresponding DNA extension change. (d) A normalized distribution of DNA extensions with positively and negatively (blue) supercoiled extensions compared to DNA alone control traces (red).
Figure 2
Figure 2. NTP catalyzed DNA opening
(a,b) Bubble size in base-pairs plotted as a function of time from the end of flow for negatively supercoiled templates in the presence of 500 µM NTP. (c) The normalized probability distribution of DNA bubble size (circles, N = 21 traces) with two-state (0.002 RMSD, black) and three-state (0.0014 RMSD, red) fits. The distribution of DNA only controls (dashed) were used to constrain the widths of the distributions during fitting and the individual distributions from the three-state fit are shown. The distributions have means of 0, 6.1, and 13.4 bp and represent 51%, 27%, and 22% of the overall probability distribution respectively. (d) Residuals from the two-state (black) and three-state (red) fits shown in (b).
Figure 3
Figure 3. Formation of stable elongation complexes
Representative data (from 14 traces collected in 7 experiments) showing long-lived DNA bubbles formed in the presence of 500 µM NTP and 62.5 µM 3’-deoxy-CTP lasting over the remainder of the trace and stable after flowing out NTPs and protein factors. Regions of negatively supercoiled DNA (not shaded), positively supercoiled DNA (shaded grey), and where NTPs are being flowed out (shaded red) are indicated. The solid and dashed horizontal red lines indicate negatively and positively supercoiled DNA extensions in the absence of factors respectively. (a) A single tether monitored over 4600 s while super-helicity and buffer conditions are modified. The sections of the trace are as follows: (i) DNA only rotation-extension curve showing negatively supercoiled DNA and positively supercoiled DNA base-lines, (ii) a DNA opening signal observed after flowing in PIC components and NTPs (consistent with the large bubble described in the text) indicated by an increase in the negatively supercoiled tether length, (iii) the bubble is stable to positive supercoils (shaded grey), (iv) a return to negatively supercoiled conditions (bubble still open), (v) changes in extension caused by flowing buffer to remove factors and NTPs, (vi) the bubble is still open suggesting the formation of the stable elongation complex. (b) A single tether monitored over 5900 s while buffer conditions are modified. The sections of the trace are as follows: (i) DNA only rotation-extension curve showing negatively supercoiled DNA and positively supercoiled DNA base-lines, (ii) a DNA opening signal observed after flowing in PIC components and NTPs (consistent with the large bubble described in the text) indicated by an increase in the negatively supercoiled tether length, (iii) changes in extension caused by flowing buffer to remove factors and NTPs, (iv) the signal for an open bubble is still present suggesting the formation of the stable elongation complex.
Figure 4
Figure 4. ATP catalyzed DNA opening
(a) Bubble size in base-pairs plotted as a function of time (s) from the end of flow for negatively supercoiled templates in the presence of 500 µM ATP. (b) Normalized probability distribution of bubble sizes (circles, N = 26 traces) along with a two-state fit (0.0012 RMSD, red). The distribution of DNA only controls (dashed) were used to constrain the widths of the distributions during fitting and the individual distributions from the fit are shown. The distributions have means of 0 and 5.0 and represent 44% and 56% of the overall probability distribution respectively.
Figure 5
Figure 5. A partially open complex is an intermediate in transcription initiation
(a) Bubble size in base-pairs plotted as a function of time (s) from the end of flow for negatively supercoiled templates in the presence of 500 µM dATP and 50 µM NTP. Arrows indicate transitions between small and large bubble states. (b) Normalized probability distribution of bubble sizes (circles, N = 23 traces) along with a three-state fit (0.001 RMSD, red). The distribution of DNA only controls (dashed) were used to constrain the widths of the distributions during fitting and the individual distributions from the fit are shown. The distributions have means of 0, 6.1, and 13.0 bp and represent 30%, 47%, and 23% of the overall probability distribution respectively.
Figure 6
Figure 6. A six base-pair bubble is sufficient to support initiation in the absence of TFIIH
The His4-bubble construct is shown schematically along with a gel separating the products derived from bubble initiated start-sites (grey arrow) and WT downstream start-sites (black arrows) for different lengths of bubble base-pairs (bbp). In the absence of TFIIE, F, and H (left), downstream start-sites are not utilized and initiation efficiency increases as the bubble size is increased through 6 bp.
Figure 7
Figure 7. Models of transcription initiation
Two alternative models are proposed that are consistent with the magnetic tweezers data. After PIC assembly, ATP-hydrolysis by Ssl2 leads to translocation of downstream DNA into the PIC. This leads to initial unwinding of 5–6 bp and powers TSS scanning. In the dsDNA looping model, the PIC remains bound to TATA and the downstream DNA is looped out between TATA and the polymerase active site. In the PIC translocation model, the polymerase along with a subset of GTFs breaks contact with TATA and translocates downstream while scanning the DNA. In both models, NTP hydrolysis by RNAP II leads to the expansion of the bubble to 13 bp and subsequent promoter escape.

References

    1. Sainsbury S, Bernecky C, Cramer P. Structural basis of transcriptioninitiation by RNA polymerase II. Nat Rev Mol Cell Biol. 2015;16:129–143. - PubMed
    1. Grünberg S, Hahn S. Structural insights into transcriptioninitiation by RNA polymerase II. Trends in Biochemical Sciences. 2013:1–9. doi: 10.1016/j.tibs.2013.09.002. - DOI - PMC - PubMed
    1. Saecker RM, Record MT, Jr, deHaseth PL. Mechanism of Bacterial Transcription Initiation: Promoter Binding, Isomerization to Initiation-Competent Open Complexes, and Initiation of RNA Synthesis. J Mol Biol. 2011:1–18. doi:10.1016 j.jmb.2011.01.018. - PMC - PubMed
    1. Qureshi SA, Bell SD, Jackson SP. Factor requirements for transcription in the Archaeon Sulfolobus shibatae. EMBO Journal. 1997;16:2927–2936. - PMC - PubMed
    1. Bell SD, Jaxel C, Nadal M, Kosa PF, Jackson SP. Temperature, template topology, and factor requirements of archaeal transcription. Proc Natl Acad Sci USA. 1998;95:15218–15222. - PMC - PubMed

MeSH terms