. 2017 Dec;49(12):1731-1740.
doi: 10.1038/ng.3988. Epub 2017 Nov 6.

High-throughput annotation of full-length long noncoding RNAs with capture long-read sequencing

Affiliations

High-throughput annotation of full-length long noncoding RNAs with capture long-read sequencing

Julien Lagarde et al. Nat Genet. 2017 Dec.

Abstract

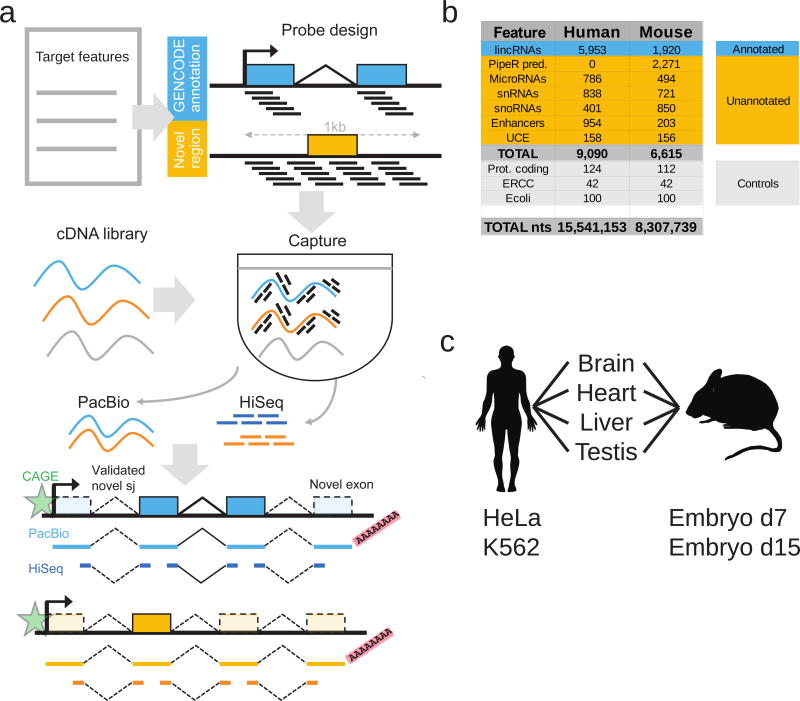
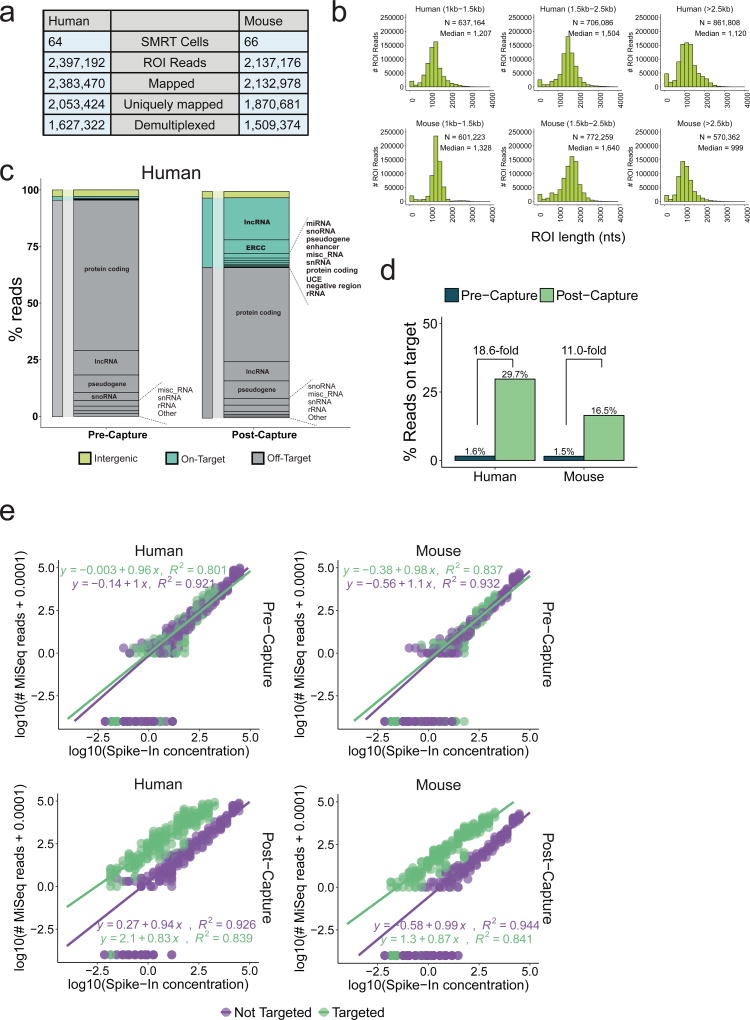
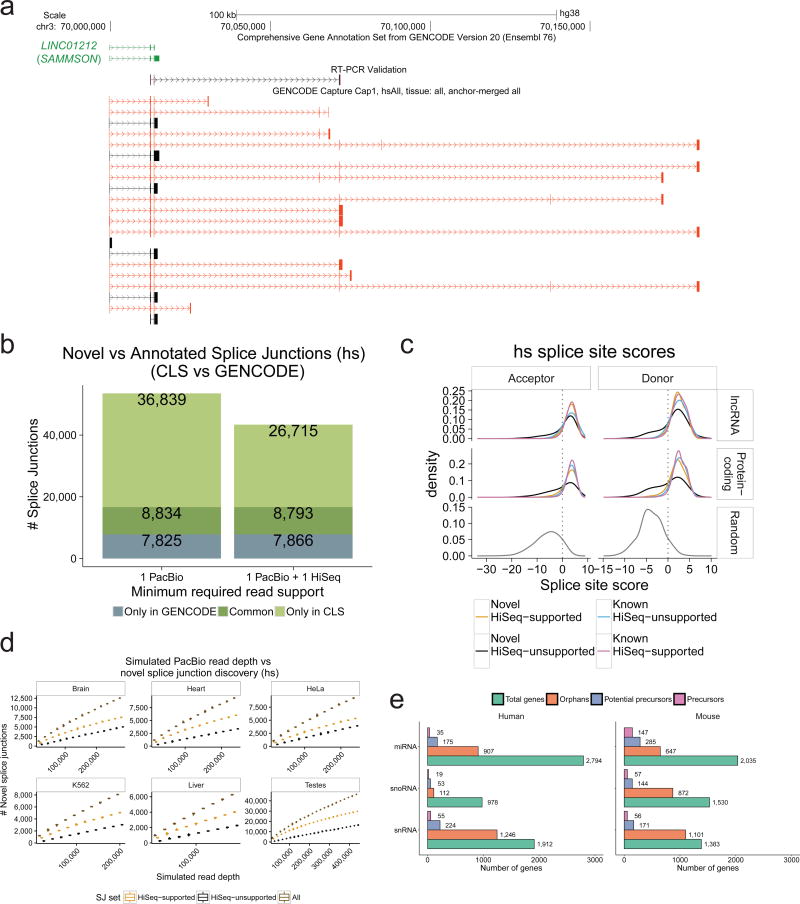
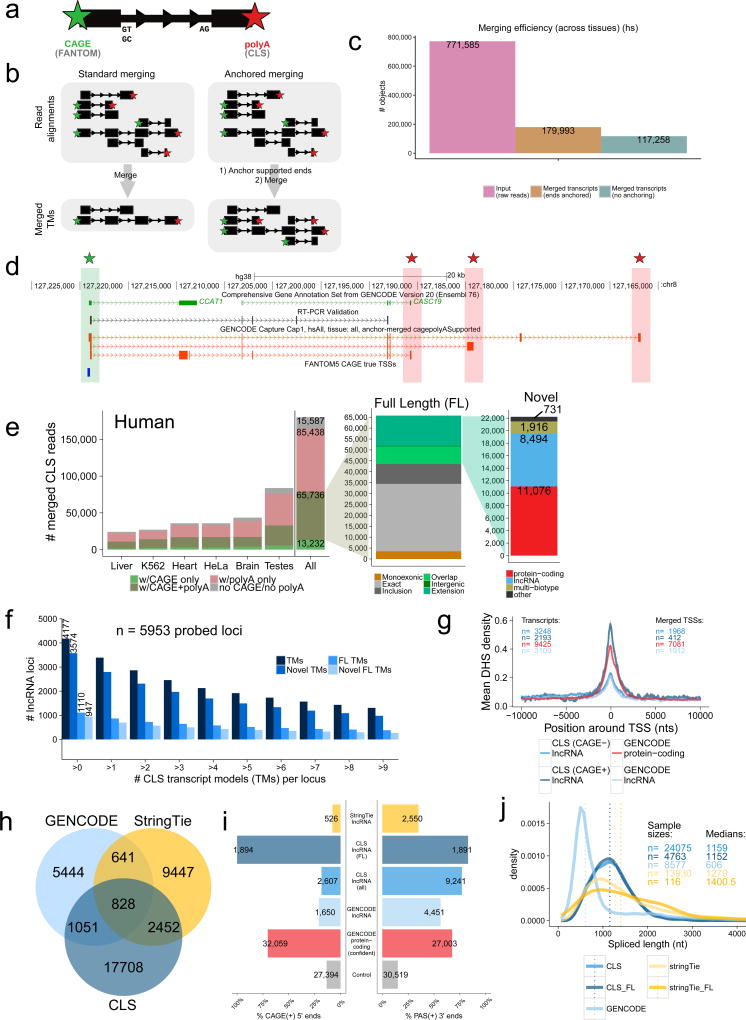
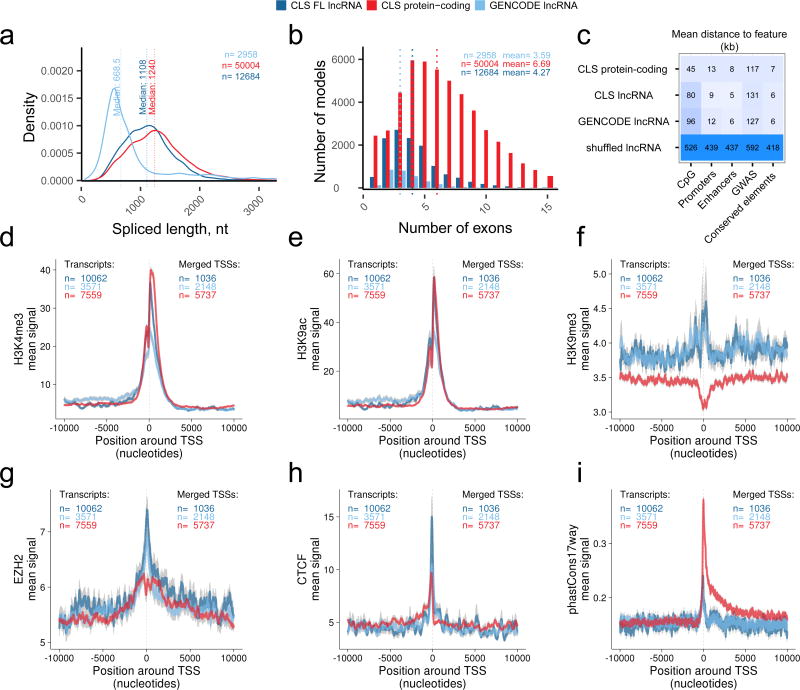
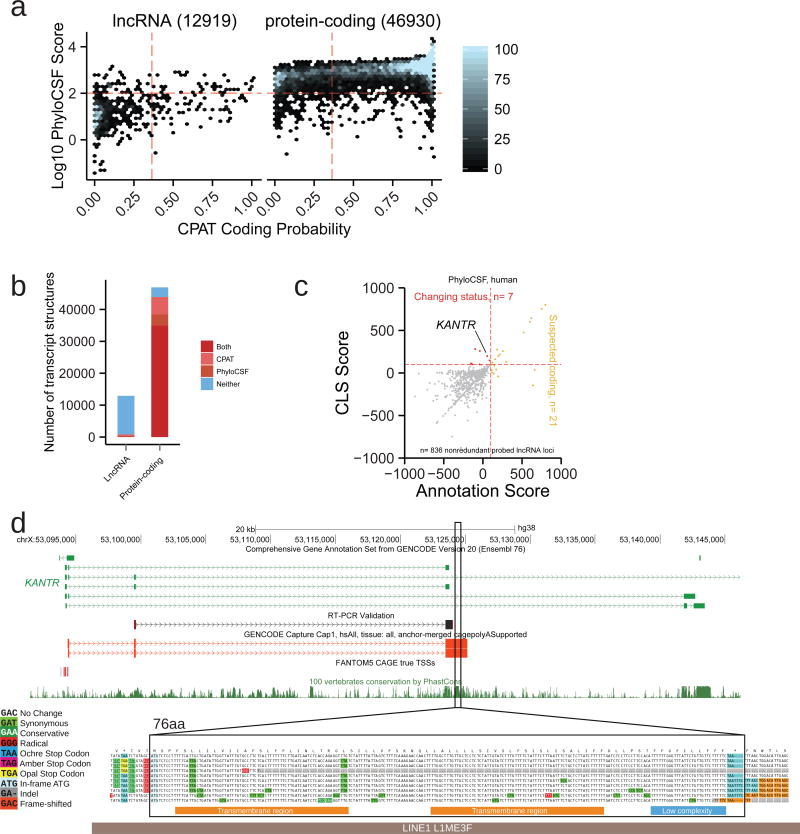
Accurate annotation of genes and their transcripts is a foundation of genomics, but currently no annotation technique combines throughput and accuracy. As a result, reference gene collections remain incomplete-many gene models are fragmentary, and thousands more remain uncataloged, particularly for long noncoding RNAs (lncRNAs). To accelerate lncRNA annotation, the GENCODE consortium has developed RNA Capture Long Seq (CLS), which combines targeted RNA capture with third-generation long-read sequencing. Here we present an experimental reannotation of the GENCODE intergenic lncRNA populations in matched human and mouse tissues that resulted in novel transcript models for 3,574 and 561 gene loci, respectively. CLS approximately doubled the annotated complexity of targeted loci, outperforming existing short-read techniques. Full-length transcript models produced by CLS enabled us to definitively characterize the genomic features of lncRNAs, including promoter and gene structure, and protein-coding potential. Thus, CLS removes a long-standing bottleneck in transcriptome annotation and generates manual-quality full-length transcript models at high-throughput scales.


Figures

Figure 1
Figure 1. Capture Long Seq approach to extend the GENCODE lncRNA annotation
a) Strategy for automated, high-quality transcriptome annotation. CLS may be used to complete existing annotations (blue), or to map novel transcript structures in suspected loci (orange). Capture oligonucleotides (black bars) are designed to tile across targeted regions. PacBio libraries are prepared for from the captured molecules. Illumina HiSeq short-read sequencing can be performed for independent validation of predicted splice junctions. Predicted transcription start sites can be confirmed by CAGE clusters (green), and transcription termination sites by non-genomically encoded polyA sequences in PacBio reads. Novel exons are denoted by lighter coloured rectangles. b) Summary of human and mouse capture library designs. Shown are the number of individual gene loci that were probed. “PipeR pred.”: orthologue predictions in mouse genome of human lncRNAs, made by PipeR; “UCE”: ultraconserved elements; “Prot. coding”: expression-matched, randomly-selected protein-coding genes; “ERCC”: spike-in sequences; “Ecoli”: randomly-selected E. coli genomic regions. Enhancers and UCEs are probed on both strands, and these are counted separately. “Total nts”: sum of targeted nucleotides. c) RNA samples used.
Figure 2
Figure 2. CLS yields an enriched, long-read transcriptome
a) Sequencing statistics. ROI = “Read Of Insert”, or PacBio reads. b) Length distributions of ROIs. Sequencing libraries were prepared from three size-selected cDNA fractions (see Supplementary Figure 1b–c). c) Breakdown of sequenced reads by gene biotype, pre- (left) and post-capture (right), for human (equivalent mouse data in Supplementary Figure 2j). Colours denote the on/off-target status of the reads: Green: reads from targeted features, including lncRNAs; Grey: reads originating from annotated but not targeted features; Yellow: reads from unannotated, non-targeted regions. The ERCC class comprises only those ERCC spike-ins that were probed. Note that when a given read overlapped more than one targeted class of regions, it was counted in each of these classes separately. d) Summary of capture performance. The y-axis shows percent of all mapped ROIs originating from a targeted region (“on-target”). Enrichment is defined as the ratio of this value in Post- and Pre-capture samples. Sequencing was performed using MiSeq technology. e) Response of read counts in captured cDNA to input RNA concentration. Upper panels: Pre-capture; Lower panels: Post-capture. Left: human; right: mouse. Note log scales for each axis. Points represent 92 spiked-in synthetic ERCC RNA sequences. 42 were probed in the capture design (green), the other 50 were not (violet). Lines represent linear fits to each dataset, whose parameters are shown. Given the log-log representation, a linear response of read counts to template concentrate should yield an equation of type y = c + mx, where m is 1.
Figure 3
Figure 3. Extending known lncRNA gene structures
a) Novel transcript structures from the SAMMSON locus. Green: GENCODE; Black/Red: known/novel CLS transcript models (TMs), respectively. An RT-PCR-amplified sequence is shown. b) Splice junction (SJ) discovery. Y-axis: unique SJs for human (mouse data in Supplementary Figure 6b) within probed lncRNA loci. Grey: GENCODE-annotated, CLS-undetected SJs. Dark green: CLS-detected, GENCODE-annotated SJs. Light green: novel CLS SJs. Left: all SJs; Right: high-confidence, HiSeq-supported SJs. See Supplementary Figure 6c for comparison to the miTranscriptome catalogue. c) Splice junction (SJ) motif strength. Panels plot the distribution of predicted SJ strength, for splice site (SS) acceptors (left) and donors (right) in human (mouse data in Supplementary Figure 7a). SS strength was computed using GeneID. Data are shown for non-redundant CLS SJs from targeted lncRNAs (top), protein-coding genes (middle), or randomly-selected SS-like dinucleotides (bottom). d) Splice junction discovery/saturation analysis in human. Panels show novel SJs discovered (y-axis) in simulations with increasing numbers of randomly sampled CLS ROIs (x-axis). SJs retrieved in each sample were stratified by level of support (Brown: all PacBio SJs; Orange: HiSeq-supported; Black: HiSeq-unsupported). Boxplots summarise 50 samples. Equivalent mouse data in Supplementary Figure 8a, and for novel TM discovery in Supplementary Figure 8b. e) Identification of putative precursor transcripts of small RNA genes. For each gene biotype, figures show the count of unique genes. “Orphans”: no annotated overlapping transcript in GENCODE, and targeted in capture library. “Potential Precursors”: orphan RNAs residing in the intron of a novel CLS TM. “Precursors”: reside in the exon of a novel transcript.
Figure 4
Figure 4. Full-length transcript annotation
a) 5’ and 3’ termini of transcript models (TMs) are inferred using CAGE clusters and polyA tails in ROIs, respectively. b) In conventional transcript merging (CM) (left), TSSs and polyA sites overlapping other exons are lost. “Anchored merging” (AM) (right) preserves such sites. c) AM yields more distinct TMs. y-axis: ROI count (pink), AM-TMs (brown), CM-TMs (turquoise). d) Full-length (FL) TMs at the CCAT1 / CASC19 locus. Red: novel FL TMs. Green/Red stars: CAGE/polyA-supported ends, respectively. An RT-PCR-amplified sequence is shown. e) AM-TMs for human (mouse data in Supplementary Figure 11b). y-axis: unique TM counts. Left: All AM-TMs, coloured by end support. Middle: FL TMs, coloured by novelty w.r.t. GENCODE. Green: novel TMs (see Methods for subcategories). Right: Novel FL TMs, coloured by biotype. f) Numbers of probed lncRNA loci mapped by CLS at increasing cutoffs for each category (human) (mouse data in Supplementary Figure 11c). g) DHS coverage of TSSs in HeLa-S3. y-axis: mean DHS density per TSS. Grey fringes: S.E.M. “CAGE+” / “CAGE-“: CLS TMs with / without supported 5’ ends, respectively. “GENCODE protein-coding”: TSSs of protein-coding genes. h) Comparing lncRNA transcript catalogues from GENCODE, CLS, and StringTie within captured regions. Mouse data in Supplementary Figure 12b–e. i) 5’/3’ transcript completeness, estimated by CAGE and upstream polyadenylation signals (PAS), respectively (human). Shown is the proportion of transcript ends with such support (“CAGE(+)”/”PAS(+)”). “Control”: random sample of internal exons. Mouse data in Supplementary Figure 12f. j) Spliced length distributions of transcript catalogues. Dotted line: median. Mouse data in Supplementary Figure 12c.
Figure 5
Figure 5. Discovery of novel lncRNA transcripts
a) The mature, spliced transcript length of: CLS full-length transcript models from targeted lncRNA loci (dark blue); transcript models from the targeted and detected GENCODE lncRNA loci (light blue); CLS full-length transcript models from protein-coding loci (red). b) The numbers of exons per full length transcript model, from the same groups as in (a). Dotted lines represent medians. c) Distance of annotated transcription start sites (TSS) to genomic features. Each cell displays the mean distance to nearest neighbouring feature for each TSS. TSS sets correspond to the classes from (a). “Shuffled” represent FL lincRNA TSS randomly placed throughout genome. d) – (i) Comparing promoter profiles across gene sets. The aggregate density of various features is shown across the TSS of indicated gene classes. Note that overlapping TSS were merged within classes, and TSSs belonging to bi-directional promoters were discarded (see Methods). The y-axis denotes the mean signal per TSS, and grey fringes represent the standard error of the mean. ChIP-Seq experiments are from HeLa cells (see Methods). phastCons17way: conservation scores across 17 vertebrate species. Gene sets are: Dark blue, full-length lncRNA models from CLS; Light blue, the GENCODE annotation models from which the latter were probed; Red, a subset of protein-coding genes with similar expression in HeLa as the CLS lncRNAs.
Figure 6
Figure 6. Properties of full-length lncRNAs
a) The predicted protein-coding potential of all full-length transcript models mapped to lncRNA (left) or protein-coding loci (right). Points represent full length (FL) transcript models (TM). y-axis displays the coding likelihood according to PhyloCSF, based on multiple genome alignments; x-axis displays that calculated by CPAT, an alignment-free method. Red lines indicate score thresholds, above which are considered protein-coding. TMs mapping to multiple biotypes were not considered. b) Numbers of classified TMs from (a). c) Discovery of new protein-coding transcripts in full-length CLS reads, using PhyloCSF. x axis: For each probed GENCODE gene annotation, score of best ORF across all transcripts; y axis: Score of best ORF in corresponding FL CLS TMs. Yellow: Loci from GENCODE v20 annotation predicted to encode proteins are highlighted. Red: LncRNA loci where new ORFs are discovered as a result of CLS transcript models. d) KANTR, example of an annotated lncRNA locus novel protein-coding sequence is discovered. The upper panel shows the structure of the lncRNA and the associated ORF (highlighted region) falling within novel FL CLS transcripts (red). Note how this ORF lies outside existing annotation (green), and overlaps a highly-conserved region (see PhastCons conservation track, below). Shown is a sequence obtained by RT-PCR (black). The lower panel, generated by CodAlignView (see URLs), reveals conservative substitutions in the predicted 76 aa ORF consistent with a functional peptide. High-confidence predicted SMART domains are shown as coloured bars below. This ORF lies within and antisense to a L1 transposable element (grey bar).

References

    1. Carninci P, et al. The transcriptional landscape of the mammalian genome. Science. 2005;309:1559–63. - PubMed
    1. Jia H, et al. Genome-wide computational identification and manual annotation of human long noncoding RNA genes. RNA. 2010;16:1478–1487. - PMC - PubMed
    1. Guttman M, et al. Chromatin signature reveals over a thousand highly conserved large non-coding RNAs in mammals. Nature. 2009;458:223–227. - PMC - PubMed
    1. Trapnell C, et al. Differential gene and transcript expression analysis of RNA-seq experiments with TopHat and Cufflinks. Nat Protoc. 2012;7:562–578. - PMC - PubMed
    1. Cabili MN, et al. Integrative annotation of human large intergenic noncoding RNAs reveals global properties and specific subclasses. Genes Dev. 2011;25:1915–1927. - PMC - PubMed

Substances