. 2018 May 1;28(5):1831-1845.
doi: 10.1093/cercor/bhx169.

Parvalbumin-Positive Interneurons Regulate Neuronal Ensembles in Visual Cortex

Affiliations

Parvalbumin-Positive Interneurons Regulate Neuronal Ensembles in Visual Cortex

Masakazu Agetsuma et al. Cereb Cortex. .

Abstract

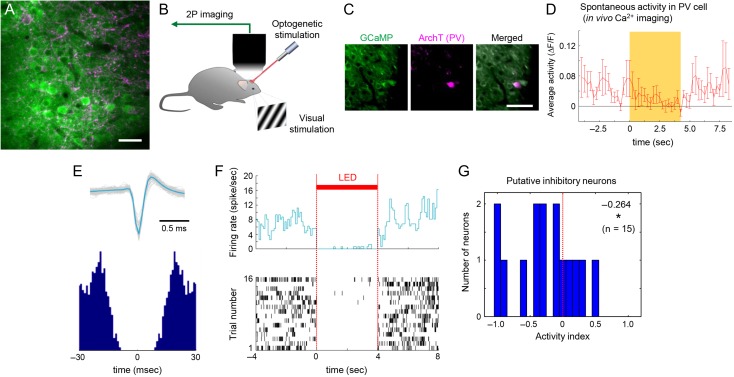
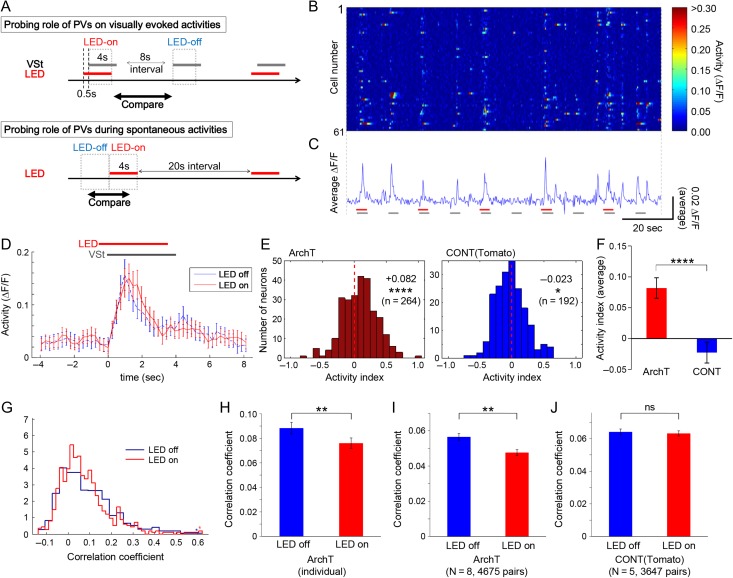
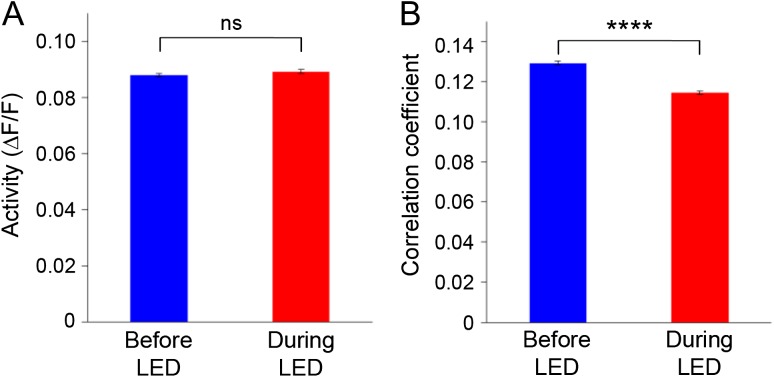
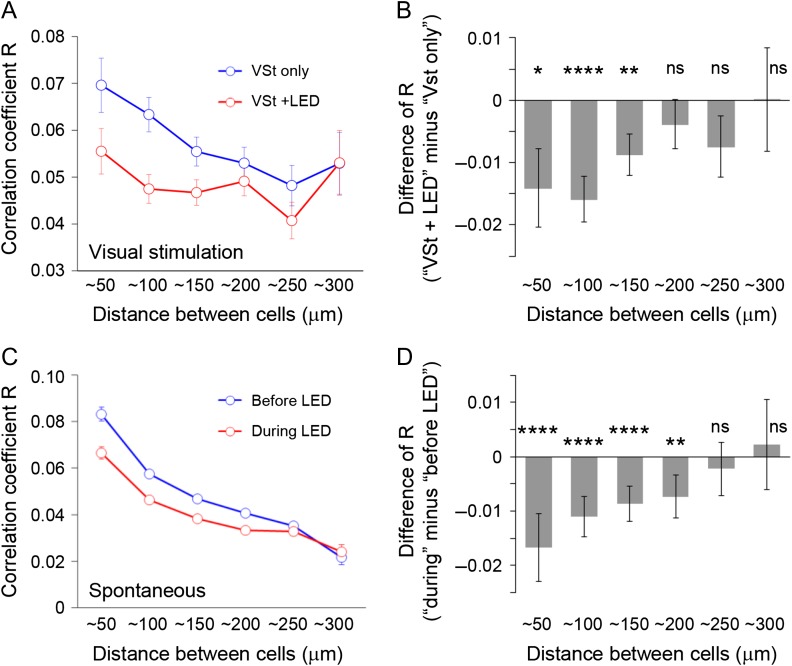
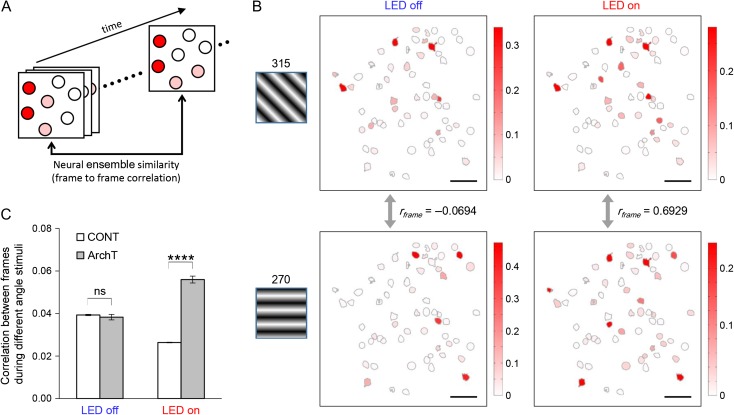
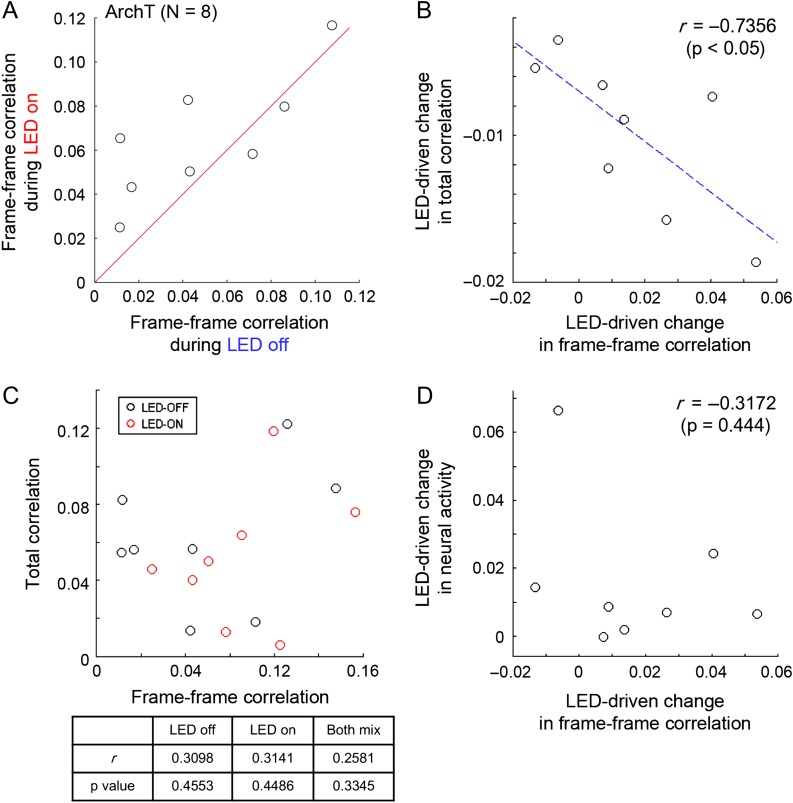
For efficient cortical processing, neural circuit dynamics must be spatially and temporally regulated with great precision. Although parvalbumin-positive (PV) interneurons can control network synchrony, it remains unclear how they contribute to spatio-temporal patterning of activity. We investigated this by optogenetic inactivation of PV cells with simultaneous two-photon Ca2+ imaging from populations of neurons in mouse visual cortex in vivo. For both spontaneous and visually evoked activity, PV interneuron inactivation decreased network synchrony. But, interestingly, the response reliability and spatial extent of coactive neuronal ensembles during visual stimulation were also disrupted by PV-cell suppression, which reduced the functional repertoire of ensembles. Thus, PV interneurons can control the spatio-temporal dynamics of multineuronal activity by functionally sculpting neuronal ensembles and making them more different from each other. In doing so, inhibitory circuits could help to orthogonalize multicellular patterns of activity, enabling neural circuits to more efficiently occupy a higher dimensional space of potential dynamics.


Figures

Figure 1.
Figure 1.
Imaging neuronal activity with and without optogenetic suppression of PV neurons. (A) Example of expression pattern of GCaMP5 (green) and ArchT-tdTomato (magenta), induced by AAV vectors coinjected into L2/3 in mouse V1. Multiple cell bodies of GCaMP5-expressing neurons were surrounded by fibers and synaptic boutons from ArchT-expressing PV neurons. Scale bar, 25 μm. (B) Setup for optogenetic manipulation during in vivo two-photon Ca2+ imaging. The right eye of the mouse was presented with a gray screen (for spontaneous activity) or drifting gratings (for visually evoked activity), whereas the left eye was covered completely by a blackout fabric to avoid visual inputs from the screen or LED light. (C) A PV neuron showing both strong expression of ArchT-tdTomato and Ca2+ signals in vivo. Scale bar, 50 μm. (D) Activity change of the PV cell expressing ArchT in vivo. Time course of mean activity over 30 trials. Spontaneous activity detected by GCaMP signals was significantly suppressed during the LED illumination. Yellow, LED illumination; error bar, s.e. (E) An example of a putative inhibitory interneuron in a PV-ArchT animal. This cell showed a typical spike waveform, when considering “half-amplitude duration” and “trough to peak time” (upper panel). An autocorrelogram of this cell (lower panel) suggested a high frequency of spikes during the normal (LED-off) condition (approximately ~50 Hz), typical of PV neurons. (F) The average firing rate (upper panel) and raster plot of the activity over 16 trials recorded from the same cell in panel E showed that this cell was clearly inactivated during the LED illumination, confirming the effect of the ArchT. (G) Summary of changes in activity of all observed putative inhibitory neurons (from 3 PV-ArchT animals). An “activity index” was used to quantify the change in activity by LED illumination. Average, P value (one-sample t-test was performed to consider whether the value was significantly different from zero), and total number of observed neurons are shown in the panel respectively. LED, timing of LED illumination; *, P < 0.05.
Figure 2.
Figure 2.
Inactivating PV neurons decreases network-wide synchrony. (A) Experimental procedures during visually evoked (upper panel) and spontaneous (lower panel) activity. Drifting gratings (8 different directions in each session, at random order) were used as visual stimulation, and LED illumination (4 s stimulus and 20 s interval LED) was used for optogenetic stimulation. VSt, timing of visual stimulation. (B, C) An example of time course changes of activities in simultaneously recorded multiple neurons (n = 61), with repeated visual stimulations (gray bar), and with or without LED stimulation (red bar). Neural activity was calculated from GCaMP5 signal, and plots of individual cells (B) and their average ΔF/F (C) depict visually evoked responses as well as spontaneous activations in the inter-trial interval. ΔF/F data were used for subsequent analyses, except when inferred spike probability was also tested (see Supplementary Fig. S3A–E). (D) Average activity traces over all trials across all 61 cells from the circuit shown in B, and C are plotted, showing a small increase in activity during LED illumination. LED, timing of LED illumination; VSt, timing of visual stimulation. (E) Summary of changes in activity of all observed networks (N = 8 circuits from 6 PV-ArchT animals (left), and N = 5 from 3 PV-Tomato animals (right)). An “activity index” was used to quantify the change in activity by LED illumination. Results of comparisons between “LED off” and “LED on” are shown in each panel (average, P value (Wilcoxon signed rank test), and total number of observed neurons, respectively). (F) The activity increase driven by PV suppression was also proved significant when compared with PV-Tomato control animals (same data in (E) were analyzed by Wilcoxon rank sum test). (G, H) LED illumination induced significant decorrelation in an example neural circuit (the same circuit shown in panel BD). Histogram showing distributions (G) and bar graph showing averages (H) of correlation coefficients, which were computed from all neuronal pairs in the circuit, suggest significant decreases in a PV-ArchT animal during LED illumination. Starred column, the bin for all values that lie off the edge of the graph. (I, J) Summary of effects of LED illumination on correlated neural activity. PV-ArchT animals (I, N = 8 and 4675 pairs) showed a significant LED-induced decrease, while control animals (J, N = 5 and 3647 pairs) showed no significant change. Error bar, s.e.; ns, not significant; *P < 0.05; **P < 0.01; ****P < 0.0001.
Figure 3.
Figure 3.
The effect of PV-cell suppression during spontaneous activity. (A) During spontaneous activity, neural activity was not significantly changed by LED illumination in PV-ArchT animals (N = 7, 501 neurons). (B) In contrast, PV-cell suppression significantly decorrelated spontaneous neural activity (N = 7, 18 328 pairs).
Figure 4.
Figure 4.
Locally existing temporal correlation is diminished by PV-cell suppression, with or without visual stimulation. Spatial modulation (i.e., the effect of cell-to-cell distance) of PV-dependent regulation of total correlations (R) was investigated during visual stimulation (A, B) and during spontaneous activity (C, D). (A, C) Correlation coefficients without or with LED (blue and red line, respectively) of PV-ArchT animals were plotted as a function of distance between cell bodies of GCaMP5-expressing neurons (number of pairs for each category (from ~50 to ~300 in this order): for (A), 436, 1027, 1238, 1039, 613, 261; for (C), 1650, 3998, 4842, 3982, 2580, 1059). Without LED illumination, the correlation coefficients decreased with cell–cell distance; correlation coefficients were high when cells were close together, and low when cells were distant. Although the similar tendency was seen during LED stimulation (suppression of PV neurons), cells at shorter distances showed more LED-driven decreases, whereas cells at greater distances did not show clear changes. (B, D) The degree of decrease in correlation coefficients by PV-cell suppression, plotted together with statistical results (one sample t-test to consider the difference from zero). The effects were dependent on cell–cell distances during visual stimulation (B) and spontaneous activity (D). VSt, visual stimulation; error bar, s.e.; ns, not significant; *P < 0.05; **p < 0.01; ****P < 0.0001.
Figure 5.
Figure 5.
Neuronal ensembles evoked by visual stimuli are disturbed by PV-cell suppression. (A) Schematic illustrating how we compared similarity between neural ensembles. Population activity patterns at different time points (frames) were compared to calculate frame–frame correlation coefficient (rframe). (B) Examples of neuronal ensembles disturbed by PV-cell suppression. Normally, as seen in the two left-hand panels, activity patterns during different visual stimuli (315°, top; 270°, bottom) were not similar and the frame–frame correlation was almost zero. On the other hand, as seen in the right-hand panels, more similar ensembles (and high correlation) were observed during PV-cell suppression (PV-ArchT animal). (C) PV-cell suppression significantly increased correlation coefficients between neuronal ensembles at different time points (i.e., different frames) while different angles of visual stimuli were presented. CONT, control animals (N = 5 animals; LED-off, n = 17 593 pairs of neurons; LED-on, n = 25 348); ArchT, PV-ArchT animals (N = 8; LED-off, n = 21 593; LED-on, n = 18 429); error bar, s.e.; ns, not significant; ****P < 0.0001.
Figure 6.
Figure 6.
Spatial and temporal network dynamics are coregulated by PV neurons. To compare spatial dynamics (neural ensemble similarity) with other temporal dynamics statistically, we compared average values for each circuit (N = 8) in the PV-ArchT animals. Each circle corresponds to the average value for each circuit. (A) Summary of the effect of PV-cell suppression on frame–frame correlation between LED-on and LED-off. Red line indicates 1:1 ratio. (B) Frame–frame correlation change driven by PV-cell suppression was compared with change in total correlation. Blue dotted lines correspond to the results of line fitting (linear regression). r and P values are results of Pearson’s correlation coefficient. (C) Raw values of frame–frame correlation were not directly correlated with raw values of total correlation, irrespective of LED-on/off or even when both were mixed for the analyses. To compare those values statistically, average values for each circuit (N = 8) of the PV-ArchT animals were compared. Each circle corresponds to the result of each circuit. (top) scatter plots representing the relationships. (bottom) summary of results of Pearson’s correlation coefficient for LED-on/off, or both data mixed. (D) Frame–frame correlation change driven by PV-cell suppression was compared with change in neural activity. r and P values are results of Pearson’s correlation coefficient.

References

    1. Abeles M. 1991. Corticonics: neural circuits of the cerebral cortex. Cambridge: Cambridge University Press.
    1. Akerboom J, Chen T-W, Wardill TJ, Tian L, Marvin JS, Mutlu S, Calderón NC, Esposti F, Borghuis BG, Sun XR, et al. . 2012. Optimization of a GCaMP calcium indicator for neural activity imaging. J Neurosci. 32:13819–13840. - PMC - PubMed
    1. Atallah BV, Bruns W, Carandini M, Scanziani M. 2012. Parvalbumin-expressing interneurons linearly transform cortical responses to visual stimuli. Neuron. 73:159–170. - PMC - PubMed
    1. Atallah BV, Scanziani M, Carandini M. 2014. Atallah et al. reply. Nature. 508:E3. - PubMed
    1. Averbeck BB, Latham PE, Pouget A. 2006. Neural correlations, population coding and computation. Nat Rev Neurosci. 7:358–366. - PubMed

Publication types

MeSH terms