. 2018 Jan 4;46(D1):D477-D485.
doi: 10.1093/nar/gkx1019.

The OMA orthology database in 2018: retrieving evolutionary relationships among all domains of life through richer web and programmatic interfaces

Affiliations

The OMA orthology database in 2018: retrieving evolutionary relationships among all domains of life through richer web and programmatic interfaces

Adrian M Altenhoff et al. Nucleic Acids Res. .

Abstract

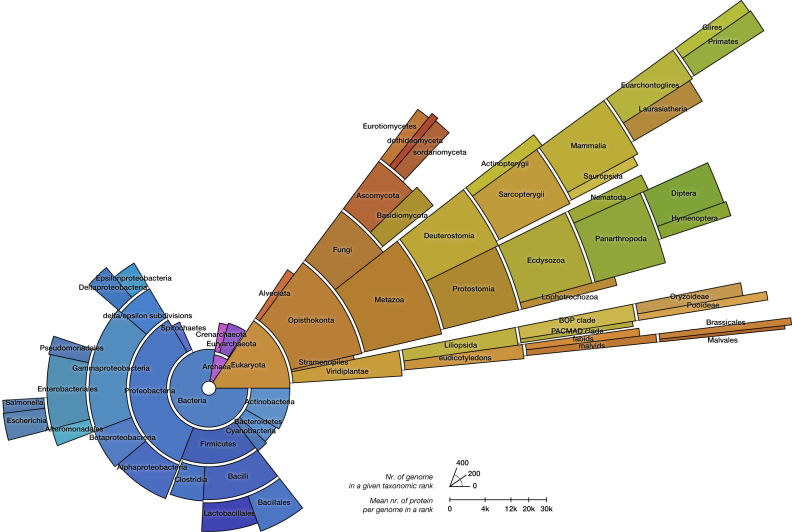
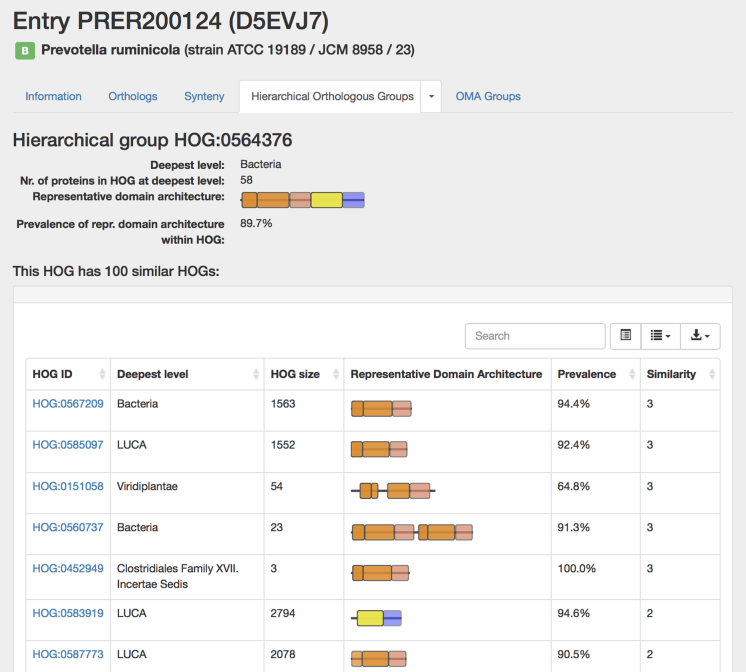
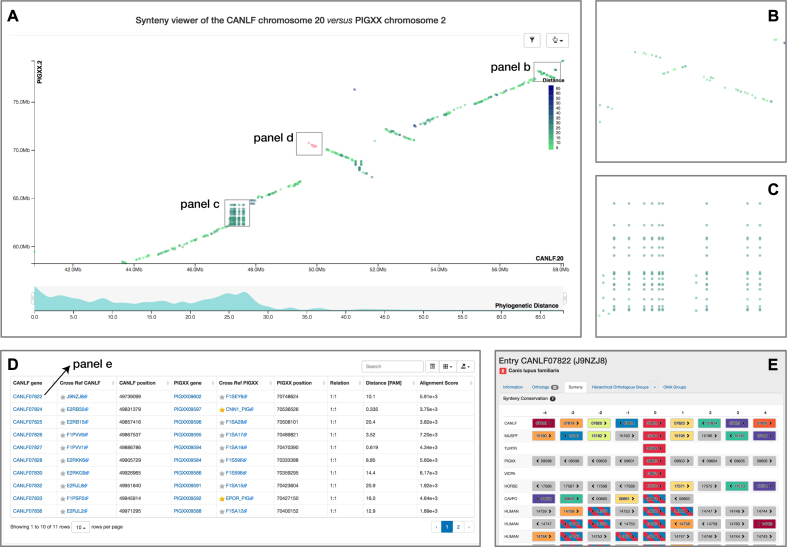
The Orthologous Matrix (OMA) is a leading resource to relate genes across many species from all of life. In this update paper, we review the recent algorithmic improvements in the OMA pipeline, describe increases in species coverage (particularly in plants and early-branching eukaryotes) and introduce several new features in the OMA web browser. Notable improvements include: (i) a scalable, interactive viewer for hierarchical orthologous groups; (ii) protein domain annotations and domain-based links between orthologous groups; (iii) functionality to retrieve phylogenetic marker genes for a subset of species of interest; (iv) a new synteny dot plot viewer; and (v) an overhaul of the programmatic access (REST API and semantic web), which will facilitate incorporation of OMA analyses in computational pipelines and integration with other bioinformatic resources. OMA can be freely accessed at https://omabrowser.org.


Figures

Figure 1.
Figure 1.
Distribution of the 2085 species contained in the October 2017 OMA release. The number of genomes in each taxonomic rank is conveyed as the angle of the relevant sector, and the average number of proteins is conveyed as its height in a square-root scale. Colors are automatically selected to contrast the different domains of life, and within them the different sister clades.
Figure 2.
Figure 2.
New interactive HOG viewer. An excerpt of the NOX family at the deuterostome level (left) and at the vertebrate level (right). The tree depicts relationships between species, squares depict genes (human NOX1, NOX2 and NOX3 genes are highlighted in color) and HOGs are delineated by vertical black lines.
Figure 3.
Figure 3.
The domain architecture view of a HOG. Information about the HOG (on the top) is followed by the table containing information about other HOGs that share at least one domain in common with the HOG of interest. Deepest level: the last common ancestor of the species represented in a HOG; HOG size: the number of genes in a HOG; Representative Domain Architecture: the architecture that is characteristic of most of the proteins in a HOG; Prevalence: the percentage of the proteins in a HOG that have this domain architecture; Similarity: the number of the domains shared between this HOG and the HOG of interest (including duplicated domains). The table can be sorted by any of the attributes.
Figure 4.
Figure 4.
New dotplot synteny viewer, which enables users to identify gene order conservation between chromosomes as diagonal segments (main view in panel A). Inversions are visible as diagonal flips, which can be nested (panel B). Tandem duplications on one or the other chromosome are visible as vertical or horizontal lines—and, if both are present, as blocks (panel C). To focus on a subset of the data according to sequence divergence, the user can restrict the desired range of the distribution of the evolutionary distance of each point. Points can be selected by the user, in which case more details are provided in a table (panel D), including links to the local synteny viewer (panel E).
Figure 5.
Figure 5.
Example of a SPARQL query to programmatically retrieve pairwise orthologs involving the sequence LATCH00597. Sample queries are provided in the right column of the page, accessible at http://sparql.omabrowser.org.

References

    1. Gabaldón T., Koonin E.V.. Functional and evolutionary implications of gene orthology. Nat. Rev. Genet. 2013; 14:360–366. - PMC - PubMed
    1. Fitch W.M. Distinguishing homologous from analogous proteins. Syst. Zool. 1970; 19:99–113. - PubMed
    1. Kachroo A.H., Laurent J.M., Yellman C.M., Meyer A.G., Wilke C.O., Marcotte E.M.. Evolution. Systematic humanization of yeast genes reveals conserved functions and genetic modularity. Science. 2015; 348:921–925. - PMC - PubMed
    1. Tatusov R.L., Fedorova N.D., Jackson J.D., Jacobs A.R., Kiryutin B., Koonin E.V., Krylov D.M., Mazumder R., Mekhedov S.L., Nikolskaya A.N. et al. . The COG database: an updated version includes eukaryotes. BMC Bioinformatics. 2003; 4:41. - PMC - PubMed
    1. Sonnhammer E.L.L., Ostlund G.. InParanoid 8: orthology analysis between 273 proteomes, mostly eukaryotic. Nucleic Acids Res. 2014; 43:D234–D239. - PMC - PubMed

Publication types

MeSH terms

LinkOut - more resources