. 2018 Feb 1;47(1):332-347.
doi: 10.1093/ije/dyx201.

Spillover effects in epidemiology: parameters, study designs and methodological considerations

Affiliations

Spillover effects in epidemiology: parameters, study designs and methodological considerations

Jade Benjamin-Chung et al. Int J Epidemiol. .

Abstract

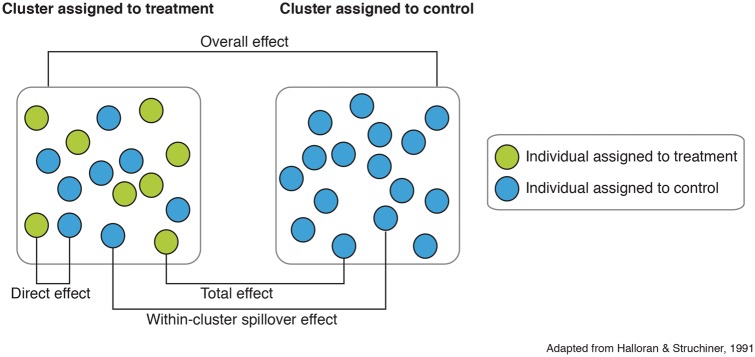
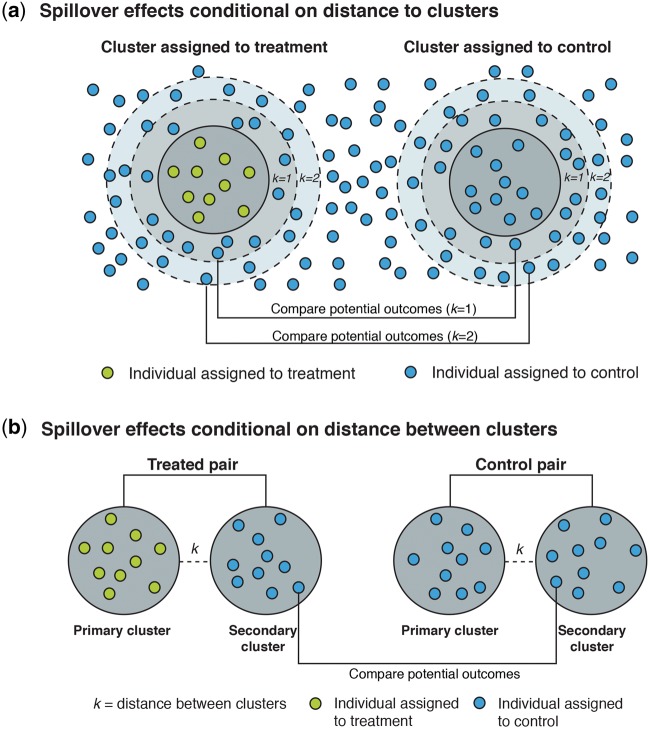
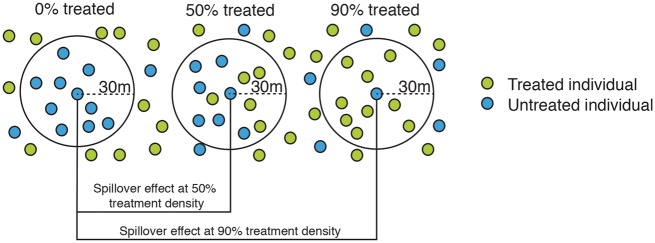
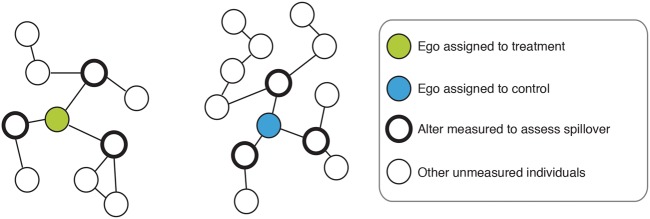
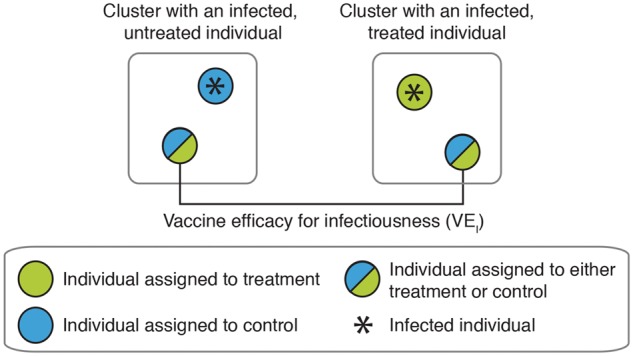
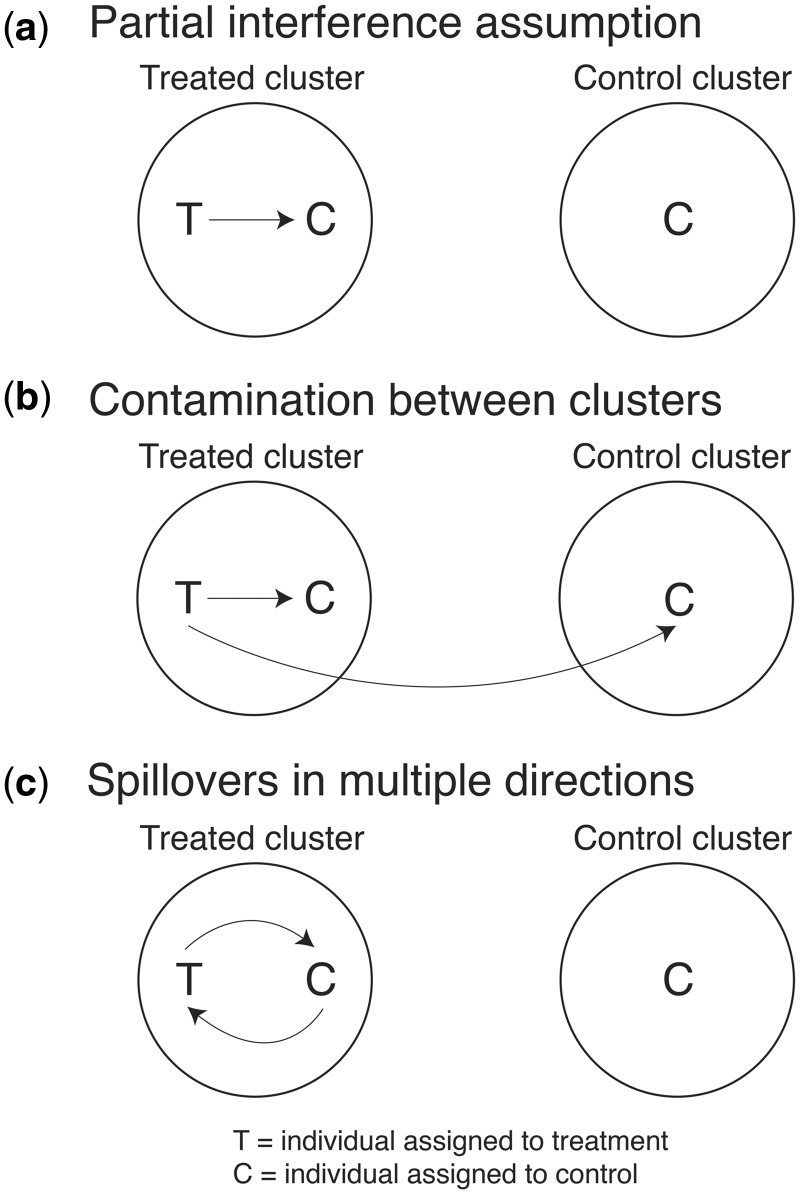
Many public health interventions provide benefits that extend beyond their direct recipients and impact people in close physical or social proximity who did not directly receive the intervention themselves. A classic example of this phenomenon is the herd protection provided by many vaccines. If these 'spillover effects' (i.e. 'herd effects') are present in the same direction as the effects on the intended recipients, studies that only estimate direct effects on recipients will likely underestimate the full public health benefits of the intervention. Causal inference assumptions for spillover parameters have been articulated in the vaccine literature, but many studies measuring spillovers of other types of public health interventions have not drawn upon that literature. In conjunction with a systematic review we conducted of spillovers of public health interventions delivered in low- and middle-income countries, we classified the most widely used spillover parameters reported in the empirical literature into a standard notation. General classes of spillover parameters include: cluster-level spillovers; spillovers conditional on treatment or outcome density, distance or the number of treated social network links; and vaccine efficacy parameters related to spillovers. We draw on high quality empirical examples to illustrate each of these parameters. We describe study designs to estimate spillovers and assumptions required to make causal inferences about spillovers. We aim to advance and encourage methods for spillover estimation and reporting by standardizing spillover parameter nomenclature and articulating the causal inference assumptions required to estimate spillovers.


Figures

Figure 1
Figure 1
Cluster-level spillover effects. This spillover parameter can be estimated in a two-stage randomized trial in which clusters are randomly allocated to treatment or control and then individuals within treatment clusters are randomly allocated to treatment or control. The direct effect compares potential outcomes of individuals allocated to treatment in treatment clusters to the potential outcomes of individuals allocated to control in treatment clusters. The cluster-level spillover effect compares potential outcomes of individuals allocated to control in treatment clusters to those of individuals in control clusters. The total effect compares the potential outcomes of individuals allocated to treatment in treatment clusters to those of individuals allocated to control in control clusters. The overall effect compares the potential outcomes of all individuals in clusters allocated to treatment to those of all individuals in clusters allocated to control.
Figure 2
Figure 2
Distance-based spillover effects. (a) Spillover effects conditional on distance to clusters can also be estimated in a two-stage randomized trial. This parameter compares the potential outcomes of untreated individuals within distance k of treated clusters to those of untreated individuals within distance k of control clusters. (b) Spillover effects conditional on distance between clusters can be estimated in a two-stage randomized trial. In the first stage, a study pair-matches clusters separated by distance k and then randomly allocates each pair to treatment or control. In the second stage, the study randomly selects one member from each pair to be the “primary” cluster; in the treated pairs, the primary cluster is assigned to treatment and the other cluster is assigned to control. Individuals in clusters assigned to treatment are randomly assigned to treatment or control. This parameter compares potential outcomes of individuals allocated to control in secondary clusters within distance k of treated clusters to those of individuals allocated to control in secondary clusters within distance k of control clusters.
Figure 3
Figure 3
Spillover effects conditional on treatment density. Spillover effects conditional on treatment density can be estimated in a two-stage randomized design that randomly allocates clusters to treatment or control and then randomly allocates individuals in treatment clusters to treatment or control. This parameter compares potential outcomes of untreated individuals in clusters allocated to treatment proportion p to those of untreated individuals in clusters allocated to a different treatment proportion p’. For example, in this figure, the treatment proportion within 30m of untreated individuals varies. This parameter compares potential outcomes of untreated individuals in clusters with treatment proportion 50% and 90% to those of untreated individuals in clusters with 0% of individuals allocated to treatment (i.e. control clusters).
Figure 4
Figure 4
Social network spillover effects. Social network spillover effects can be estimated in a study that randomizes treatment to egos (the initially enrolled subject) and compares the mean outcomes of alters (the person socially connected to the ego) in the treatment vs. control group.
Figure 5
Figure 5
Vaccine efficacy for infectiousness. This parameter is typically estimated in studies that enroll households with an infected individual (a “case”) and at least one uninfected individual (a “susceptible“). The parameter compares the secondary attack rate among uninfected susceptible individuals in households with a vaccinated case to the rate among those in households with unvaccinated cases. Susceptibles may be either vaccinated or unvaccinated.
Figure 6
Figure 6
Schematic of spillovers within and between clusters. (a) The partial interference assumption states that there are no spillovers between clusters of individuals but allows for spillovers among individuals within the same cluster. (b) When an intervention affects individuals in a cluster assigned to control, this is often referred to as “contamination” in the cluster-randomized trial literature. This is an example of a violation of the partial interference assumption depicted in (a). (c) Spillovers may occur in multiple directions: individuals assigned to treatment may influence potential outcomes of individuals assigned to control and vice versa. When such multi-dimensional effects occur, causal inference becomes complicated.

References

    1. Fine PE. Herd immunity: history, theory, practice. Epidemiol Rev 1993;15:265–302. - PubMed
    1. John TJ, Samuel R. Herd immunity and herd effect: new insights and definitions. Eur J Epidemiol 2000;16:601–06. - PubMed
    1. Miguel E, Kremer M. Worms: identifying impacts on education and health in the presence of treatment externalities. Econometrica 2004;72:159–217.
    1. Banerjee A, Chandrasekhar AG, Duflo E, Jackson MO. The diffusion of microfinance. Science 2013;341:1236498. - PubMed
    1. Halloran ME, Struchiner CJ. Study designs for dependent happenings. Epidemiology 1991;2:331–38. - PubMed