. 2018 Jan 4;46(D1):D1271-D1281.
doi: 10.1093/nar/gkx1029.

ProteomicsDB

Affiliations

ProteomicsDB

Tobias Schmidt et al. Nucleic Acids Res. .

Abstract

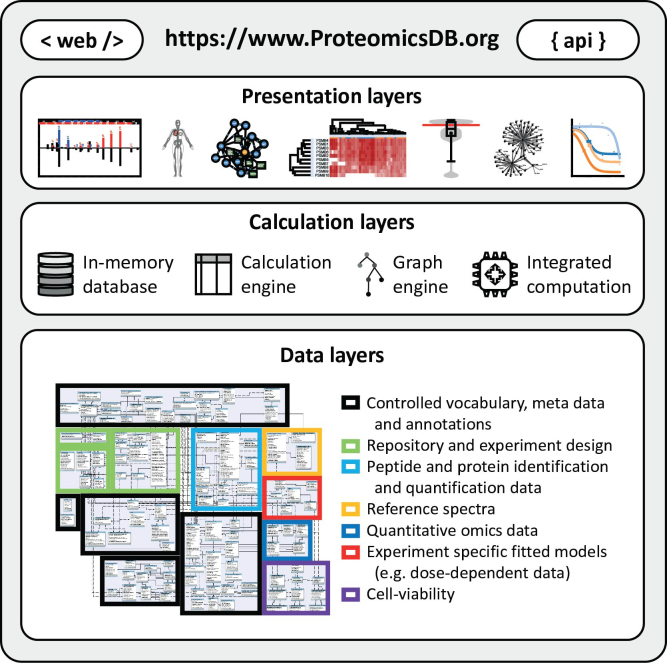
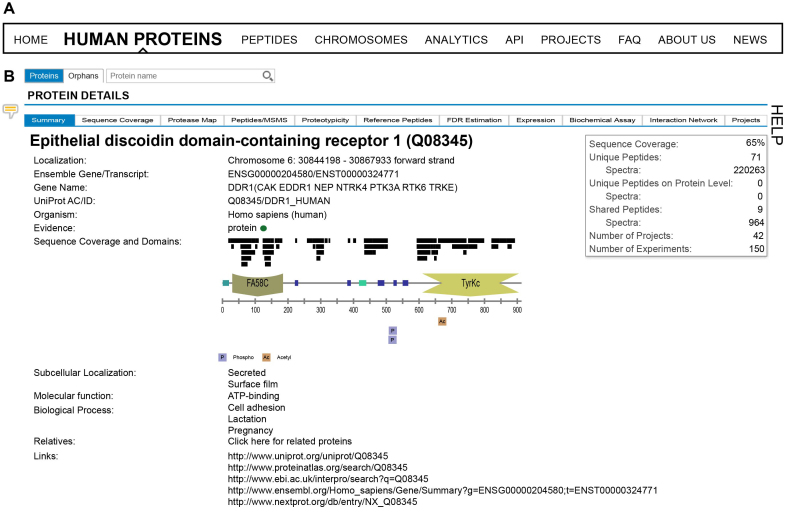
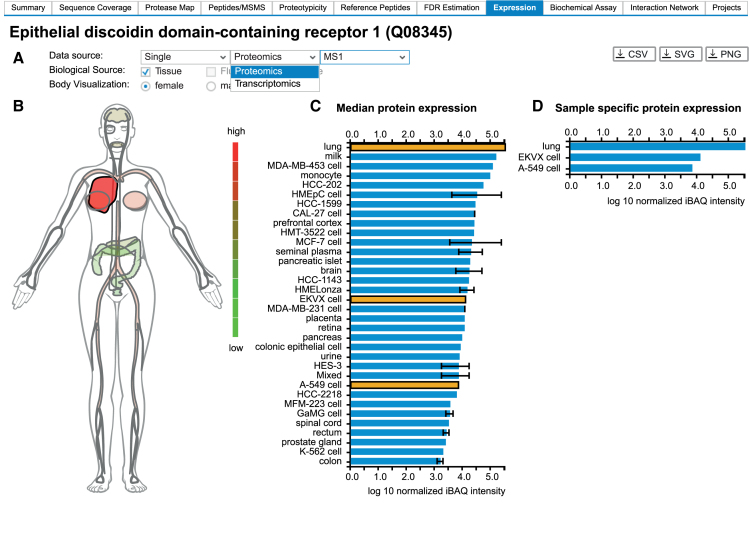
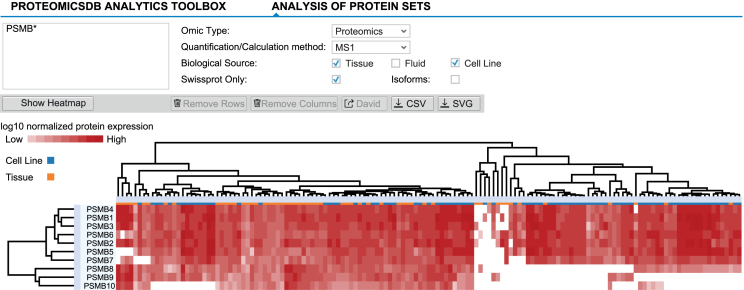
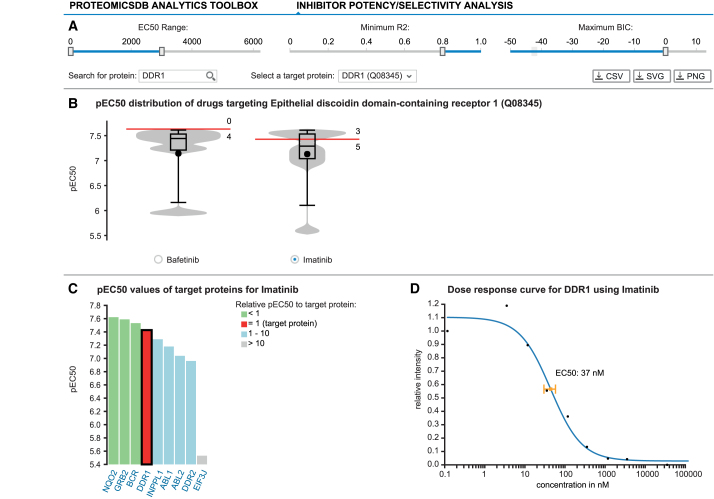
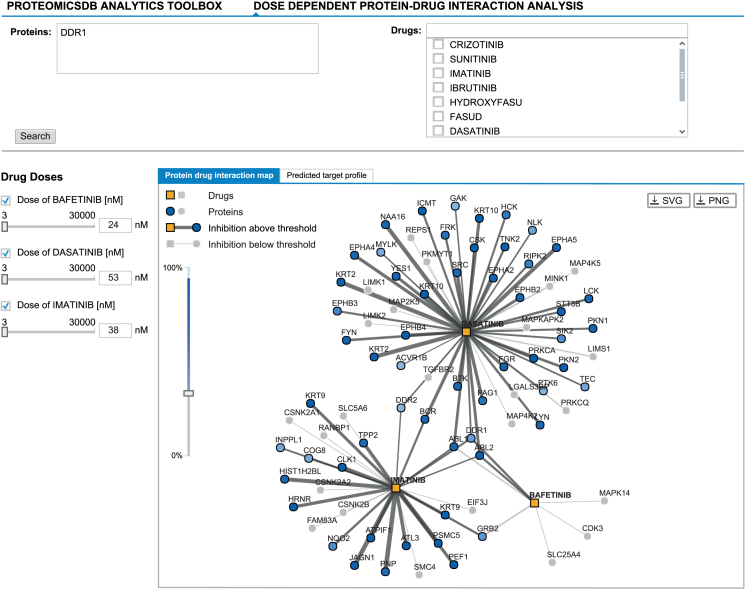
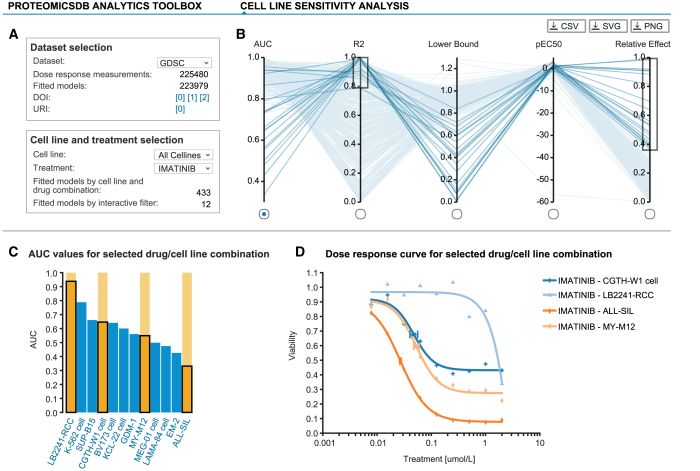
ProteomicsDB (https://www.ProteomicsDB.org) is a protein-centric in-memory database for the exploration of large collections of quantitative mass spectrometry-based proteomics data. ProteomicsDB was first released in 2014 to enable the interactive exploration of the first draft of the human proteome. To date, it contains quantitative data from 78 projects totalling over 19k LC-MS/MS experiments. A standardized analysis pipeline enables comparisons between multiple datasets to facilitate the exploration of protein expression across hundreds of tissues, body fluids and cell lines. We recently extended the data model to enable the storage and integrated visualization of other quantitative omics data. This includes transcriptomics data from e.g. NCBI GEO, protein-protein interaction information from STRING, functional annotations from KEGG, drug-sensitivity/selectivity data from several public sources and reference mass spectra from the ProteomeTools project. The extended functionality transforms ProteomicsDB into a multi-purpose resource connecting quantification and meta-data for each protein. The rich user interface helps researchers to navigate all data sources in either a protein-centric or multi-protein-centric manner. Several options are available to download data manually, while our application programming interface enables accessing quantitative data systematically.


Figures

Figure 1.
Figure 1.
ProteomicsDB consists of three major layers. The bottom layer is the data layer providing information to the calculation layer. It consists of seven major modules enabling the storage and retrieval of meta data, annotations and quantitative information associated with proteins and biological systems. Due to in-memory storage of the data layer, calculations using the calculation engine (structured query language), graph engine and other integrated programming languages (e.g. R and Python) are highly efficient. The results of these calculations can be explored in the presentation layer offering a variety of different interactive visualizations via the web interface or systematic access via the ProteomicsDB application programming interface (API).
Figure 2.
Figure 2.
(A) ProteomicsDB can be used to interrogate identification and quantification information on either single or multiple proteins. Information about single proteins can be accessed via the ‘Human Proteins’, ‘Peptides’, and ‘Chromosomes’ tabs. Information about multiple proteins can be explored via the ‘Analytics’ tab. (B) On the ‘Human Proteins’ tab, a brief summary is shown about the information available for a given protein. The corresponding domain structure is dynamically generated and alongside it, all observed peptides and post-translational modifications (PTMs) are displayed.
Figure 3.
Figure 3.
(A) ProteomicsDB can visualize expression data from different omics technologies. (B) A heatmap-like bodymap superimposing abundance values of tissues, fluids and cell lines (biological sources) onto their respective tissues of origin. (C) A bar chart resolving the expression data of b) on the level of their biological source. If multiple measurements for the same biological source are available, the error bar indicates the lowest and highest abundance observed for the selected protein. The bar chart and the bodymap are linked to each other, enabling the selection of either a tissue of origin in the bodymap (highlighted in dark red) or a biological source in the barchart (highlighted in orange). Here, the lung (high expression of DDR1), was selected in the bodymap, which automatically highlights all corresponding tissues and cell lines in the bar chart (EKVX cell and A-549 cell originated from lung tissue). (D) A bar chart visualizing sample-specific abundance values of the sources selected in middle bar chart (highlighted in orange). On click on one of the bars, the corresponding sample preparation protocol can be examined.
Figure 4.
Figure 4.
Expression heatmaps of multiple proteins across different tissues, fluids and cell lines can be displayed via the ‘Expression heatmap’ functionality of the ‘Analytics’ tab. Proteins and biological sources are shown as rows and columns, respectively. The dendrograms show the result of hierarchically clustering proteins and biological sources, respectively. Branches can be selected and either removed or used to perform GO-enrichment analyses (proteins). Here, all beta-units of the proteasome are displayed, suggesting differential expression of the canonical (expression of PSMB5, 6 and 7) and induced (expression of PSMB8, 9 and 10) proteasome across tissues and cell lines.
Figure 5.
Figure 5.
ProteomicsDB enables the exploration of drug selectivity data from various sources. (A) Starting with the selection of a target protein, the user can filter fitted selectivity curves using several criteria: the EC50 range, the R2 and BIC. (B) Violin plots depicting the pEC50 (-log10 EC50) distributions for all compounds targeting the selected protein given the filter criteria from (A). The red marker indicates the EC50 of the selected protein for each drug. Numbers above and below the red marker indicate the number of other target proteins with higher or lower potency, respectively. At the time of writing, Bafetinib shows the most potent and selective inhibition of DDR1 with the given filters. (C) Bar chart displaying the distribution of pEC50 values for Imatinib depicting all of its protein:drug interactions available in ProteomicsDB. (D) The underlying raw data and the fitted model can be investigated on click on one of the bars (black border). The scatter plot highlights the EC50 for the selected protein:drug pair.
Figure 6.
Figure 6.
The ‘Dose-dependent protein-drug interaction analysis’ enables exploring protein:drug interaction data in a multi-drug fashion. It allows the selection of promising drug combinations suitable to inhibit a given target protein (here DDR1). The graph-view shows the protein-drug interaction landscape of selected drugs. Drugs (squares) and proteins (circles) are connected if binding/inhibition curves (‘Biochemical Assay’ data) are available. Predicted inhibitory effects are highlighted in the graph by dark grey edges of varying thickness (proportional to the EC50) and proteins coloured in different shades of blue (indicates the level of inhibition). Predicted inhibitory effects are only shown in case they surpass a user-defined cutoff (left vertical slider). The concentration of a drug can be adjusted by either clicking an edge (sets the concentration of the drug to the EC50 of that interaction), by manually adjusting the concentration using the sliders on the left or by entering the desired concentration into the textbox (left; next to sliders). Again, Bafetinib shows the most selective inhibition of DDR1 at an EC50 of 24 nM in comparison to the other two available inhibitors Imatinib (38 nM) and Dasatinib (53 nM).
Figure 7.
Figure 7.
ProteomicsDB incorporates several publicly available large-scale drug sensitivity screens. (A) Each drug sensitivity dataset in ProteomicsDB can be explored in a cell-line- or inhibitor-centric way and general statistics are shown for a given selection. (B) Users can interactively filter dose-response models based on multiple parameters such as AUC, R2, lower bound, pEC50 and relative effect (percent decrease in viability over the tested concentration range). (C) The distribution of a given parameter is visualized in a bar chart on selection of an axis in (B). (D) The underlying raw and fitted data can be investigated on click on one or many of the bars (highlighted in orange). The scatter plot highlights the EC50 for the selected cell line:drug pairs. The cell lines CGTH-W1, LB2241-RCC, ALL-SIL and MY-M12 show a clear dose-dependent effect on their viability upon Imatinib treatment. However, their EC50 values vary, highlighting that these cell lines show differential sensitivity/resistance to Imatinib.

References

    1. Aebersold R., Mann M.. Mass spectrometry-based proteomics. Nature. 2003; 422:198–207. - PubMed
    1. Han X., Aslanian A., Yates J.R. 3rd. Mass spectrometry for proteomics. Curr. Opin. Chem. Biol. 2008; 12:483–490. - PMC - PubMed
    1. Hawkridge A.M., Muddiman D.C.. Mass spectrometry-based biomarker discovery: toward a global proteome index of individuality. Annu. Rev. Anal. Chem. (Palo Alto Calif.). 2009; 2:265–277. - PMC - PubMed
    1. Riffle M., Eng J.K.. Proteomics data repositories. Proteomics. 2009; 9:4653–4663. - PMC - PubMed
    1. Perez-Riverol Y., Alpi E., Wang R., Hermjakob H., Vizcaino J.A.. Making proteomics data accessible and reusable: current state of proteomics databases and repositories. Proteomics. 2015; 15:930–949. - PMC - PubMed

Publication types

LinkOut - more resources