. 2017 Nov 2;101(5):686-699.
doi: 10.1016/j.ajhg.2017.09.009. Epub 2017 Oct 26.

Inferring Relevant Cell Types for Complex Traits by Using Single-Cell Gene Expression

Affiliations

Inferring Relevant Cell Types for Complex Traits by Using Single-Cell Gene Expression

Diego Calderon et al. Am J Hum Genet. .

Abstract

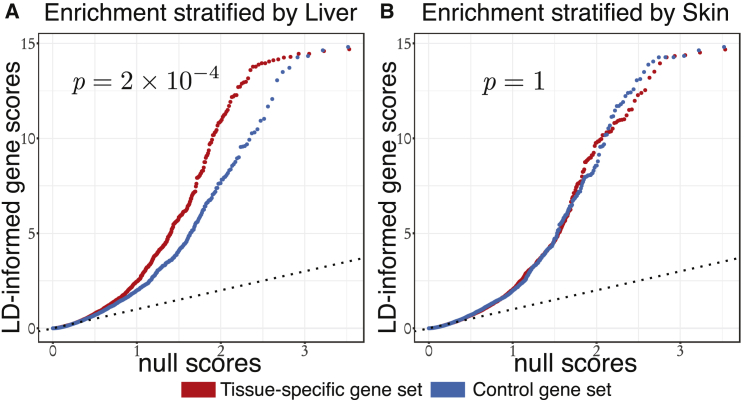
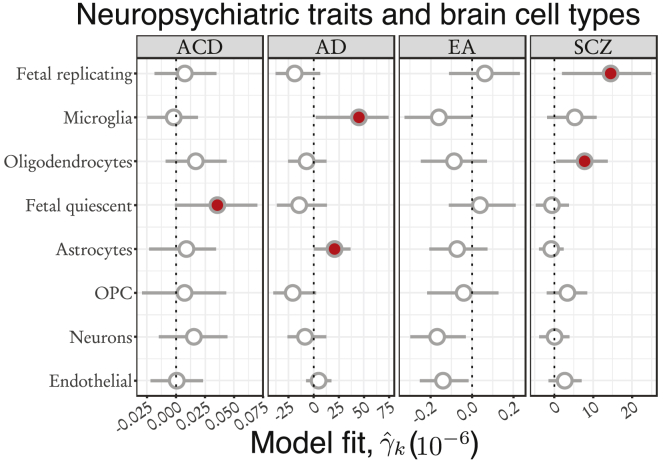
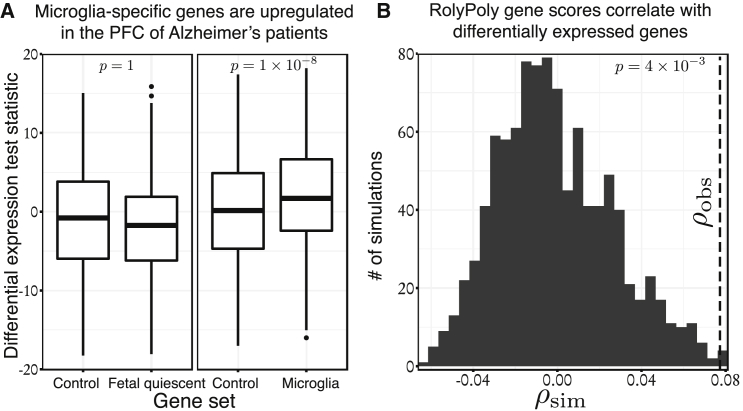
Previous studies have prioritized trait-relevant cell types by looking for an enrichment of genome-wide association study (GWAS) signal within functional regions. However, these studies are limited in cell resolution by the lack of functional annotations from difficult-to-characterize or rare cell populations. Measurement of single-cell gene expression has become a popular method for characterizing novel cell types, and yet limited work has linked single-cell RNA sequencing (RNA-seq) to phenotypes of interest. To address this deficiency, we present RolyPoly, a regression-based polygenic model that can prioritize trait-relevant cell types and genes from GWAS summary statistics and gene expression data. RolyPoly is designed to use expression data from either bulk tissue or single-cell RNA-seq. In this study, we demonstrated RolyPoly's accuracy through simulation and validated previously known tissue-trait associations. We discovered a significant association between microglia and late-onset Alzheimer disease and an association between schizophrenia and oligodendrocytes and replicating fetal cortical cells. Additionally, RolyPoly computes a trait-relevance score for each gene to reflect the importance of expression specific to a cell type. We found that differentially expressed genes in the prefrontal cortex of individuals with Alzheimer disease were significantly enriched with genes ranked highly by RolyPoly gene scores. Overall, our method represents a powerful framework for understanding the effect of common variants on cell types contributing to complex traits.

Keywords: GWAS; complex traits; neuropsychiatric disease; single-cell gene expression.


Figures

Figure 1
Figure 1
RolyPoly Detects Trait-Associated Annotations by Using GWAS Summary Statistics and Gene Expression Profiles (A) We model the variance of GWAS effect sizes of SNPs associated with a gene as a function of gene annotations, in particular gene expression, while accounting for LD by using population-matched genotype correlation information. (Manhattan plot is based on data from Willer et al.23) (B) From a database of functional information (such as tissue or cell-type RNA-seq), we learn a regression coefficient (γˆk) that captures each annotation’s influence on the variance of GWAS effect sizes. A deviation from the mean gene expression value of ajk results in an increase of ajkγˆk to the expected variance of gene-associated GWAS effect sizes. The value γˆ0 represents a regression intercept that estimates the population mean variance. To check learned model parameters, we expect to see an enrichment of LD-informed GWAS gene scores for genes that are specifically expressed in a tissue inferred to be trait relevant. Finally, from a model fit, we can prioritize trait-relevant tissues and genes.
Figure 2
Figure 2
Simulation Results (A) Parameter inference is unbiased and accurate for a range of simulated γ effects. The red-dashed line represents the identity line. (B) Power as a function of the γk and annotation values defined as hkannot in the Material and Methods. Even when some SNPs are drawn from the null distribution, we maintain reasonable power to detect associations.
Figure 3
Figure 3
TC and GTEx Tissue Ranking (Left) Tissues are ranked by p value, which represents the strength of association with TC. (Right) Corresponding parameter estimates and 95% confidence intervals.
Figure 4
Figure 4
TC and GTEx Q-Q Plot Comparing Enrichment of LD-Informed Gene Scores Both plots show the p value from RolyPoly for the association between the respective tissue and TC. (A) Q-Q plot comparing enrichment of LD-informed gene scores in genes that are uniquely expressed in the liver. To select gene sets, we sorted genes by their normalized expression in the liver and took the top 20% of genes (red) and the bottom 20% of genes (blue). (B) A similar plot stratifying gene values by skin-specific gene expression (skin is not predicted to have a role in cholesterol regulation).
Figure 5
Figure 5
Neuropsychiatric Trait Associations with Single-Cell-Based Cell Types Parameter estimates for age-related cognitive decline (ACD), Alzheimer disease (AD), educational attainment (EA), schizophrenia (SCZ), and single-cell-based cell-type clusters from the human brain dataset. Range specifies the empirical bounds of the 95% confidence interval. Estimates highlighted in red represent significant associations (p < 0.05).
Figure 6
Figure 6
RolyPoly-Inferred Model Parameters Predict DE Genes in the Prefrontal Cortex (PFC) of Individuals with AD (A) Differential-expression test statistics (a larger value represents genes that are upregulated in the brains of affected individuals) were significantly larger in the set of genes specifically expressed in the microglia cell type than in a control gene set (right). We define the set of cell-type-specific genes as the top 10% specifically expressed genes. We compared them with the control gene set, which includes genes that deviate the least from average gene expression. The differential-expression test statistic was not enriched in genes specifically expressed in the fetal quiescent cell type (left). (B) Controlling for the effect of correlation between gene expression values of co-regulated genes, we observed an enrichment of hjgene values in DE genes. The significance of the observed Spearman’s rank-correlation coefficient between hjgene and the differential-expression test statistic was evaluated with a null distribution generated from simulations, which accounted for the gene expression covariance structure (full details of this test can be found in the Material and Methods).

References

    1. Claussnitzer M., Dankel S.N., Kim K.-H., Quon G., Meuleman W., Haugen C., Glunk V., Sousa I.S., Beaudry J.L., Puviindran V. FTO obesity variant circuitry and adipocyte browning in humans. N. Engl. J. Med. 2015;373:895–907. - PMC - PubMed
    1. Sekar A., Bialas A.R., de Rivera H., Davis A., Hammond T.R., Kamitaki N., Tooley K., Presumey J., Baum M., Van Doren V., Schizophrenia Working Group of the Psychiatric Genomics Consortium Schizophrenia risk from complex variation of complement component 4. Nature. 2016;530:177–183. - PMC - PubMed
    1. Raj T., Rothamel K., Mostafavi S., Ye C., Lee M.N., Replogle J.M., Feng T., Lee M., Asinovski N., Frohlich I. Polarization of the effects of autoimmune and neurodegenerative risk alleles in leukocytes. Science. 2014;344:519–523. - PMC - PubMed
    1. Ongen H., Brown A.A., Delaneau O., Panousis N., Nica A.C., GTEx Consortium. Dermitzakis E.T. Estimating the causal tissues for complex traits and diseases. bioRxiv. 2016 - PubMed
    1. Farh K.K.-H., Marson A., Zhu J., Kleinewietfeld M., Housley W.J., Beik S., Shoresh N., Whitton H., Ryan R.J., Shishkin A.A. Genetic and epigenetic fine mapping of causal autoimmune disease variants. Nature. 2015;518:337–343. - PMC - PubMed

MeSH terms