. 2017 Nov 30;171(6):1272-1283.e15.
doi: 10.1016/j.cell.2017.09.050. Epub 2017 Oct 26.

MHC-I Genotype Restricts the Oncogenic Mutational Landscape

Affiliations

MHC-I Genotype Restricts the Oncogenic Mutational Landscape

Rachel Marty et al. Cell. .

Abstract

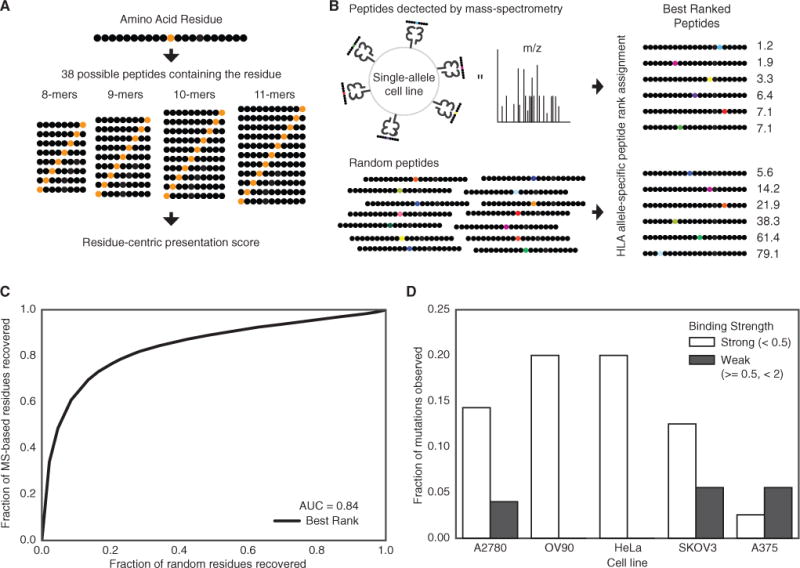
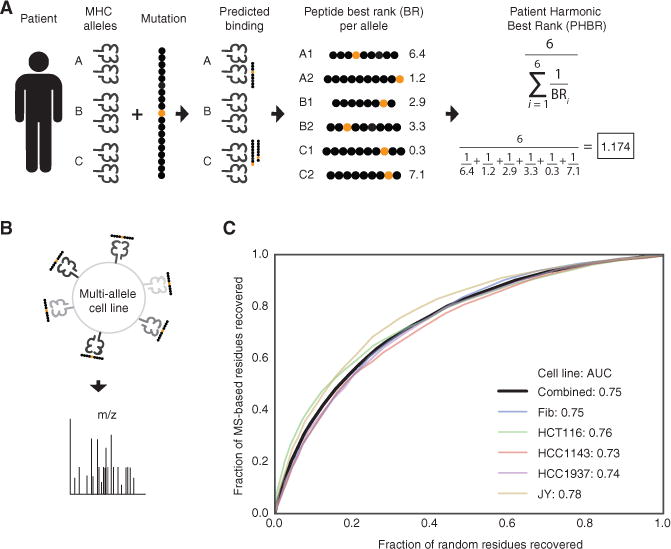
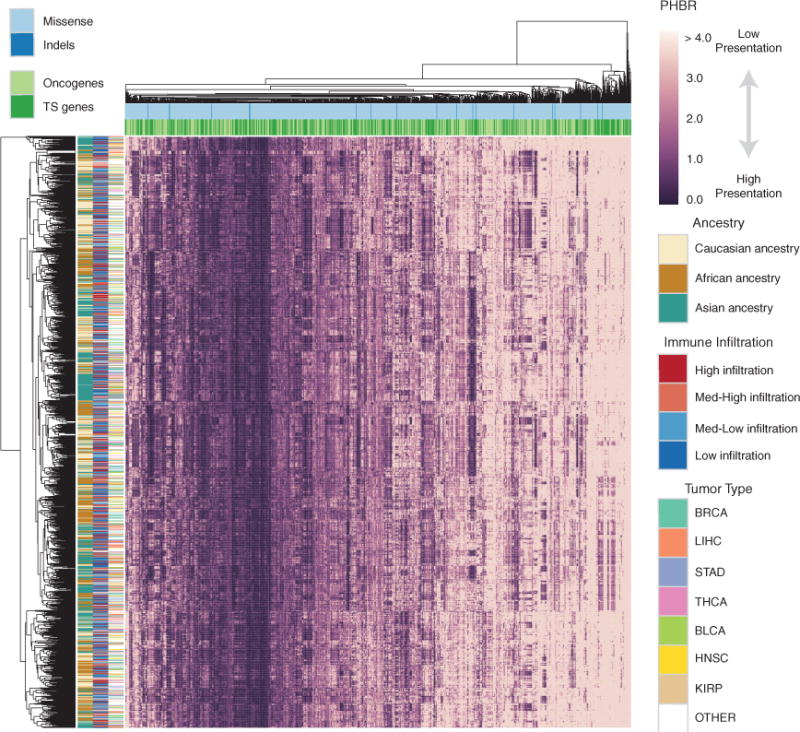
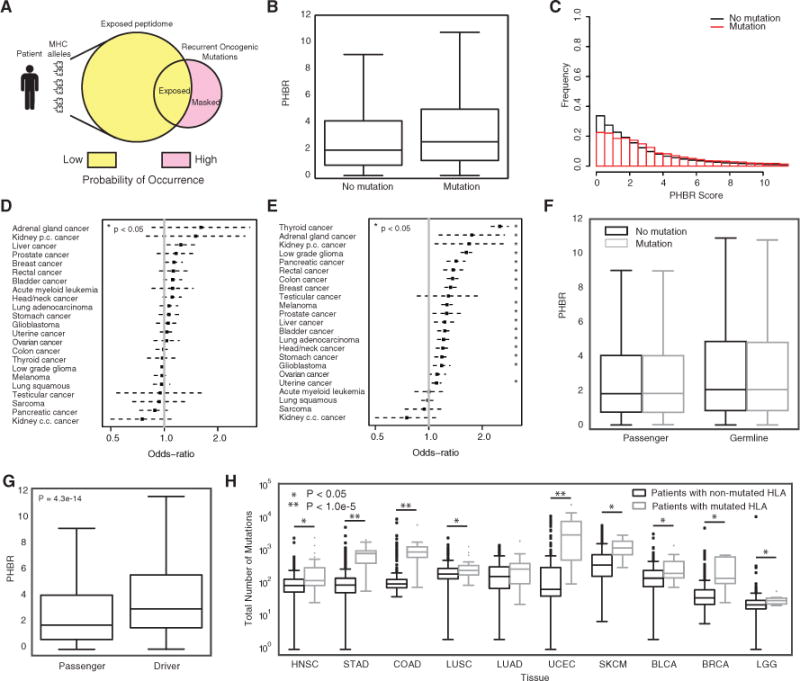
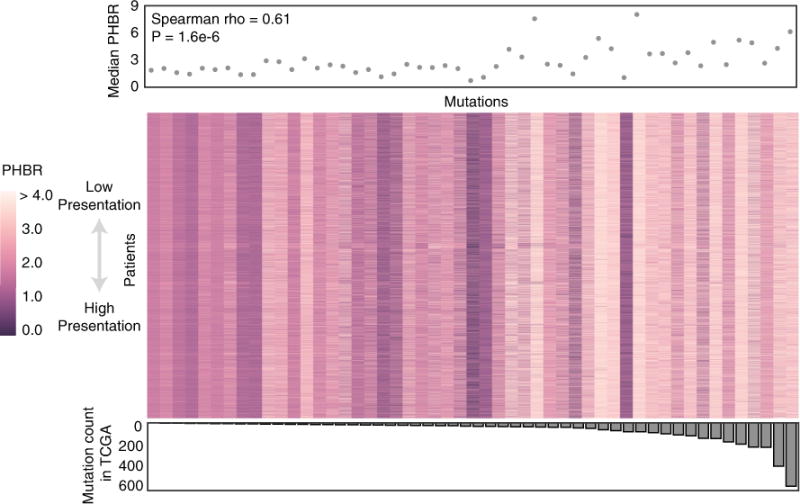
MHC-I molecules expose the intracellular protein content on the cell surface, allowing T cells to detect foreign or mutated peptides. The combination of six MHC-I alleles each individual carries defines the sub-peptidome that can be effectively presented. We applied this concept to human cancer, hypothesizing that oncogenic mutations could arise in gaps in personal MHC-I presentation. To validate this hypothesis, we developed and applied a residue-centric patient presentation score to 9,176 cancer patients across 1,018 recurrent oncogenic mutations. We found that patient MHC-I genotype-based scores could predict which mutations were more likely to emerge in their tumor. Accordingly, poor presentation of a mutation across patients was correlated with higher frequency among tumors. These results support that MHC-I genotype-restricted immunoediting during tumor formation shapes the landscape of oncogenic mutations observed in clinically diagnosed tumors and paves the way for predicting personal cancer susceptibilities from knowledge of MHC-I genotype.

Keywords: antigen presentation; cancer; cancer predisposition; cancer susceptibility prediction; human leukocyte antigen; immunoediting; immunology; immunotherapy; major histocompatibility complex; neoantigens.


Figures

Figure 1
Figure 1. Development of a Residue-Centric Presentation Score
(A) A graphical representation of calculating the presentation score for a particular residue. Each residue can be presented in 38 different peptides of differing lengths between 8 and 11. (B) Single-allele MS data from Abelin et al. (2017) was compared to a random background of peptides to determine the best residue-centric score for quantifying of extracellular presentation (best rank score shown). (C) A ROC curve showing the accuracy of the best rank residue presentation score for classifying the extracellular presentation of a residue by an MHC allele. The aggregated presentation scores for MS data from 16 different alleles was compared to a random set of residues with the same 16 alleles. (D) The fraction of native residues found for the list of mutations identified in five different cancer cell lines for strong (rank <0.5) and weak (0.5 % ≤ rank <2) binders. The mutated version of the residue is assumed to be presented if the mutation does not disrupt the binding motif. See also Figure S1 and Table S1.
Figure 2
Figure 2. Development of a Patient Specific Residue-Centric Score
(A) A graphical representation of calculating the patient presentation score for a particular residue. Each patient has six MHC alleles. The Patient Harmonic-mean Best Rank (PHBR) presentation score is the harmonic mean of the best rank score of a residue across a patient’s six alleles. (B) An experimental schematic of the MS data collection used in the score validation. (C) A ROC curve showing the accuracy of the PHBR for classifying the extracellular presentation of a residue by a patient’s six MHC alleles for 5 different cell lines (colors) and for peptides from all cell lines combined (black). The aggregated PHBR presentation scores for 5 cell lines expressing 6 MHC alleles was compared to a random set of residues for the same MHC alleles. See also Figure S2 and Table S2.
Figure 3
Figure 3. Pan-cancer Overview of Patient-Mutation Presentation
A clustered heatmap of 1,500 patients in TCGA with the 1,018 frequent cancer mutations. The patients are selected to achieve equivalent number of each ethnicity. The heatmap is colored by PHBR score. Column and row coloring highlight groupings of patients and mutations into different categories. See also Figure S3 and Table S3.
Figure 4
Figure 4. PHBR Predictive Power for Mutation Probability
(A) A schematic showing the fundamental hypothesis by which an individual’s MHC allele-specific coverage of the oncogenic mutational space influences the probability of occurrence of oncogenic mutations. (B) A boxplot denoting the difference in PHBR scores for the 1,018 oncogenic mutations and 9,176 patients split by mutation occurrence. Error bars denote the 1.5 IQR range. (C) Histograms of PHBR scores associated with the presence or absence of mutations. (D and E) The ORs (black boxes) and 95% CIs associated with a 1-unit increase in PHBR score for different cancer types using (D) the within-mutation model and (E) the within-patient model. (F) Boxplots for the PHBR scores grouped according to presence or absence for passenger mutations and germline variants. Error bars denote the 1.5 IQR range. (G) A boxplot denoting the difference in patient-specific presentation scores for acquired mutations when divided into driver mutations and passenger mutations. Error bars denote the 1.5 IQR range. (H) Boxplots showing the total number of mutations acquired for patients who acquired a mutation in one of their HLA genes versus those that did not. Patients are divided by tumor type and only the tumor types with at least five HLA-mutated patients are shown. Error bars denote the 1.5 IQR range. See also Figure S4, Table S5, and Table S6.
Figure 5
Figure 5. Population Median Presentation of Recurrent Oncogenic Mutations Determines Their Frequency among Tumors
Heatmap showing PHBR presentation scores for all 9,176 patients of the 1,018 recurrent cancer mutations (observed in at least three patients) grouped by their mutation count in TCGA and displayed as a median. The median PHBR score across the population for each mutation group is plotted above the heatmap. The number of times the mutation group is observed in TCGA is plotted below the heatmap. The correlation between the mutation count in TCGA and the median PHBR score is calculated with a Spearman test. See also Figure S5.
Figure 6
Figure 6. Recurrent Oncogenic Mutations Are Universally Poorly Presented by the Human MHC-I
(A) Boxplots denoting the distribution of residue presentation scores for 6 different classes of residue including 2,915 MHC-I alleles. Error bars denote the 1.5 IQR range. (B) The fraction of residue presentation scores in (A) that fall below the 0.5 threshold of strong binding and the 2 threshold of binding. (C) Boxplots denoting the distribution of residue presentation scores for mutated residues in oncogenes, tumor suppressor genes, and random genes as compared to the native versions of the same residues with 2,915 MHC-I alleles. Outliers are excluded for visualization purposes. Error bars denote the 1.5 IQR range. (D) The fraction of residue presentation scores in (C) that fall below the 0.5 threshold of strong affinity and the 2 threshold of any affinity. See also Figure S6.

Comment in

References

    1. Abelin JG, Keskin DB, Sarkizova S, Hartigan CR, Zhang W, Sidney J, Stevens J, Lane W, Zhang GL, Eisenhaure TM, et al. Mass spectrometry profiling of HLA-associated peptidomes in mono-allelic cells enables more accurate epitope prediction. Immunity. 2017;46:315–326. - PMC - PubMed
    1. Aken BL, Achuthan P, Akanni W, Amode MR, Bernsdorff F, Bhai J, Billis K, Carvalho-Silva D, Cummins C, Clapham P, et al. Ensembl 2017. Nucleic Acids Res. 2017;45(D1):D635–D642. - PMC - PubMed
    1. Bassani-Sternberg M, Pletscher-Frankild S, Jensen LJ, Mann M. Mass spectrometry of human leukocyte antigen class I peptidomes reveals strong effects of protein abundance and turnover on antigen presentation. Mol Cell Proteomics. 2015;14:658–673. - PMC - PubMed
    1. Bates D, Maechler M, Bolker B, Walker S. Fitting linear mixed-effects models using lme4. J Stat Softw. 2015;67:1–48.
    1. Bozic I, Antal T, Ohtsuki H, Carter H, Kim D, Chen S, Karchin R, Kinzler KW, Vogelstein B, Nowak MA. Accumulation of driver and passenger mutations during tumor progression. Proc Natl Acad Sci USA. 2010;107:18545–18550. - PMC - PubMed

Substances