. 2017 Dec 5;26(6):872-883.e5.
doi: 10.1016/j.cmet.2017.09.023. Epub 2017 Oct 26.

Abrogating Mitochondrial Dynamics in Mouse Hearts Accelerates Mitochondrial Senescence

Affiliations

Abrogating Mitochondrial Dynamics in Mouse Hearts Accelerates Mitochondrial Senescence

Moshi Song et al. Cell Metab. .

Abstract

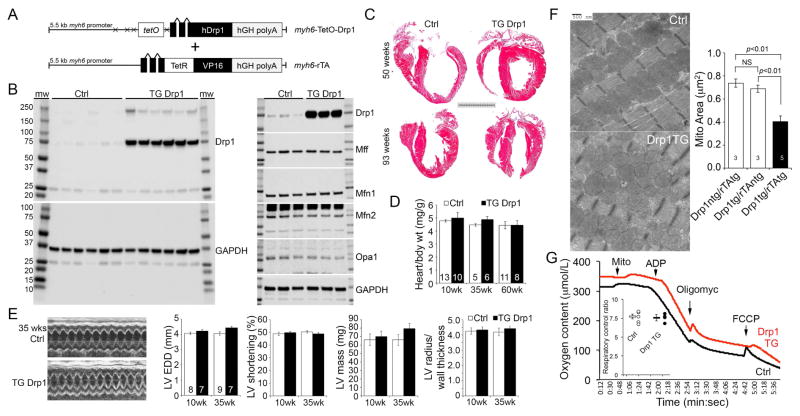
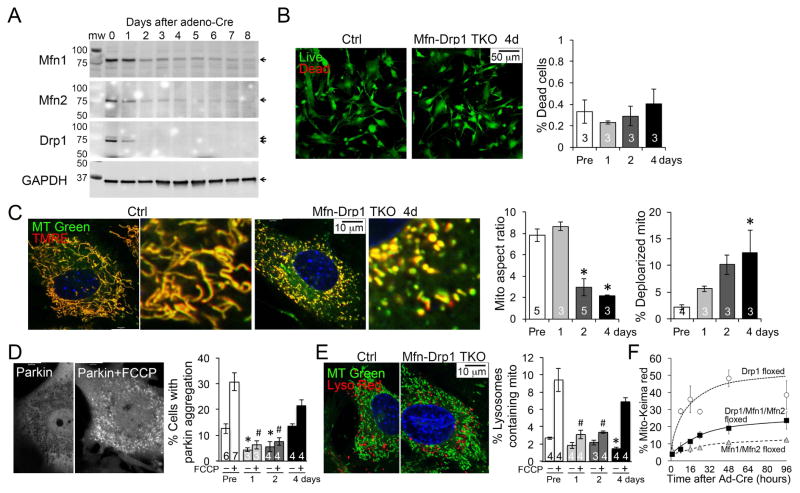
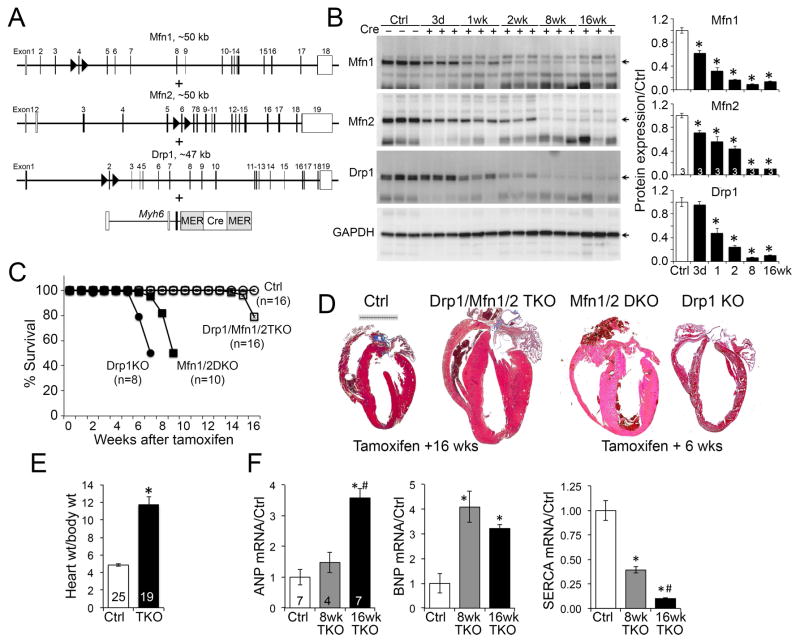
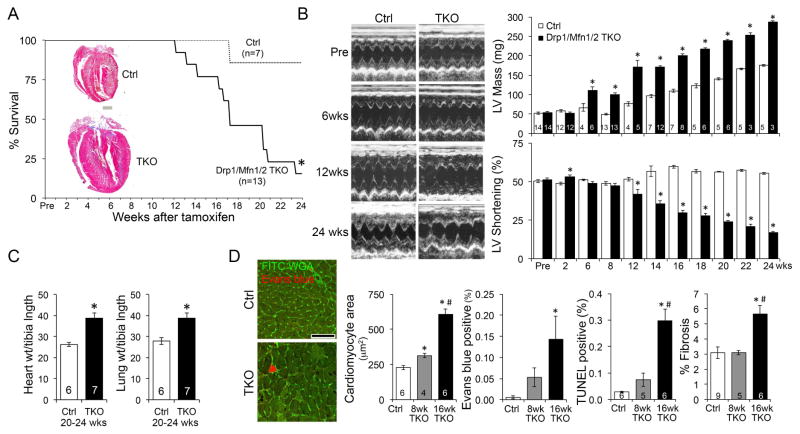
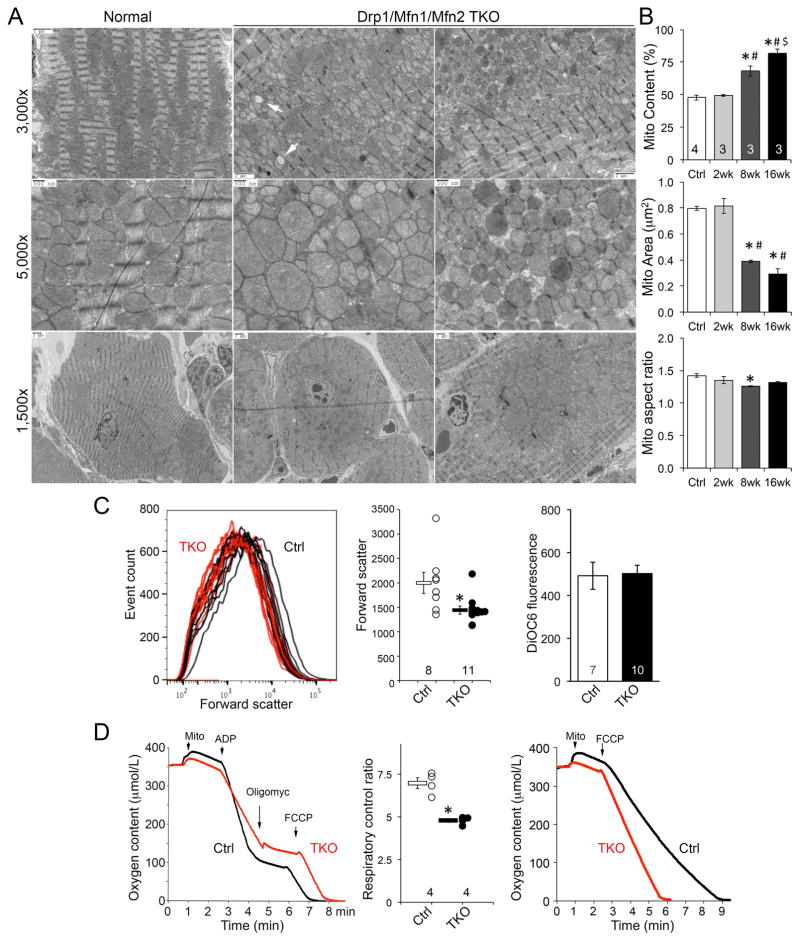
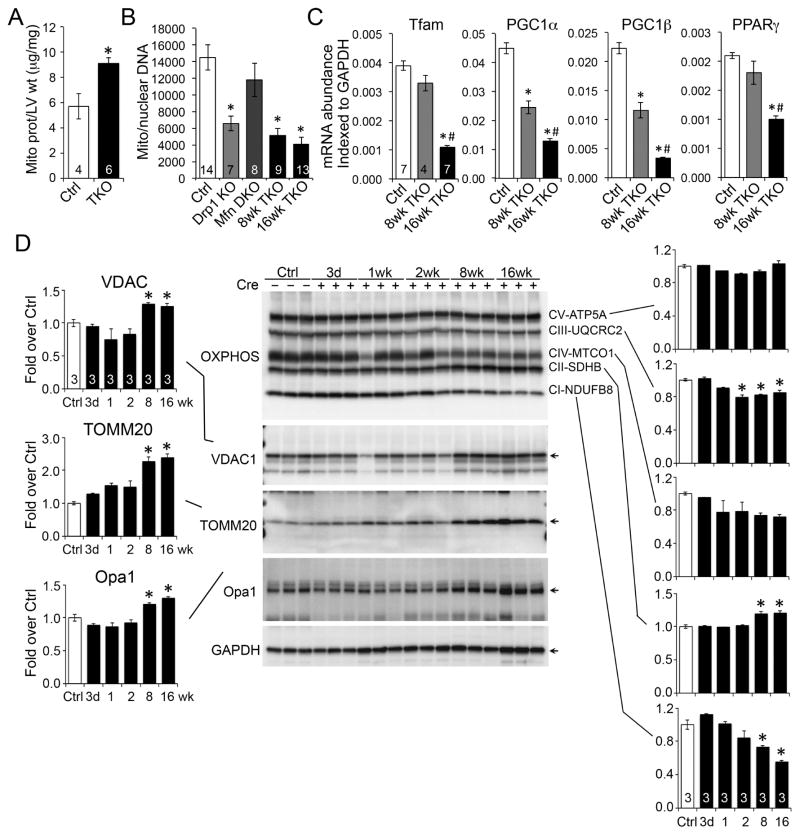
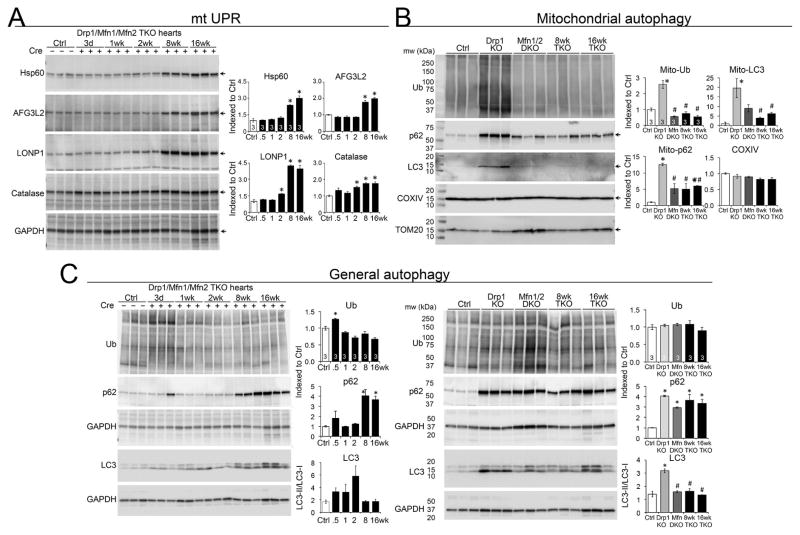
Mitochondrial fusion and fission are critical to heart health; genetically interrupting either is rapidly lethal. To understand whether it is loss of, or the imbalance between, fusion and fission that underlies observed cardiac phenotypes, we engineered mice in which Mfn-mediated fusion and Drp1-mediated fission could be concomitantly abolished. Compared to fusion-defective Mfn1/Mfn2 cardiac knockout or fission-defective Drp1 cardiac knockout mice, Mfn1/Mfn2/Drp1 cardiac triple-knockout mice survived longer and manifested a unique pathological form of cardiac hypertrophy. Over time, however, combined abrogation of fission and fusion provoked massive progressive mitochondrial accumulation that severely distorted cardiomyocyte sarcomeric architecture. Mitochondrial biogenesis was not responsible for mitochondrial superabundance, whereas mitophagy was suppressed despite impaired mitochondrial proteostasis. Similar but milder defects were observed in aged hearts. Thus, cardiomyopathies linked to dynamic imbalance between fission and fusion are temporarily mitigated by forced mitochondrial adynamism at the cost of compromising mitochondrial quantity control and accelerating mitochondrial senescence.

Keywords: cardiomyopathies; mice; mitochondria; mitochondrial accumulation; mitochondrial dynamics; mitochondrial fission; mitochondrial fusion; mitochondrial quantity control; mitochondrial senescence.


Figures

Figure 1
Figure 1. Mitochondrial fragmentation induced by Drp1 is not deleterious to mouse hearts
(A) Schematic depiction of bi-transgenic system used to target human (h) Drp1 expression to mouse cardiac myocytes. (B) Immunoblot analysis of Drp1 (top) and GAPDH (bottom) expression in rTA transgenic control (Ctrl) and 25-fold overexpressing transgenic (TG) littermate mouse hearts. Each lane is a separate heart. Odd lane numbers are males; even lanes are females. To the right are immunoblots of other mitochondrial dynamics proteins. Mff is mitochondrial fission factor. GAPDH is loading control. (C) Representative Masson’s trichrome stained hearts from 50 (top) and 93 (bottom) week old mice. Scale bar is 5 mm. (D) Gravimetric heart weights indexed to body weight in aging mice (non-significant by t-test). (E) Echocardiographic studies. (Left) Representative m-mode echos of 35 week old mice. (Right) Quantitative group data; LV EDD is left ventricular end diastolic dimension. (F) Representative transmission electron micrographs showing mitochondrial fragmentation in Drp1 TG heart (lower panel). Quantitative data are means±SEM. Both white bars are controls, representing each of the pair of transgenes in the bi-transgenic system. NS is non-significant (ANOVA). (G) Representative cardiac mitochondria respiration studies stimulated by glutamate/malate. Inset is quantitative group data for respiratory control ratio (state 3/state 2) (non-significant by t-test). See also Figure S1.
Figure 2
Figure 2. Abrogation of mitochondrial dynamism in cultured MEFs
(A) Immunoblot analysis showing depletion of Mfn1, Mfn2 and Drp1 after adeno-Cre induced simultaneous recombination of their respective floxed genes. (B) Live-dead studies 4 days after Cre-mediated Mfn1/Mfn2/Drp1 deletion. Controls (Pre) are Mfn1/Mfn2/Drp1 triple floxed MEFs without adeno-Cre. Means±SEM, n shown in bars. (C) Confocal analysis of mitochondrial aspect ratio (long/short axis) and polarization states (TMRE positivity) 4 days after Cre-mediated Mfn1/Mfn2/Drp1 deletion. * is p<0.05 vs Pre (ANOVA). (D) Mitochondrial accumulation of mcParkin at baseline and after uncoupling with FCCP 4 days after Cre-mediated Mfn1/Mfn2/Drp1 deletion. * is p<0.05 vs baseline Pre-Cre treatment; # is p<0.05 vs FCCP treated Pre (ANOVA). (E) Lysosomal-mitochondrial overlay at baseline and upon uncoupling with FCCP 4 days after Cre-mediated Mfn1/Mfn2/Drp1 deletion. * is p<0.05 vs baseline Pre; # is p<0.05 vs FCCP-treated Pre (ANOVA). (F) Rates of mitochondrial engulfment by lysosomes measured by red shift of adenoviral expressed mito-Keima at increasing times after Cre-mediated deletion of Drp1 alone (open circles; Drp1 floxed), Mfn1 and Mfn2 in combination (grey triangles; Mfn1/Mfn2 floxed) or Mfn1, Mfn2, and Drp1 in combination (black squares; Drp1/Mfn1/Mfn2 floxed). See also Figure S2.
Figure 3
Figure 3. Abrogation of mitochondrial dynamism in adult mouse hearts
(A) Gene recombination design using tamoxifen-inducible cardiomyocyte-directed Cre. (B) Immunoblot analysis of Mfn1, Mfn2 and Drp1 levels after Cre-mediated gene recombination in 8 wk old mouse hearts. * is p<0.05 vs no Cre Ctrl (ANOVA). (C) Early lethality of cardiac Drp1 knockout (KO), Mfn1/Mfn2 double KO (DKO) delayed by Drp1/Mfn1/Mfn2 triple gene ablation. * is p<0.05 vs no Cre Ctrl; # is p<0.05 vs Mfn1/Mfn2/Drp1 TKO (Log-rank). (D) Representative Masson’s trichrome stained TKO mouse hearts 16 weeks after combined Mfn1/Mfn2/Drp1 gene deletion. Hearts of parent lines 6 weeks after gene recombination are shown to the right. Scale is 5 mm. (E) Gravimetric heart weight (16 wks) indexed to body weight. * is p<0.05 vs Ctrl (t-test). (F) RT-qPCR of cardiac hypertrophy genes. * is p<0.05 vs Ctrl; # is p<0.05 vs 8wk TKO (ANOVA).
Figure 4
Figure 4. Long-term evolution of adynamic mitochondrial cardiac phenotype
(A) Extended survival curve of cardiac Drp1/Mfn1/Mfn2 TKO mice after tamoxifen-induced gene ablation. * is p<0.05 vs no Cre Ctrl (Log-rank). Inset is representative hearts from mice that survived 24 weeks; scale is 1 mm. (B) Echocardiography of Mfn1/Mfn2/Drp1 TKO hearts. Representative m-mode tracing are on the left. Group quantitative data for calculated left ventricular (LV) mass and % shortening of surviving mice are to the right. * is p<0.05 vs same time Ctrl (t-test). (C) Heart and lung weights indexed to tibial length. * is p<0.05 vs same time Ctrl (t-test). (D) Histological studies. Left, wheat germ agglutinin (WGA, green) staining and Evan’s blue (red) staining. Middle, quantitative group data for cardiomyocyte cross-sectional area (CSA). Group data for necrotic Evan’s blue stained cells, apoptotic TUNEL-positive cells, and cardiac fibrosis are to the right. Data are mean±SEM of indicated numbers; * is p<0.05 vs Ctrl; # is p<0.05 vs 8wk TKO (ANOVA).
Figure 5
Figure 5. Structural and functional characteristics of adynamic cardiomyocyte mitochondria
(A) Representative transmission electron micrographs of one normal Ctrl and two different Mfn1/Mfn2/Drp1 TKO mouse hearts. Note heterogeneity in mitochondrial size and occasional “ghost” mitochondrial (white arrows). Perinuclear mitochondrial accumulation peripherally displacing sarcomeres is evident in lowest magnifications of TKO hearts. (B) Quantitative analyses of mitochondrial abundance and morphometry. Means±SEM; * is p<0.05 vs Ctrl; # is p<0.05 vs 2 wk; $ is p<0.05 vs 8 wk TKO (ANOVA). (C) Flow cytometric analyses of isolated cardiac mitochondria. Left and middle, mitochondrial size measured by forward scatter. Right, quantitative data for mitochondrial polarization measured by DiOC6. * is p<0.05 vs Ctrl (t-test). (D) Glutamate/malate-stimulated mitochondrial respiration; representative curves are to the left and group data are in the middle. * is p<0.05 vs Ctrl (t-test). Right, FCCP-stimulated maximal mitochondrial oxygen consumption. See also Figure S3.
Figure 6
Figure 6. Mitochondrial abundance and protein content after abrogation of dynamism
(A) Mitochondrial protein/ventricular mass. * is p<0.05 vs Ctrl (t-test). (B) qPCR of mitochondrial DNA/nuclear DNA. * is p<0.05 vs Ctrl (ANOVA). (C) RT-qPCR of mitochondrial biogenesis factors. * is p<0.05 vs Ctrl; # is p<0.05 vs 8wk TKO (ANOVA). (D) Quantitative immunoblot analysis of mitochondrial outer membrane (left) and inner membrane respiratory complex (right) proteins. * is p<0.05 vs Ctrl (ANOVA).
Figure 7
Figure 7. Impaired proteostasis and altered mitophagy in Mfn1/Mfn2/Drp1 TKO mouse hearts
(A) Induction of the mitochondrial unfolded protein response. Samples are myocardial homogenates; GAPDH is loading control. * is p<0.05 vs Ctrl (ANOVA). (B) Mitophagy proteins in cardiac mitochondrial fractions. TOM20 is loading control. * is p<0.05 vs Ctrl; # is p<0.05 vs Drp1 KO (ANOVA). (C) Macroautophagy proteins in myocardial homogenates. GAPDH is loading control. * is p<0.05 vs Ctrl (ANOVA). Bottom GAPDH is loading control for LC3 blots. See also Figures S4 and S5.

References

    1. Bernhardt D, Muller M, Reichert AS, Osiewacz HD. Simultaneous impairment of mitochondrial fission and fusion reduces mitophagy and shortens replicative lifespan. Sci Rep. 2015;5:7885. - PMC - PubMed
    1. Cassidy-Stone A, Chipuk JE, Ingerman E, Song C, Yoo C, Kuwana T, Kurth MJ, Shaw JT, Hinshaw JE, Green DR, et al. Chemical inhibition of the mitochondrial division dynamin reveals its role in Bax/Bak-dependent mitochondrial outer membrane permeabilization. Dev Cell. 2008;14:193–204. - PMC - PubMed
    1. Chaudhary KR, El-Sikhry H, Seubert JM. Mitochondria and the aging heart. J Geriatr Cardiol. 2011;8:159–167. - PMC - PubMed
    1. Chen H, Detmer SA, Ewald AJ, Griffin EE, Fraser SE, Chan DC. Mitofusins Mfn1 and Mfn2 coordinately regulate mitochondrial fusion and are essential for embryonic development. J Cell Biol. 2003;160:189–200. - PMC - PubMed
    1. Chen H, McCaffery JM, Chan DC. Mitochondrial fusion protects against neurodegeneration in the cerebellum. Cell. 2007;130:548–562. - PubMed

LinkOut - more resources