. 2017 Dec 5;26(6):856-871.e5.
doi: 10.1016/j.cmet.2017.09.020. Epub 2017 Oct 26.

System-wide Benefits of Intermeal Fasting by Autophagy

Affiliations

System-wide Benefits of Intermeal Fasting by Autophagy

Nuria Martinez-Lopez et al. Cell Metab. .

Abstract

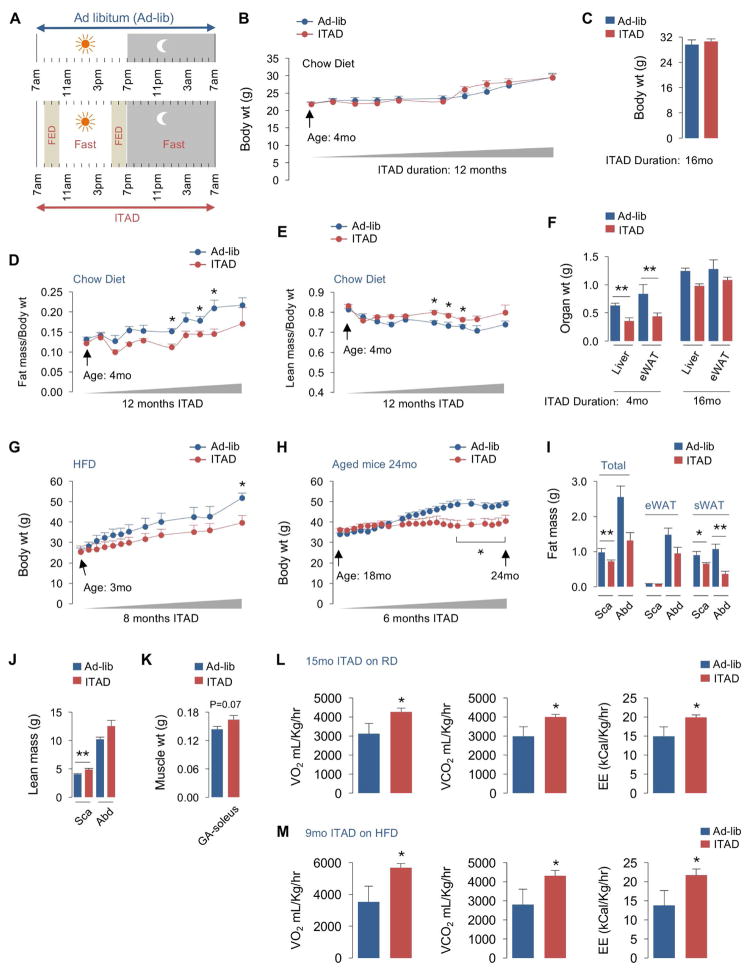
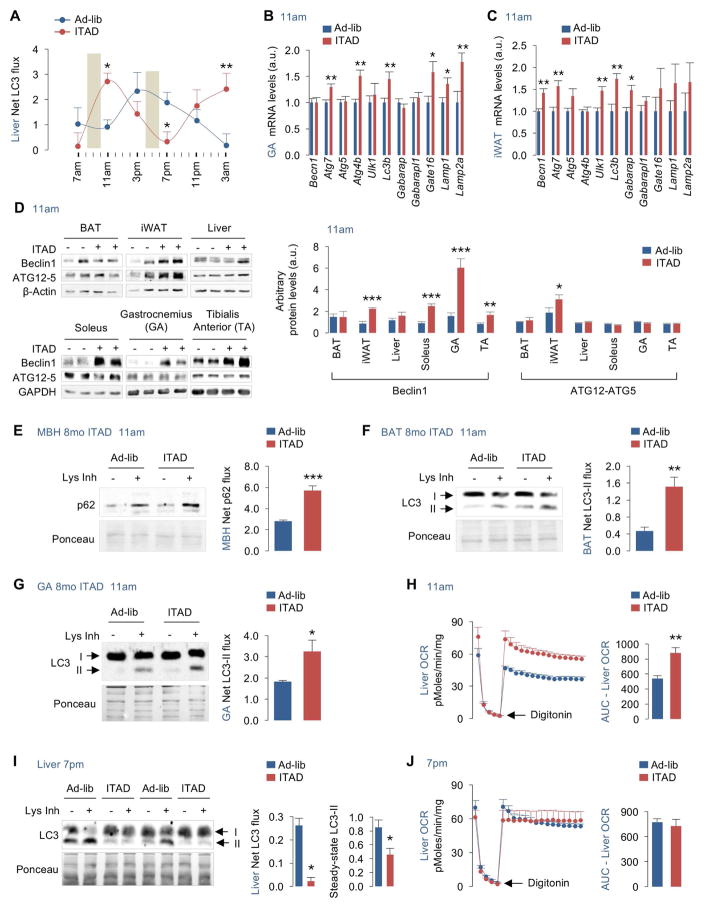
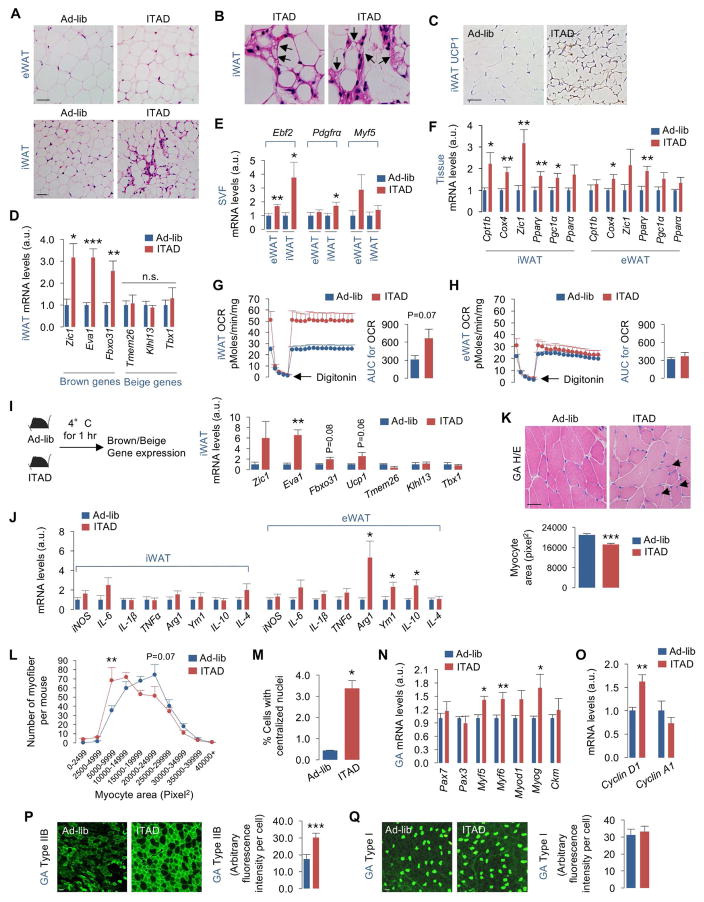
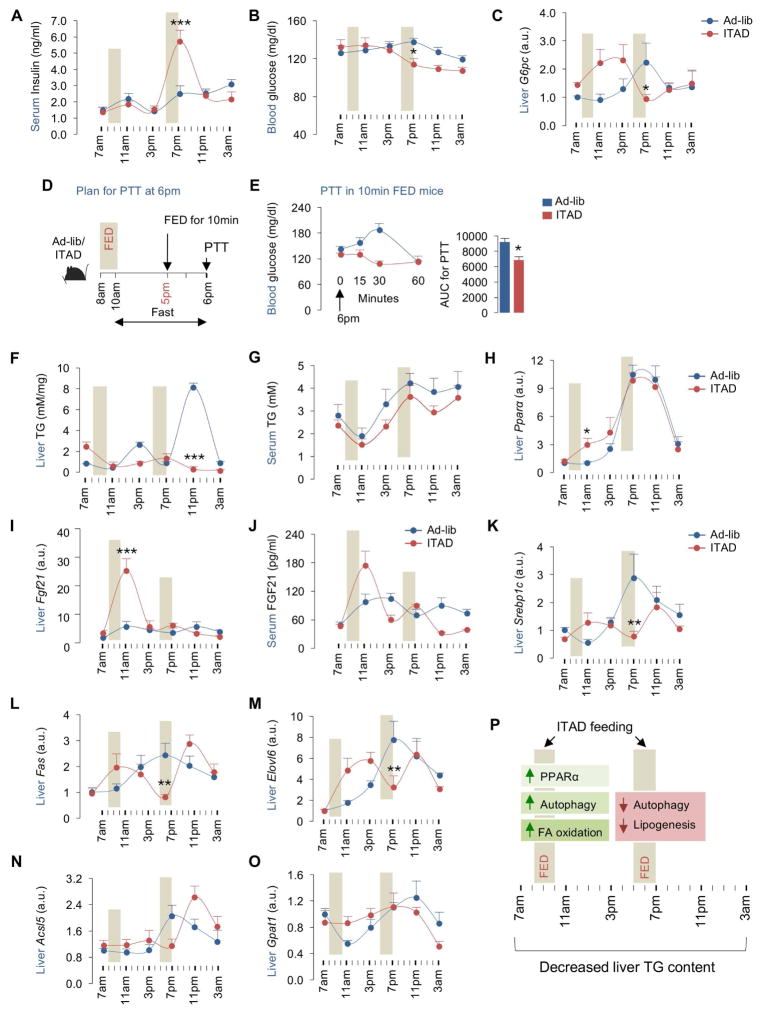
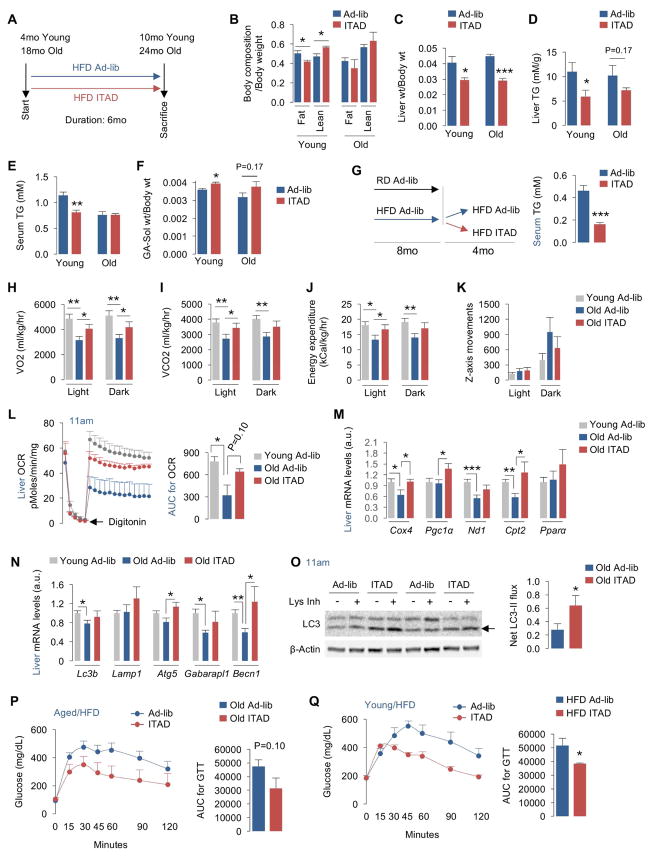
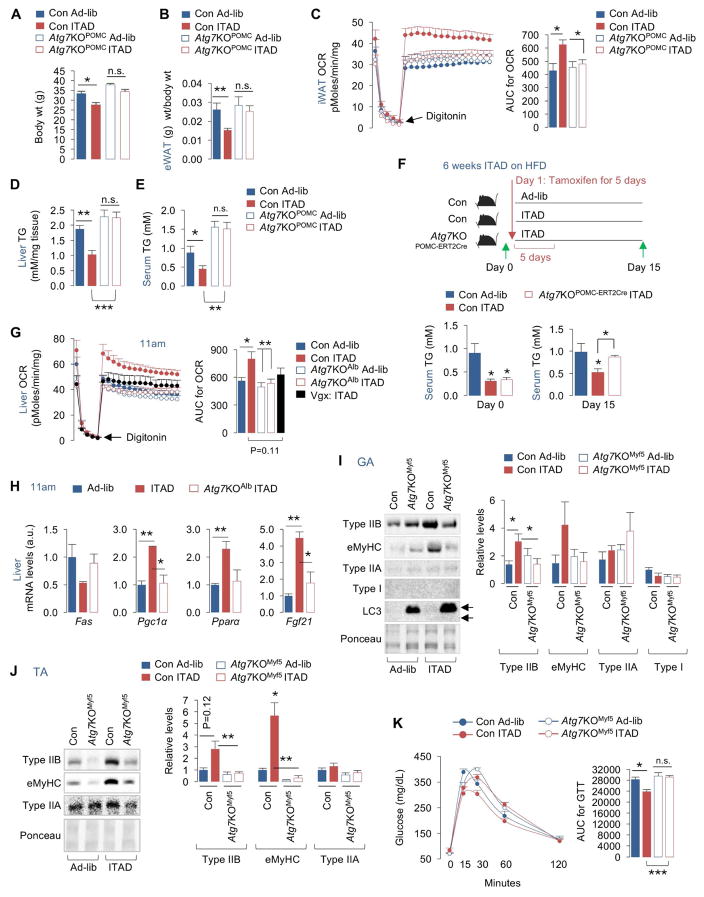
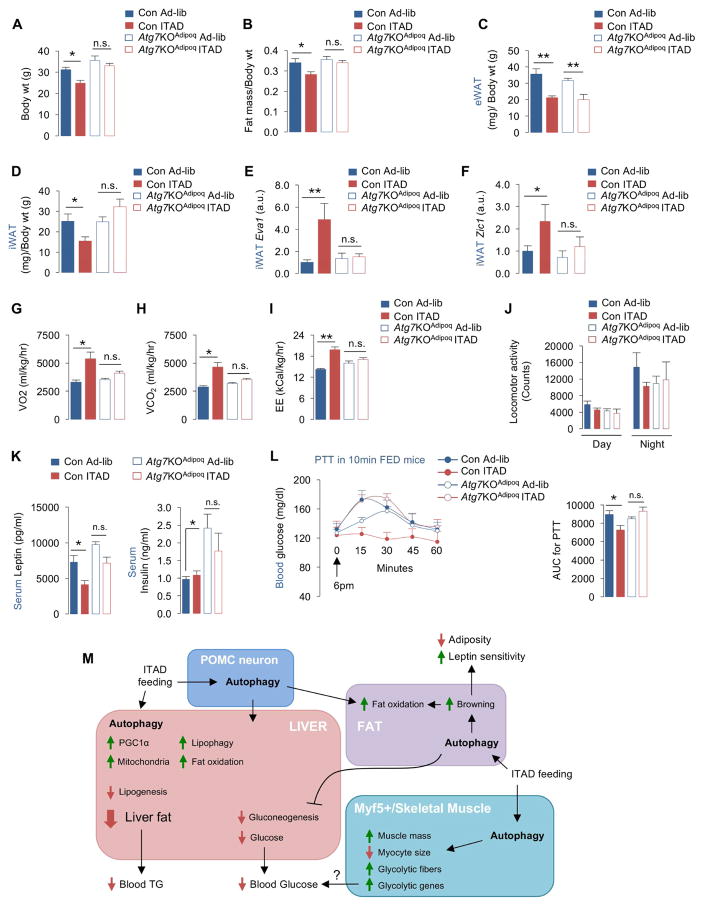
Autophagy failure is associated with metabolic insufficiency. Although caloric restriction (CR) extends healthspan, its adherence in humans is poor. We established an isocaloric twice-a-day (ITAD) feeding model wherein ITAD-fed mice consume the same food amount as ad libitum controls but at two short windows early and late in the diurnal cycle. We hypothesized that ITAD feeding will provide two intervals of intermeal fasting per circadian period and induce autophagy. We show that ITAD feeding modifies circadian autophagy and glucose/lipid metabolism that correlate with feeding-driven changes in circulating insulin. ITAD feeding decreases adiposity and, unlike CR, enhances muscle mass. ITAD feeding drives energy expenditure, lowers lipid levels, suppresses gluconeogenesis, and prevents age/obesity-associated metabolic defects. Using liver-, adipose-, myogenic-, and proopiomelanocortin neuron-specific autophagy-null mice, we mapped the contribution of tissue-specific autophagy to system-wide benefits of ITAD feeding. Our studies suggest that consuming two meals a day without CR could prevent the metabolic syndrome.

Keywords: POMC; aging; autophagy; caloric restriction; circadian; fatty liver; gluconeogenesis; metabolic syndrome; myogenic progenitors; twice-a-day feeding.


Figures

Fig. 1
Fig. 1. ITAD feeding influences body composition and energy expenditure
(A) The isocaloric twice-a-day feeding (ITAD) strategy wherein test mice feed between 8–10am and between 5–7pm the same amount of food that ad libitum (Ad-lib)-fed controls (Con) eat in 24 hr. (B–C) Body weight (wt), (D–E) body composition, and (F) tissue wt at indicated intervals in regular chow diet (RD)-fed male mice subjected to Ad-lib or ITAD feeding for indicated duration (n=5). (G) Body wt of young, and (H) aged male mice fed Ad-lib or ITAD on high fat diet (HFD) for indicated durations (n=5). (I) CT for total fat or fat distributed in epididymal (eWAT) or subcutaneous (sWAT) pads, and (J) CT for lean mass in scapular (Sca) and abdominal (Abd) planes in Ad-lib or ITAD-fed male mice on RD for 12 months (mo) (n=5). (K) Gastrocnemius (GA) and soleus muscle wt in RD-fed male mice on Ad-lib or ITAD for 12mo (n=5). (L) VO2, VCO2, and EE rates in male mice fed Ad-lib or ITAD on RD or (M) HFD for indicated duration (n=5). Bars are mean ± SEM. (*P<0.05, **P<0.01), Student’s t test or Two-Factor ANOVA and Bonferroni correction. See also Figure S1.
Fig. 2
Fig. 2. ITAD feeding impacts autophagy flux
(A) Net LC3-II flux across 24 hr in liver explants from male mice in presence or absence of lysosomal inhibitors (Lys Inh) from RD-fed mice on Ad-lib or ITAD feeding for 8–10mo. Representative blots shown in Fig. S2A (n=6). (B–C) qPCR for indicated autophagy and lysosomal genes in gastrocnemius (GA) and iWAT (n=8), and (D) immunoblots (IB) for Beclin1 and ATG12-ATG5 conjugate in indicated tissues harvested at 11am from RD-fed male (n=4) and female mice (n=4) on Ad-lib or ITAD feeding for 4mo (total n=8). Densitometry values (D, right) are shown. (E–G) IB for p62 or LC3 depicting autophagy flux in explants from MBH (mediobasal hypothalamus), BAT and GA treated (+) or not (−) with Lys Inh from RD-fed male (n=4) and female mice (n=4) on Ad-lib or ITAD for 8mo (total n=8). Quantifications for net p62 or LC3-II flux are shown. (H) Oxygen consumption rates (OCR) in livers at 11am, (I) IB for LC3 in livers at 7pm and treated (+) or not (−) with Lys Inh for 2 hr, and (J) OCR in livers at 7pm from RD-fed male mice on Ad-lib or ITAD for 10mo, n=3. Quantification for net LC3-II flux and steady-state LC3-II are shown. Bars are mean ± SEM. (*P<0.05, **P<0.01, ***P<0.001). Student’s t test or Two-Factor ANOVA and Bonferroni correction. See also Figure S2.
Fig. 3
Fig. 3. ITAD feeding remodels adipose tissue and skeletal muscle
(A–B) Hematoxylin and eosin (H/E)-stained fat tissues (arrows show multiloculated adipocytes), and (C) UCP1 positivity in iWAT from RD-fed male mice on Ad-lib or ITAD feeding for 4mo (n=3). (D) qPCR for brown and beige genes, (E) adipocyte/myogenic progenitor genes in stromal vascular fractions (SVF), and (F) mitochondrial genes from male (n=4) and female (n=4) mice (total n=8), (G–H) OCR and AUC (area under curve) in iWAT and/or eWAT (n=3) from RD-fed male mice on Ad-lib or ITAD for 12mo. (I) Experimental plan, and qPCR of brown and beige genes in iWAT from RD-fed male mice on Ad-lib or ITAD for 12mo and then exposed to 4°C for 1 hr (n=3). (J) Immune markers in iWAT and eWAT from RD-fed male (n=4) and female mice (n=4) on Ad-lib or ITAD for 12mo (total n=8). (K) H/E stains and quantification for myocyte area, and (L) distribution of myocytes by area (pixel2), and (M) percentage of myofibers with centralized nuclei in GA from RD-fed male mice on Ad-lib or ITAD for 10mo (n=4). Arrows in 3K indicate centralized nuclei. (N) Myogenic genes (n=10), and (O) cell cycle genes in GA from RD-fed male mice on Ad-lib or ITAD for 6mo (n=8). (P, Q) Immunofluorescence (IF) of type IIB, and type I fibers in GA from RD-fed male mice on Ad-lib or ITAD for 10mo (n=4). Bars are mean ± SEM. (*P<0.05, **P<0.01, ***P<0.001), Student’s t test or Two-Factor ANOVA and Bonferroni correction. Scale: 50μm. See also Figure S3.
Fig. 4
Fig. 4. ITAD feeding and glucose and fat metabolism in liver
(A) Serum insulin (n=8), (B) blood glucose levels (n=14), (C) gluconeogenic gene Pck1 in liver at indicated time-points (n=8), (D–E) pyruvate tolerance test (PTT) at 6pm in Ad-lib and ITAD mice fed for 10min at 5pm (n=4), (F, G) liver and serum TG (n=8), (H, I) qPCR for Pparα and Fgf21 genes in liver (n=8), (J) serum FGF21 levels (n=3), and (K–O) qPCR for indicated lipogenic genes at indicated time-points in RD-fed male mice on Ad-lib or ITAD for 10mo (n=8). (P) Summary of effects of ITAD feeding on hepatic lipid metabolism across 24 hr. Bars are mean ± SEM. (*P<0.05, **P<0.01, ***P<0.001). Student’s t test or Two-Factor ANOVA and Bonferroni correction. See also Figure S4.
Fig. 5
Fig. 5. ITAD feeding prevents age-associated metabolic defects
(A) ITAD feeding in young and aged male mice fed HFD for 6mo. (B, C) Body composition and liver wt normalized to body wt, (D, E) liver/serum TG, and (F) GA-Soleus (Sol) wt normalized to body wt in 10mo and 24mo male mice as in (A) (n=3–4). (G) Young mice fed HFD Ad-lib for 8mo and then ITAD-fed or not for 4mo, and serum TG after 4mo of ITAD feeding (n=5). (H–K) VO2, VCO2, EE rates, and Z-axis movements in young/aged male mice fed Ad-lib on HFD or ITAD-fed on HFD for 6mo, n=3–4. (L) Liver OCR and AUC for OCR (n=3–4), (M, N) liver qPCR analyses for mitochondrial and autophagy-related genes (n=8), and (O) net LC3-II flux in liver explants cultured in presence (+) or absence (−) of Lys Inh in aged male mice (n=8). (P, Q) Glucose tolerance tests (GTT) and AUC in HFD-fed aged and young male mice on Ad-lib or ITAD feeding for 6mo (n=6). Bars are mean ± SEM. (*P<0.05, **P<0.01, ***P<0.001). Student’s t test. See also Figure S4.
Fig. 6
Fig. 6. Tissue-specific autophagy contributes to distinct benefits of ITAD feeding
(A) Body wt of HFD-fed Ad-lib and ITAD-fed Con and Atg7KOPOMC male mice for 4mo (n=5). (B) eWAT wt normalized to body wt in males (n=6), (C) iWAT OCR and AUC for OCR in male (n=3) and female (n=3) mice (total n=6), (D) liver TG in males (n=7) and females (n=5) (total n=12), and (E) serum TG in HFD-fed Con and Atg7KOPOMC male (n=3) and female mice (n=3) fed Ad-lib or ITAD for 4mo (total n=6). (F) Serum TG on day 0 and day 15 (as indicated) in control and Atg7KOPOMC-ERT2-Cre male mice fed Ad-lib or ITAD on HFD for 6 weeks and subjected to tamoxifen injections for 5 days (n=6). (G) Liver OCR and AUC from Con and Atg7KOAlb mice fed Ad-lib or ITAD on RD for 6mo, and in male mice subjected to vagotomy (Vgx) and ITAD feeding on RD for 6mo (n=3–5). (H) Liver qPCR analyses for indicated genes from RD-fed Ad-lib, and ITAD-fed Con and Atg7KOAlb male mice for 6mo (n=3). (I) IB for indicated proteins in GA, (J) TA, and (K) GTT in RD-fed Con and Atg7KOMyf5 male (n=3) and female mice (n=3) fed Ad-lib and ITAD for 6mo (total n=6). Ponceau is loading control. Bars are mean ± SEM. (*P<0.05, **P<0.01, ***P<0.001). Student’s t test or Two-Factor ANOVA and Bonferroni correction. See also Figure S6.
Fig. 7
Fig. 7. Autophagy is required for iWAT browning in ITAD-fed mice
(A) Body wt, (B–D) fat mass, eWAT wt, and iWAT wt normalized to body wt in Con and Atg7KOAdipoq male (n=3) and female mice (n=3) subjected to Ad-lib or ITAD feeding on HFD for 4mo (total n=6). (E, F) qPCR for Beige genes Eva1 and Zic1 in iWAT from Con and Atg7KOAdipoq male and female mice subjected to Ad-lib or ITAD feeding on HFD for 4mo (n=6). (G–J) VO2, VCO2, EE rates, and locomotor activity in Con and Atg7KOAdipoq male and female mice subjected to Ad-lib or ITAD feeding on HFD for 4mo (n=6). (K) Serum leptin and insulin levels in Con and Atg7KOAdipoq male and female mice subjected to Ad-lib or ITAD feeding on HFD for 4mo (n=6). (L) PTT and AUC for PTT at 6pm in Ad-lib and ITAD-fed Con and Atg7KOAdipoq male and female mice fed for 10min at 5pm (n=6). (M) Proposed model for contribution of tissue-specific autophagy to metabolic benefits of ITAD feeding. Bars are mean ± SEM. (*P<0.05, **P<0.01). Two-Factor ANOVA and Bonferroni correction. See also Figure S7.

Comment in

References

    1. Anson RM, Guo Z, de Cabo R, Iyun T, Rios M, Hagepanos A, Ingram DK, Lane MA, Mattson MP. Intermittent fasting dissociates beneficial effects of dietary restriction on glucose metabolism and neuronal resistance to injury from calorie intake. Proceedings of the National Academy of Sciences of the United States of America. 2003;100:6216–6220. - PMC - PubMed
    1. Badman MK, Pissios P, Kennedy AR, Koukos G, Flier JS, Maratos-Flier E. Hepatic fibroblast growth factor 21 is regulated by PPARalpha and is a key mediator of hepatic lipid metabolism in ketotic states. Cell metabolism. 2007;5:426–437. - PubMed
    1. Bass J, Takahashi JS. Circadian integration of metabolism and energetics. Science. 2010;330:1349–1354. - PMC - PubMed
    1. Berglund ED, Liu C, Sohn JW, Liu T, Kim MH, Lee CE, Vianna CR, Williams KW, Xu Y, Elmquist JK. Serotonin 2C receptors in pro-opiomelanocortin neurons regulate energy and glucose homeostasis. J Clin Invest. 2013;123:5061–5070. - PMC - PubMed
    1. Berry R, Rodeheffer MS. Characterization of the adipocyte cellular lineage in vivo. Nature cell biology. 2013;15:302–308. - PMC - PubMed

LinkOut - more resources