. 2017 Dec 5;26(6):884-896.e5.
doi: 10.1016/j.cmet.2017.09.024. Epub 2017 Oct 26.

Dietary Restriction and AMPK Increase Lifespan via Mitochondrial Network and Peroxisome Remodeling

Affiliations

Dietary Restriction and AMPK Increase Lifespan via Mitochondrial Network and Peroxisome Remodeling

Heather J Weir et al. Cell Metab. .

Abstract

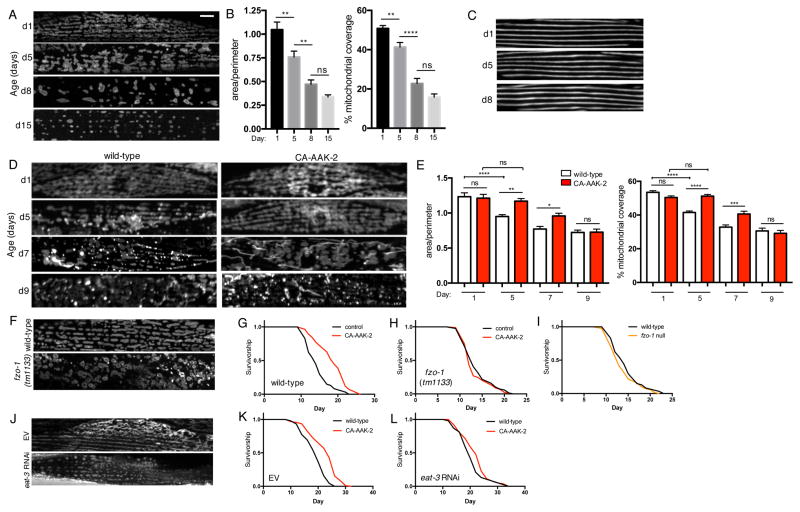
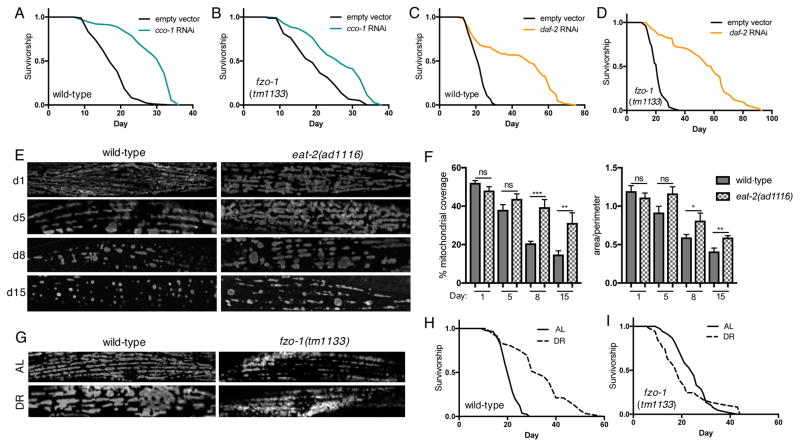
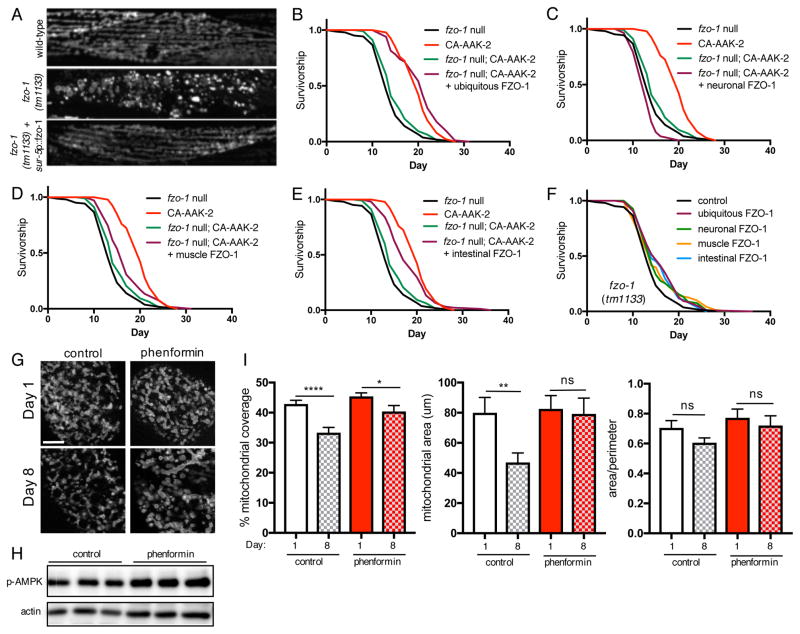
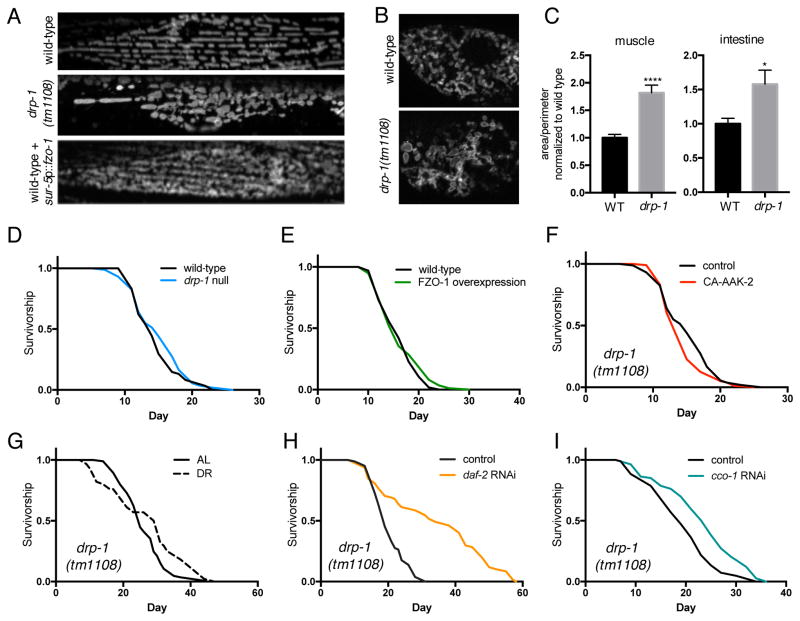
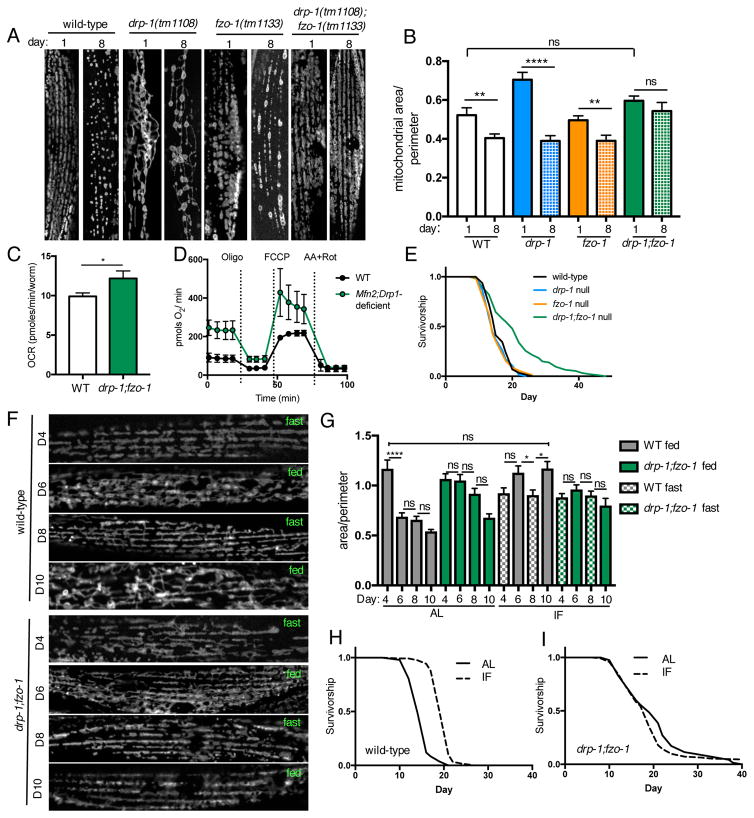
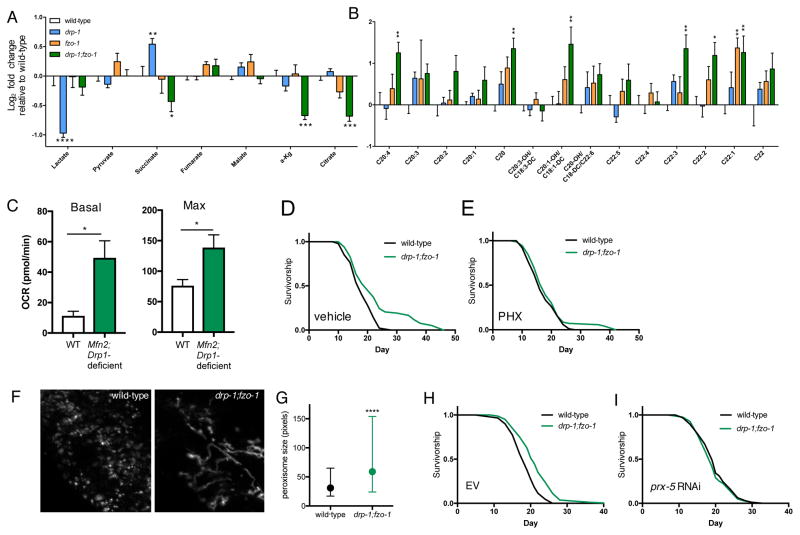
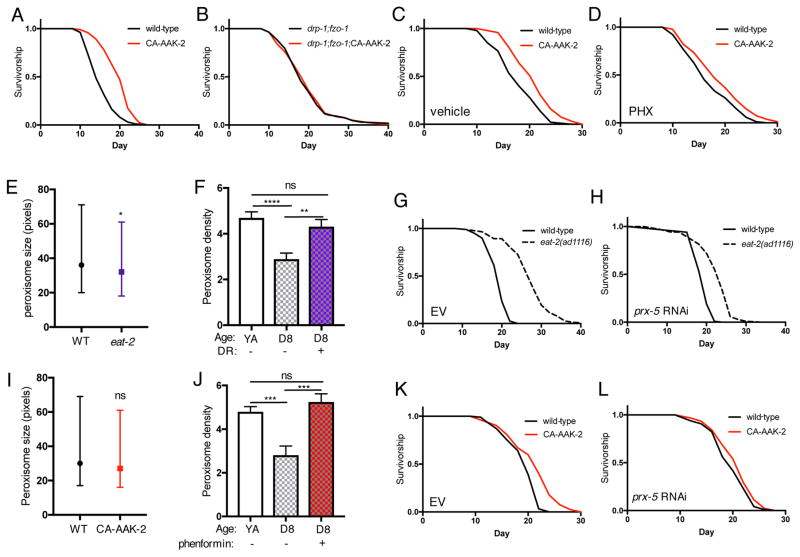
Mitochondrial network remodeling between fused and fragmented states facilitates mitophagy, interaction with other organelles, and metabolic flexibility. Aging is associated with a loss of mitochondrial network homeostasis, but cellular processes causally linking these changes to organismal senescence remain unclear. Here, we show that AMP-activated protein kinase (AMPK) and dietary restriction (DR) promote longevity in C. elegans via maintaining mitochondrial network homeostasis and functional coordination with peroxisomes to increase fatty acid oxidation (FAO). Inhibiting fusion or fission specifically blocks AMPK- and DR-mediated longevity. Strikingly, however, preserving mitochondrial network homeostasis during aging by co-inhibition of fusion and fission is sufficient itself to increase lifespan, while dynamic network remodeling is required for intermittent fasting-mediated longevity. Finally, we show that increasing lifespan via maintaining mitochondrial network homeostasis requires FAO and peroxisomal function. Together, these data demonstrate that mechanisms that promote mitochondrial homeostasis and plasticity can be targeted to promote healthy aging.

Keywords: AMPK; aging; dietary restriction; fatty acid oxidation; intermittent fasting; longevity; mitochondrial dynamics; peroxisomes.


Figures

Figure 1
Figure 1. AMPK maintains youthful mitochondrial morphology with age and requires fusion to increase lifespan
(A) Fluorescence images of mitochondrial networks in worm body wall muscle cells on day 1, 5, 8 and 15 of adulthood, visualized with outer mitochondrial membrane-targeted GFP (myo-3p::tomm20(1-49aa)::gfp). Scale bar = 20μm. (B) Quantification of (A): Mean ± SEM of n=21–26 muscle cells from different worms, pooled from 2 independent experiments. **p<0.01, ****p<0.0001 by one-way ANOVA with Tukey’s multiple comparisons test. (C) Body wall muscle fibers on day 1, 5 and 8, visualized with MYO-3::GFP. (D) Mitochondrial networks in muscle cells of wild-type worms and worms expressing CA-AAK-2 on day 1, 5, 7 and 9, visualized with outer mitochondrial membrane-targeted RFP (myo-3p::tomm20::mrfp). (E) Quantification of (D): Mitochondrial network area:perimeter ratio (left) and mitochondrial content (right, % mitochondrial coverage of cell area). Mean ± SEM of n=36–56 muscle cells from 3 independent experiments. *p<0.05, **p<0.01,***p<0.001, ****p<0.0001 by one-way ANOVA with Tukey’s multiple comparisons test. (F) Mitochondrial networks in muscle cells of wild-type (top) and fzo-1 null (bottom) worms on day 1. (G) and (H) Survival curves demonstrating that CA-AAK-2 extends lifespan in wild-type (G), but not fzo-1 mutant worms (H). (I) Survival curves of fzo-1 mutant and wild-type worms are not significantly different. (J) Mitochondrial networks from day 1 worms fed empty vector (EV) control or eat-3 RNAi. (K) and (L) Survival curves demonstrating that CA-AAK-2 extends lifespan on EV (K), but not eat-3 RNAi (L). See Table S1 for lifespan statistics.
Figure 2
Figure 2. Fusion is required for DR-mediated longevity
(A) and (B) cco-1 RNAi extends lifespan in wild-type (A) and fzo-1 mutants (B). (C) and (D) daf-2 RNAi extends lifespan in wild-type (C) and fzo-1 mutants (D). (E) Mitochondrial networks in wild-type and eat-2 mutant worms on day 1, 5, 8 and 15. (F) Quantification of (E): Mitochondrial content (left) and area:perimeter ratio (right). Mean ± SEM of n=8–13 muscle cells from different worms. *p<0.05, **p<0.01,***p<0.001 by t test. (G) Mitochondrial networks in day 4 worms fed ad libitum (AL, top panels) or diet-restricted (DR, bottom panels). DR for the first 4 days of adulthood induces mitochondrial network remodeling in wild-type worms, while networks remain fragmented in fzo-1 mutants. (H) and (I) Survival curves demonstrating that DR extends lifespan compared to AL controls in wild-type (H), but not in fzo-1 mutants (I). See Table S1 for lifespan statistics.
Figure 3
Figure 3. Fusion is required in peripheral tissues for AMPK-mediated longevity
(A) Mitochondrial networks in wild-type and fzo-1 mutant muscle cells on day 1. Ubiquitous rescue of fzo-1 (sur-5p::fzo-1) rescues the fragmented mitochondrial morphology in fzo-1 mutants (bottom panel). (B) Ubiquitous rescue of fzo-1 fully restores lifespan extension by CA-AAK-2 in fzo-1 mutants. (C)(E) Survival curves with tissue-specific rescue of fzo-1. Neuronal rescue of fzo-1 does not restore CA-AAK-2 lifespan extension (rab-3p::fzo-1, C), whereas muscle (myo-3p::fzo-1, D) or intestinal rescue (ges-1p::fzo-1, E) result in partial rescue. (F) Survival curves of fzo-1 mutants with ubiquitous or tissue-specific rescue of fzo-1. See Table S1 for lifespan statistics. (G) Mitochondrial networks in intestinal cells on day 1 and 8 with or without phenformin (4.5mM) treatment from L4 stage. Scale bar = 20μm. (H) p-AMPK levels are increased in wild-type worms treated with phenformin for 24h from L4. 3 biological replicates of lysates from 300–500 worms. (I) Quantification of (G): Mitochondrial content (left), size (middle) and area/perimeter ratio (right). Mean ± SEM of n=25–26 intestinal cells from 2 independent experiments. *p<0.05, **p<0.01,****p<0.0001 by t test.
Figure 4
Figure 4. Driving fusion does not increase lifespan
(A) Mitochondrial networks in muscle cells of wild-type, drp-1 mutant, and wild-type worms overexpressing fzo-1 (sur-5p::fzo-1) on day 1. (B) Mitochondrial networks in intestinal cells from wild-type and drp-1 mutants on day 1. (C) Mitochondrial area:perimeter ratio showing that mitochondrial networks are more connected in drp-1 mutants. Mean ± SEM of 8 muscle cells and 10 intestinal cells from different worms. *p<0.05, ****p<0.0001 by t test. Driving fusion by deletion of drp-1 (D) or overexpressing fzo-1 (E) has no effect on lifespan. Lifespan extension by CA-AAK-2 (F) and DR (G) is suppressed in drp-1 mutants. RNAi knockdown of daf-2 (H) and cco-1 (I) extend lifespan in drp-1 mutants. See Table S1 for lifespan statistics.
Figure 5
Figure 5. Maintaining mitochondrial network homeostasis is sufficient to increase lifespan under ad libitum fed but not intermittent fasting conditions
(A) Mitochondrial networks in muscle cells of wild-type, drp-1 mutant, fzo-1 mutant, and drp-1;fzo-1 double mutant worms on day 1 and 8. (B) Quantification of (A): drp-1;fzo-1 double mutants maintain connected mitochondrial networks with age. Mean ± SEM of n=11–18 muscle cells from different worms. **p<0.01, ****p<0.0001 by t test. See also Figure S2. (C) Basal oxygen consumption rate (OCR) is increased in old (day 11) drp-1;fzo-1 double mutant worms vs wild-type (WT). Mean ± SEM of 10 replicates, *p<0.05 by t test. (D) Raw averaged traces of oxygen consumption from WT and Mfn2;Drp1-deficient MEFs in the presence of 20mM galactose, 4mM pyruvate and 2mM glutamine. Mean ± SEM of n=3–5 independent experiments. See also Figure S2. (E) Survival curves demonstrating that drp-1;fzo-1 double mutant worms are long-lived. (F) Representative images showing that mitochondrial networks undergo remodeling in response intermittent fasting (IF) in wild-type but not drp-1;fzo-1 mutant worms. (G) Mitochondrial network area:perimeter ratio on day 4, 6, 8, and 10, from wild-type and drp-1;fzo-1 mutant worms fed ad libitum (AL) or with IF. Worms in the IF group were fasted from day 2–4 and day 6–8. Mean ± SEM of n=12–26 muscle cells from 2 independent experiments. *p<0.05, ****p<0.0001 by one-way ANOVA with Tukey’s multiple comparisons test. See also Figure S3. (H) and (I) Survival curves showing that IF extends lifespan of wild-type but not drp-1;fzo-1 mutant worms. See Table S1 for lifespan statistics.
Figure 6
Figure 6. Fatty acid oxidation and peroxisome function are required for drp-1;fzo-1-mediated longevity
(A) and (B) Metabolomic analyses of wild-type, drp-1 mutant, fzo-1 mutant, and drp-1;fzo-1 double mutant worms on day 1. Levels of organic acids (A) and very long-/long-chain acylcarnitines (B) are expressed as log2 fold change relative to wild-type levels. Mean ± SEM of 5–6 biological replicates. *p<0.05, **p<0.01, ***p<0.001, ****p<0.0001 by two-way ANOVA with Tukey’s multiple comparisons test. Statistics shown are relative to wild-type levels. See also Figure S4 for amino acids, short- and medium-chain acylcarnitines. (C) Basal and maximal oxygen consumption during palmitate oxidation showing total fatty acid oxidation (FAO) capacity is increased in Mfn2;Drp1-deficient MEFs. Palmitate-specific oxidation was obtained by taking the rate of palmitate oxidation in the absence of etomoxir and subtracting the rate in the presence of etomoxir (40μM), corrected for non-mitochondrial respiration rates. Mean ± SEM of n=3 replicates, *p<0.05 by t test. (D) and (E) Inhibiting FAO with perhexiline (PHX) suppresses drp-1;fzo-1-mediated longevity. (F) Fluorescence images of peroxisomes in L4 wild-type and drp-1;fzo-1 mutant worms, visualized with vha-6p::mRFP-PTS1. (G) Quantification of (H): Peroxisomes are larger in drp-1;fzo-1 mutant worms. Median and interquartile range of n=1261–4762 peroxisomes from 2 independent experiments. ****p<0.0001 by t test. (I) and (J) prx-5 RNAi suppresses drp-1;fzo-1-mediated longevity. See Table S1 for lifespan statistics.
Figure 7
Figure 7. AMPK- and DR-mediated longevity involves peroxisome function
(A) and (B) Survival curves showing that CA-AAK-2 has no additive effect on the lifespan of drp-1;fzo-1 double mutant worms. (C) and (D) Inhibiting fatty acid oxidation with PHX partially suppresses CA-AAK-2-mediated longevity. (E) Peroxisome size in YA wild-type and eat-2(ad1116) mutants. Median and interquartile range of n=2174–3187 peroxisomes, *p<0.05 by t test. (F) DR by bacterial dilution maintains peroxisome density (% cell coverage) with age. Mean ± SEM of n=18–25 worms. **p<0.01, ****p<0.0001 by one-way ANOVA with Tukey’s multiple comparisons test. (G) and (H) prx-5 RNAi reduces DR-mediated longevity. (I) CA-AAK-2 does not alter peroxisome size in young adult (YA) stage worms. Median and interquartile range of n=879–918 peroxisomes. (J) Phenformin treatment from YA stage maintains peroxisome density between YA and day 8. Mean ± SEM of n=11–35 worms. ***p<0.001 by one-way ANOVA with Tukey’s multiple comparisons test. (K) and (L) prx-5 RNAi suppresses CA-AAK-2-mediated longevity. See Table S1 for lifespan statistics.

Comment in

References

    1. Apfeld JG, O’connor TM. The AMP-activated protein kinase AAK-2 links energy levels and insulin-like signals to lifespan in C. elegans. Genes Dev. 2004;18:3004–3009. - PMC - PubMed
    1. Bernhardt D, Muller M, Reichert A, Osiewacz H. Simultaneous impairment of mitochondrial fission and fusion reduces mitophagy and shortens replicative lifespan. Sci Rep. 2015;5:7885. - PMC - PubMed
    1. Bonda DJ, Smith MA, Perry G, Lee HG, Wang X, Zhu X. The mitochondrial dynamics of Alzheimer’s disease and Parkinson’s disease offer important opportunities for therapeutic intervention. Curr Pharm Des. 2011;17:3374–3380. - PMC - PubMed
    1. Burkewitz K, Morantte I, Weir H, Yeo R, Zhang Y, Huynh F, Ilkayeva O, Hirschey M, Grant A, Mair W. Neuronal CRTC-1 Governs Systemic Mitochondrial Metabolism and Lifespan via a Catecholamine Signal. Cell. 2015;160:842–855. - PMC - PubMed
    1. Cabreiro F, Au C, Leung KY, Vergara-Irigaray N, Cochemé HM, Noori T, Weinkove D, Schuster E, Greene NDE, Gems D. Metformin retards aging in C. elegans by altering microbial folate and methionine metabolism. Cell. 2013;153:228–239. - PMC - PubMed