. 2017 Nov 15;96(4):936-948.e3.
doi: 10.1016/j.neuron.2017.10.012. Epub 2017 Oct 26.

Entrainment of Arteriole Vasomotor Fluctuations by Neural Activity Is a Basis of Blood-Oxygenation-Level-Dependent "Resting-State" Connectivity

Affiliations

Entrainment of Arteriole Vasomotor Fluctuations by Neural Activity Is a Basis of Blood-Oxygenation-Level-Dependent "Resting-State" Connectivity

Celine Mateo et al. Neuron. .

Abstract

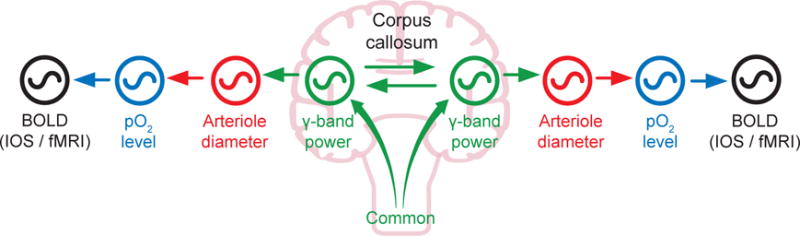
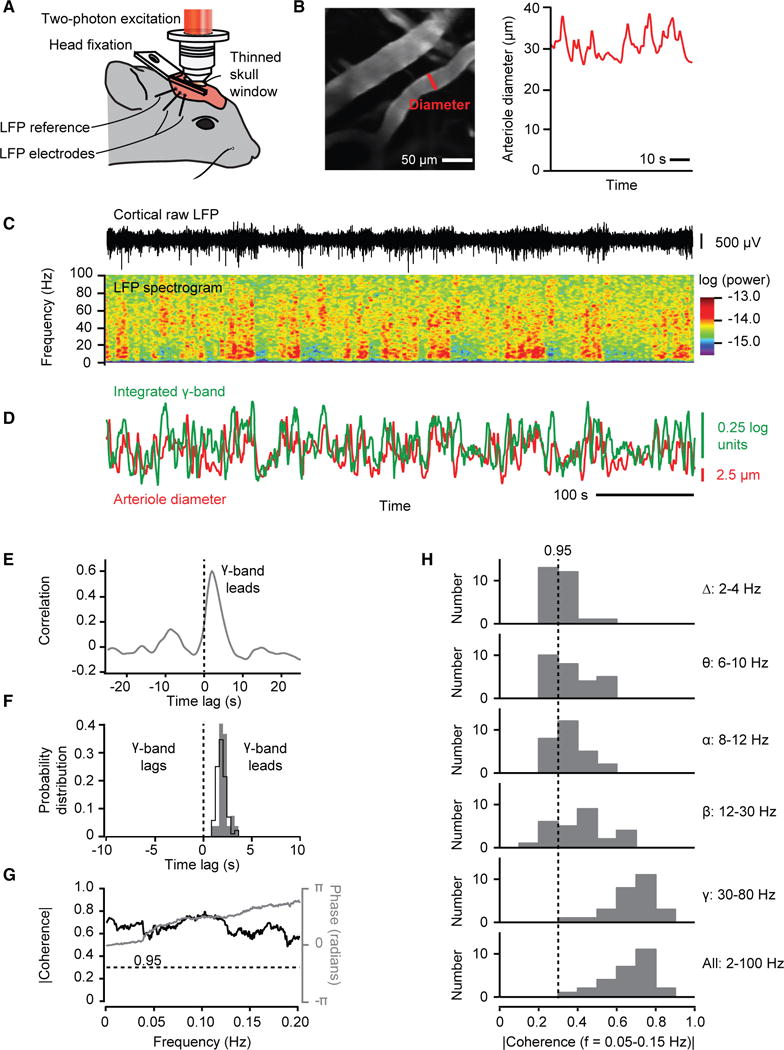
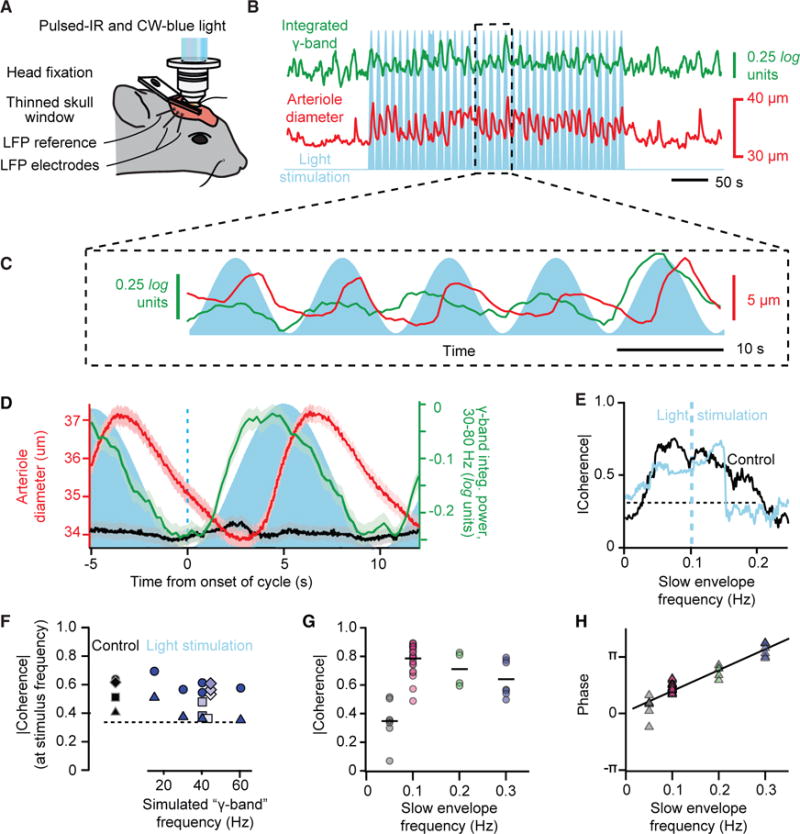
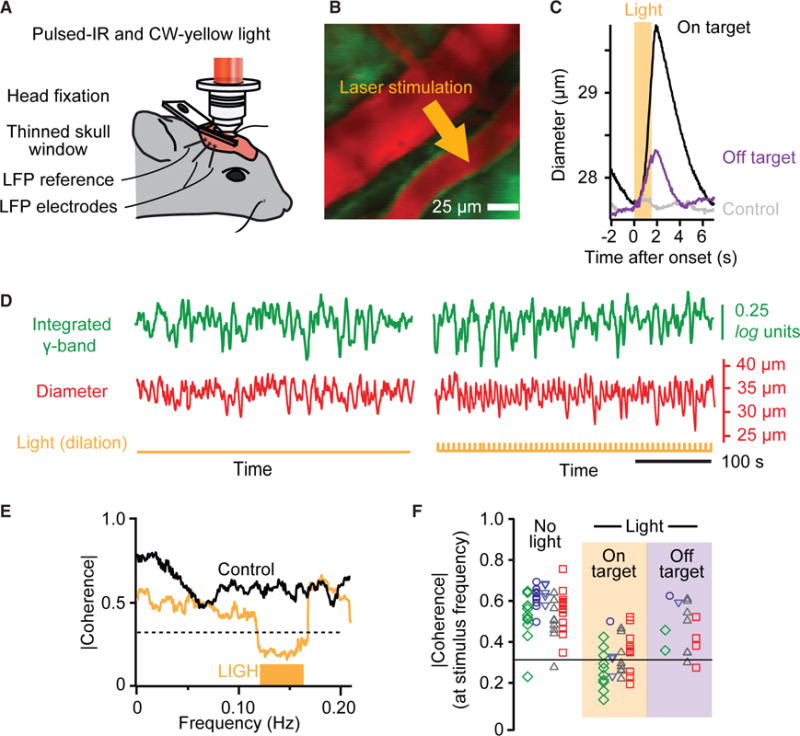
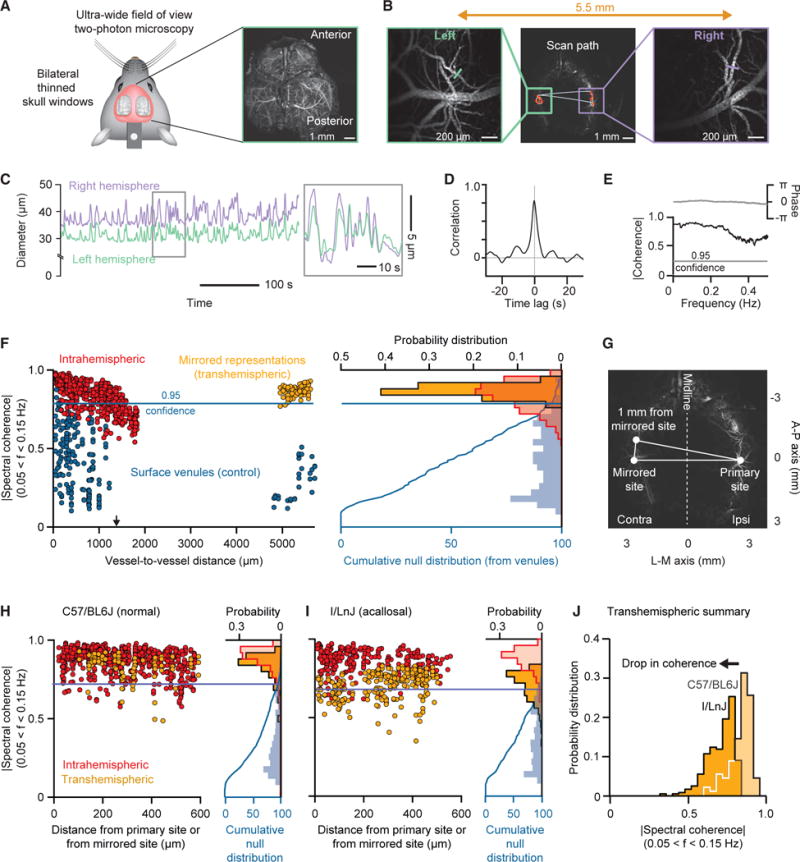
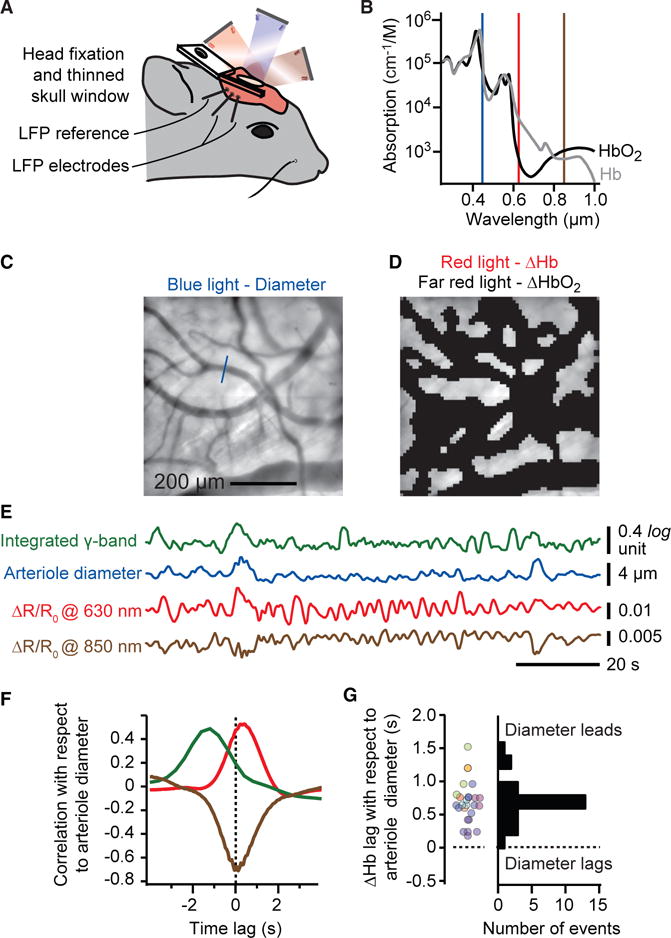
Resting-state signals in blood-oxygenation-level-dependent (BOLD) imaging are used to parcellate brain regions and define "functional connections" between regions. Yet a physiological link between fluctuations in blood oxygenation with those in neuronal signaling pathways is missing. We present evidence from studies on mouse cortex that modulation of vasomotion, i.e., intrinsic ultra-slow (0.1 Hz) fluctuations in arteriole diameter, provides this link. First, ultra-slow fluctuations in neuronal signaling, which occur as an envelope over γ-band activity, entrains vasomotion. Second, optogenetic manipulations confirm that entrainment is unidirectional. Third, co-fluctuations in the diameter of pairs of arterioles within the same hemisphere diminish to chance for separations >1.4 mm. Yet the diameters of arterioles in distant (>5 mm), mirrored transhemispheric sites strongly co-fluctuate; these correlations are diminished in acallosal mice. Fourth, fluctuations in arteriole diameter coherently drive fluctuations in blood oxygenation. Thus, entrainment of vasomotion links neuronal pathways to functional connections.

Keywords: Coupled oscillators; Functional magnetic resonant imaging; Hemodynamics; Intrinsic optical imaging; Optogenetics; Two-photon imaging.


Figures

Figure 1
Figure 1. Coupled Oscillator Model of the Central Hypothesis
Variations in γ-band electrical power leads to partial entrainment of the vasomotor oscillations in the smooth muscle of cortical surface and penetrating arterioles. Increases in neuronal activation, in turn, dilates the arterioles and leads to an increase in the supply of fresh blood, as measured by a positive change in the BOLD signal. Coupling can be via callosal projections or via common input.
Figure 2
Figure 2. The Envelope of γ-Band Oscillations Locks to and Leads Vasomotor Oscillations in Arteriole Diameter
(A) Set-up with head-fixed awake mouse. (B) Two-photon image of surface vessels, scan path to define lumen diameter, and example diameter data. (C) Example trace of local field potential (LFP), the spectrogram of the LFP, with a window of 2.0 s and a bandwidth of 2.5 Hz. (D) The time series of the integrated γ-band power and diameter for one arteriole (B and C) in the field. (E) Cross correlation of the two time series used for the example in (C) based on averaging over 600 s. The diameter lags electrical activity by 1.9 s. (F) Distribution of time lags across all measurements; 82 records from 27 mice. The black line is for all records, with lag = 1.9 ± 0.1 s (mean ± SEM). The gray plot is for the mean lag of each animal, with lag = 1.9 ± 0.2 s. (G) Spectral coherence of the two time series used for the example in (C) compared to the 0.95 confidence level. (H) Distribution of the magnitude of the spectral coherence, across all mice, averaged for different ranges of frequency in the LFP data.
Figure 3
Figure 3. Artificially Driven Ultra-Slow Oscillations in Neuronal Activity Drive Vasomotor Oscillations
(A) Set-up similar to that in Figure 2A with addition of wide-field, one-photon epi-illumination with 445 nm laser light concurrent with TPLSM imaging. This enables optogenetic activation of L5b neurons that express ChR2. (B) Example of a time series of arteriole diameter (red) and γ-band power (green) from driving L5b neurons with pulses modulated by 10 s sinusoidal envelope (blue); note driven vasodilation. (C) Expanded version of data in (B). (D) Correlation of arteriole diameter (red) and γ-band power (green) with envelope of drive (blue) for the time series highlighted in (B), averaged over 320 s. We further show control data (black) for illumination with a wild-type mouse at 620 mJ/cycle; the charge was scaled from a 49-μm-diameter vessel. (E) Spectral coherence shows increased phase locking during ChR2 drive for the time series highlighted in (B). The bandwidth of the spectral estimation was 0.06 Hz. (F) Compendium of the magnitude of the coherence between the power at the γ-band and the change in arteriole diameter across multiple trial periods; 15 control and 30 stimulus trials, each of 300 s, from four mice. The γ-like frequency varied between stimulus trials for two animals, with the energy fixed at 200 mJ/cycle, while γ-like frequency was fixed at 40 Hz trials for two animals, with the energy varied from 190 μJ/cycle (lighter) to 620 μJ/cycle (darker). The line is the highest 0.95 confidence limit among all trials. (G) Compendium of the magnitude of the coherence between the envelope of the optogenetic drive and the change in arteriole diameter across multiple trial periods; 26 stimulus trials at 600 s and 15 trials at 300 s, from nine mice. The line is the highest 0.95 confidence limit among all trials. (H) Compendium of the phase of the coherence for the same data in (G).
Figure 4
Figure 4. Artificial Ultra-Slow Drive to Vascular Tone Diminishes Correlation between Neuronal Activity and Vasomotion
(A) Set-up with addition of focused one-photon epi-illumination with 590 nm laser light for optogenetic inactivation of smooth muscle in surface arterioles concurrent with TPLSM imaging. (B) False colored image of surface vessels with site of illumination. (C) Trial averaged of the change in arteriole diameter with onset of illumination for illumination on and off a targeted vessel; 84 trials on the target vessel and 84 trials off the target vessel, each 7 s, for a single mouse. We further show control data for on-target illumination with a wild-type mouse; the charge was scaled from a 49 μm diameter vessel. (D) Time series from a control period (left) and a period driving smooth muscle with eNpHR (right). Note increase in diameter with each pulse. Pulse rate of 0.14 Hz with 1.5 s wide pulses. (E) Spectral coherence shows decreased phase locking during eNpHR drive for the time series highlighted in (D) based on averaging over 600 s. The half-bandwidth of the spectral estimation was 0.025 Hz. (F) Compendium of the coherence across control and experimental trials; 51 control/stimulus pairs with five mice, each averaged over 600 s. Common shapes and color correspond to different vessels but the same animal. The 0.95 confidence level is |C| = 0.31. No light, mean |C| = 0.56. Light on target, mean |C| = 0.31 and different from the no light case with p < 10−12; two-sample Kolmogorov-Smirnov (K-S) test. Light off target, mean |C| = 0.46, different from light on target case with p = 0.008 and the no light case with p = 0.03; two-sample K-S tests.
Figure 5
Figure 5. Multi-vessel Diameter Measurements within and between Hemispheres
(A) Bilateral thin skull transcranial preparation for ultra-wide field two-photon imaging. Average projection of a high-resolution scan through the cortical mantel. (B) The scan paths for intra- and transhemispheric measurements; figures on the sides are expansions in the vicinity of the measured arterioles. (C) Example scan data showing the highly correlated nature of variations in vessel diameter across hemispheres. (D) Cross-correlation of the example data of (C) based on averaging over 600 s. (E) Coherence between arteriole diameters in bilateral mirrored area based on averaging over 600 s. (F) Results for repeated measurements across one animal. We show the magnitude of the spectral coherence of arteriole diameter across 600 s trials of data as a function of distance between arterioles for intrahemispheric (red dots; 743 pairs involving 154 arterioles across 14 trials) and transhemispheric (yellow dots; 83 pairs involving 43 arterioles across 5 trials). The coherence between veins (blue dots; 215 pairs involving 82 venules across 14 trials), which is a result of common noise, serves to define a null hypothesis. The blue curve on the right edge is the probability distribution function of the venule data. The cumulative for the veins defines the 0.95 confidence level used to evaluate significance for coherence between arterioles. (G) Diagram illustrating the calculation of the mirrored distance across the midline. (H) Intra- and transhemispheric spectral coherence between arterioles for a cohort of five C57/BL6J mice. We restricted the datasets to pairs with a difference in rostro-caudal direction of less than 600 μm from either the original (intrahemispheric) or mirrored (transhemispheric) site. Results are plotted in terms of functional distance for 600 s datasets. Intrahemispheric data represent 726 pairs involving 420 arterioles across 52 trials. Transhemispheric data represent 98 pairs involving 67 arterioles across 13 trials. The cumulative distribution for veins is based on 802 pairs involving 247 venules across 40 trials. (I) Intra- and transhemispheric spectral coherence between arterioles for a cohort of five I/LnJ mice. Analysis conditions as for the data in (H). Intrahemispheric data represent 277 pairs involving 228 arterioles across 41 trials. Transhemispheric data represent 239 pairs involving 183 arterioles across 33 trials. The cumulative distribution for veins is based on 419 pairs involving 185 venules across 41 trials. (J) Comparison between the histograms of arterial transhemispheric coherence in the acallosal and normal mice. The two histograms are significantly different at the p < 10−30 level by a two-sample K-S test.
Figure 6
Figure 6. Changes in Arteriole Diameter Lead the Changes Tissue Oxygenation
(A and B) Set-up for intrinsic optical signal imaging. Blue light (450 nm) is used to track arteriole diameter while red light (630 nm) and far-red light (850 nm) are used to measure changes in oxy- to deoxyhemoglobin (A), respectively. Note the differential changes at these two wavelengths and that decreases in absorbance lead to increases in reflectance (B). (C and D) The full field is used to measure changes in arteriole diameter (C) while an image mask of the field excluding all pial and dural vessels is used to measure changes in oxygenation (D). (E) Example dataset showing the derived time series for integrated γ-rhythm power (Figure 1C), arteriole diameter, and changes in reflectance at the red and far-red wavelengths. (F) Cross-correlation, averaged over 600 s of the example data, shows that increase in oxygenation (red trace), or equivalently, a decrease in deoxygenation (far-red trace), lags the increase in arteriole diameter. The lead of integrated γ-rhythm power over diameter, as in Figure 1C, is also shown. (G) Compendium of lag time in oxyhemoglobin change relative to arteriole diameter change; 26 sessions of 600 s with eight mice.

Comment in

References

    1. Ahrens KF, Kleinfeld D. Current flow in vibrissa motor cortex can phase-lock with exploratory rhythmic whisking in rat. J Neurophysiol. 2004;92:1700–1707. - PubMed
    1. Arenkiel BR, Peca J, Davison IG, Feliciano C, Deisseroth K, Augustine GJ, Ehlers MD, Feng G. In vivo light-induced activation of neural circuitry in transgenic mice expressing channelrhodopsin-2. Neuron. 2007;54:205–218. - PMC - PubMed
    1. Attwell D, Iadecola C. The neural basis of functional brain imaging signals. Trends Neurosci. 2002;25:621–625. - PubMed
    1. Biswal B, Yetkin FZ, Haughton VM, Hyde JS. Functional connectivity in the motor cortex of resting human brain using echo-planar MRI. Magn Reson Med. 1995;34:537–541. - PubMed
    1. Blinder P, Tsai PS, Kaufhold JP, Knutsen PM, Suhl H, Kleinfeld D. The cortical angiome: an interconnected vascular network with noncolumnar patterns of blood flow. Nat Neurosci. 2013;16:889–897. - PMC - PubMed