. 2017 Nov 15;96(4):871-882.e5.
doi: 10.1016/j.neuron.2017.09.052. Epub 2017 Nov 5.

Deprivation-Induced Homeostatic Spine Scaling In Vivo Is Localized to Dendritic Branches that Have Undergone Recent Spine Loss

Affiliations

Deprivation-Induced Homeostatic Spine Scaling In Vivo Is Localized to Dendritic Branches that Have Undergone Recent Spine Loss

Samuel J Barnes et al. Neuron. .

Abstract

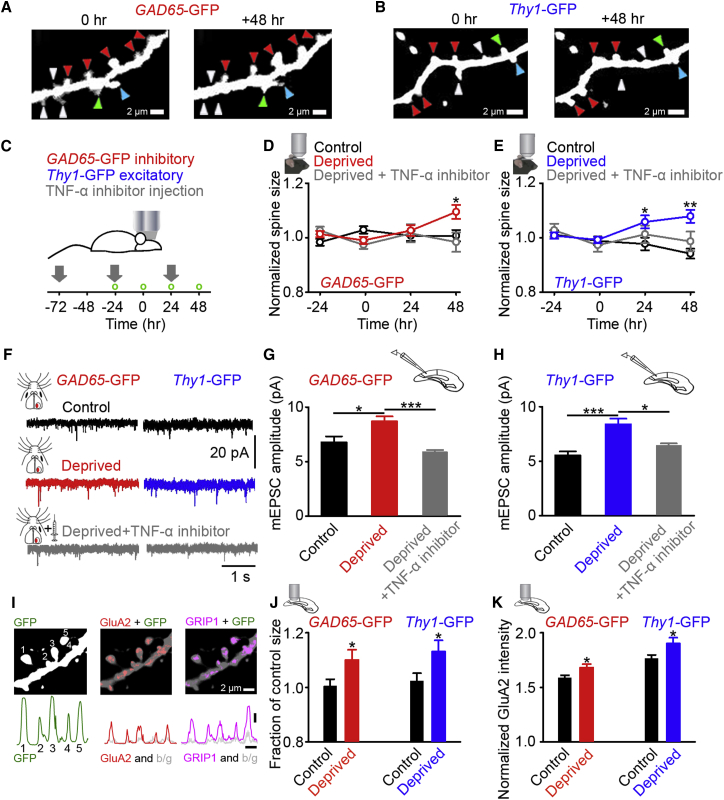
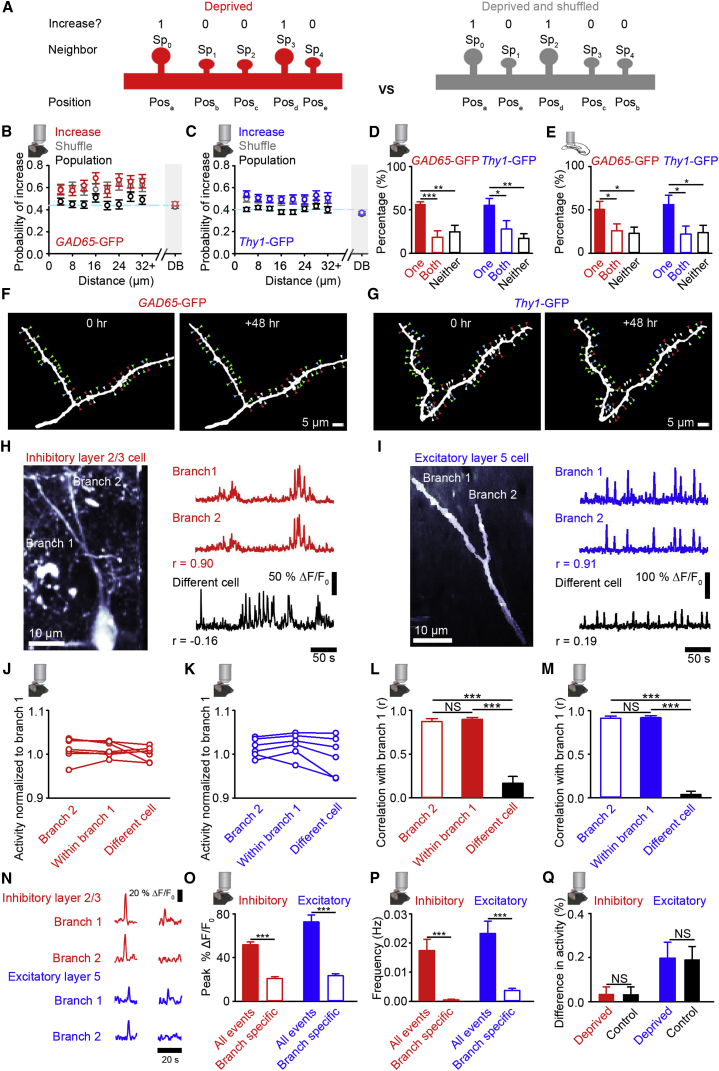
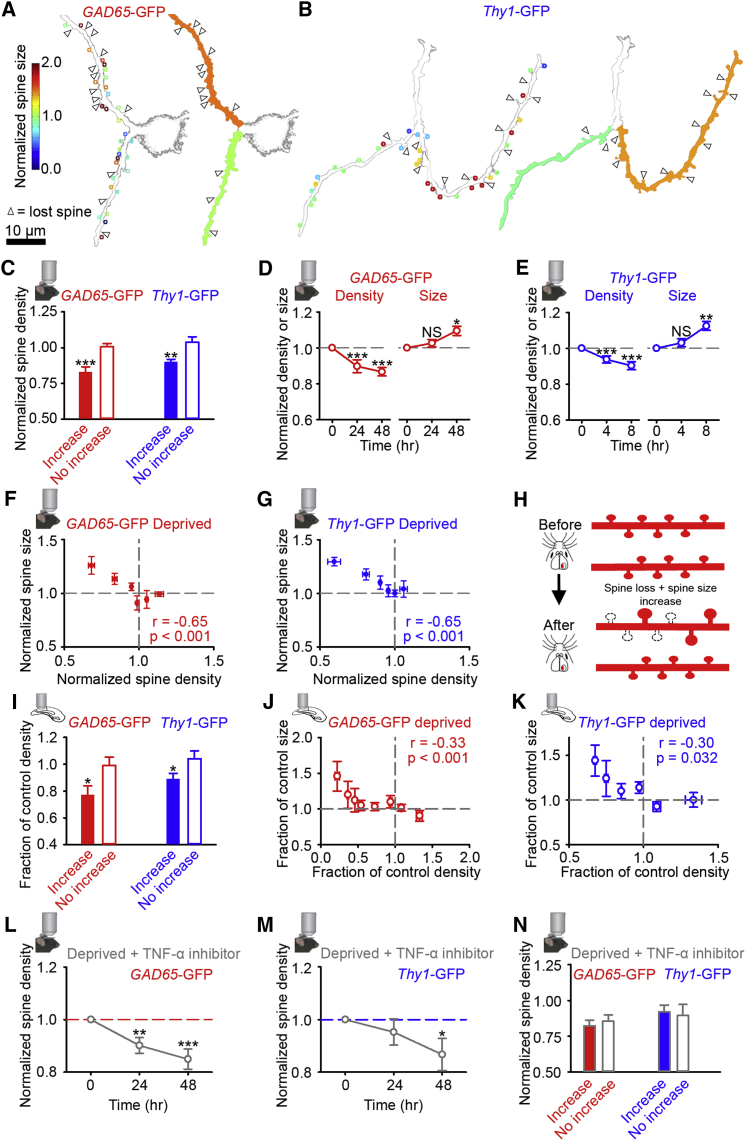
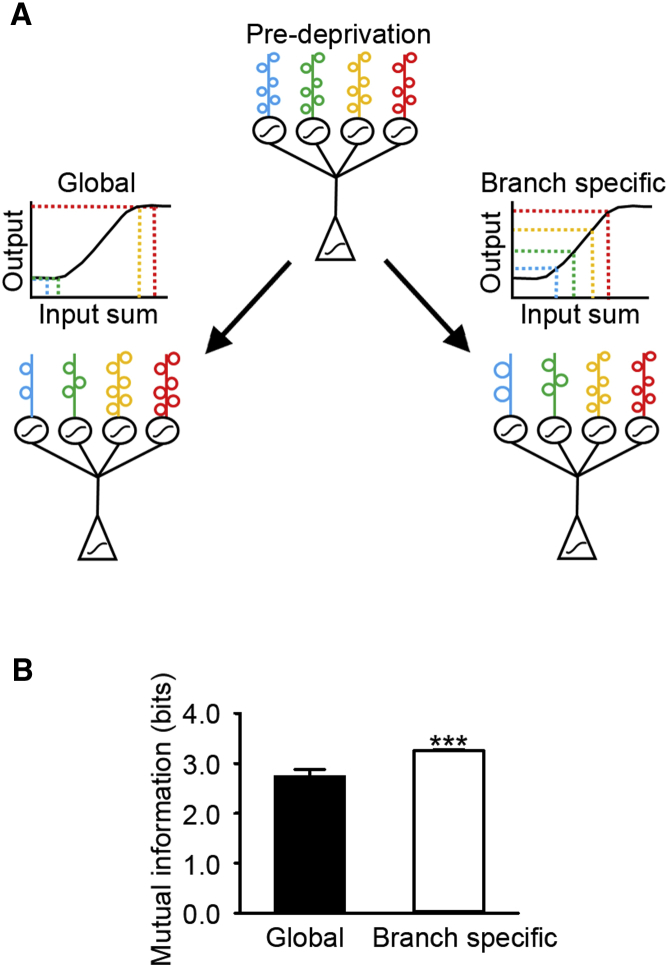
Synaptic scaling is a key homeostatic plasticity mechanism and is thought to be involved in the regulation of cortical activity levels. Here we investigated the spatial scale of homeostatic changes in spine size following sensory deprivation in a subset of inhibitory (layer 2/3 GAD65-positive) and excitatory (layer 5 Thy1-positive) neurons in mouse visual cortex. Using repeated in vivo two-photon imaging, we find that increases in spine size are tumor necrosis factor alpha (TNF-α) dependent and thus are likely associated with synaptic scaling. Rather than occurring at all spines, the observed increases in spine size are spatially localized to a subset of dendritic branches and are correlated with the degree of recent local spine loss within that branch. Using simulations, we show that such a compartmentalized form of synaptic scaling has computational benefits over cell-wide scaling for information processing within the cell.


Figures

Figure 1
Figure 1
Spine Size Changes and Synaptic Scaling in Inhibitory and Excitatory Neurons (A and B) Example in vivo image projections. Arrowheads show spines that increase (red), decrease (blue), stay the same size (green), or are lost (white). (C) Experimental timeline. Enucleation occurs immediately after imaging at 0 hr. Gray arrows indicate time of TNF-α inhibitor injections; green circles indicate time of in vivo imaging. (D and E) Spine size normalized to baseline (average of time points -24 and 0) for individual spines in control (black), deprived (red/blue), or deprived with the TNF-α inhibitor (gray) for inhibitory (D) or excitatory (E) neurons. Asterisks denote statistics from one-way repeated-measures ANOVA (see Table S1). (F–H) Example mEPSC recordings (F) or average mEPSC amplitude per cell 48 hr after enucleation (red/blue), enucleation with the TNF-α inhibitor (gray), or control (black). (I) (Top) Dendritic section from an excitatory neuron 48 hr after deprivation with immunohistochemistry against GFP (left), GluA2 (middle), and GRIP1 (right). (Bottom) Line trace of fluorescence intensity and the background measured by rotating the individual fluorescence images by 90° (gray). Scale bars, 2 μm and 25 intensity units. (J and K) Spine size normalized to average control spine size (J) and fluorescence intensity of GluA2 in spines that co-localized with GRIP1 normalized to the background GluA2 fluorescence (K, see STAR Methods and Figures S1U–S1Z) for branches from either inhibitory (red) or excitatory (blue) neurons 48 hr after enucleation or control (black). (Insets) Mouse with objective is in vivo imaging experiment, slice with objective is in vitro imaging experiment, and slice with electrode is in vitro electrophysiology experiment. p < 0.05; ∗∗p < 0.01; ∗∗∗p < 0.001. For statistical comparisons and n values, see Table S1. Error bars, mean and SEM. Crossing axons have been removed from images for clarity. See also Figure S1 and Table S1.
Figure 2
Figure 2
Branch-Specific spine Size Changes In Vivo (A) Whether neighbors (Sp1…n) of spine, Sp0, increase in size (1 increasing, 0 not increasing) is calculated for distances from Sp0 (red). Shuffled (gray) versions of the same dendrite are created by randomly assigning the spatial positions of the spines (Posa…d) as a comparison to the experimental dendrites. (B and C) Cluster analysis for inhibitory (B) and excitatory (C) neurons. The fraction of spines, at different distances (4 μm bins) from a spine (Sp0) in deprived (red/blue) animals, that increase in size (at least 1.1 times larger than baseline at 48 hr post-enucleation). Data are plotted when Sp0 is a spine that increases (red/blue), is any spine from the entire population (black), and where the spatial position of neighboring spines for each increasing Sp0 is randomly shuffled (gray, Figure 2A). DB is the probability of an increasing spine on the same cell, but a different branch. Cyan dashed line depicts proportion of all spines increasing. (D and E) Percentage of branch pairs, where average spine size is increased relative to baseline (see STAR Methods for criteria) for in vivo (D) or increased relative to average control size for in vitro (E) on one branch (red/blue filled), both branches (red/blue open), or neither branch (black, open). Percentages are averaged across cells. (F and G) Example in vivo images of a branch pair. Arrowheads show spines that increase (red), decrease (blue), stay the same size (green), or are lost (white) after enucleation. In both (F) and (G), the right branch has an average increase in spine size, while the left branch does not. Crossing axons have been removed for clarity. (H and I) (Left) Image of a dendritic branchpoint on a cell expressing GCaMP6f. Image in (I) is side projected. (Right) Change in fluorescence signals (%ΔF/F0) for labeled branches (red/blue) or from a dendrite in the same imaging region, but on a different cell (black). (J–M) Activity levels (integral of the %ΔF/F0 signal) normalized to the overall activity in branch 1 (J and K) or the correlation coefficient calculated with branch 1 (L and M), for a dendritic branch sharing a branchpoint (branch 2), for a neighboring region 10 μm apart on the same branch (within branch 1) and for a branch in the same imaging region but on a different cell (different cell) in inhibitory neurons 24 hr post-enucleation (J and L) or excitatory neurons 4 hr post-enucleation (K and M). (N) Example calcium signals (%ΔF/F0) from branch pairs showing global (left) and branch-specific calcium events (right). (O and P) Average peak amplitude (O) or average frequency (P) of all dendritic calcium events and branch-specific calcium events. (Q) Percentage difference in total calcium activity attributable to branch specific events (see STAR Methods) between branches in branch pairs. (Insets) Mouse with objective is in vivo imaging experiment; slice with objective is in vitro imaging experiment. NS, no significance; p < 0.05; ∗∗p < 0.01; ∗∗∗p < 0.001. For statistical comparisons and n values, see Table S2. Error bars, mean and SEM. See also Figure S2 and Table S2.
Figure 3
Figure 3
Relationships between Spine Loss and Increases in Spine Size within Dendritic Branches (A and B) Example branches showing spine loss (arrowhead) and stable spine size (circles) after deprivation. Color scale shows spine size 48 hr post-enucleation normalized to baseline for individual spines (left). The average spine size change over a branch (right) is shown by the color of the filled branch and corresponds to scale in (A). (C) Spine density 48 hr post-enucleation normalized to baseline for individual branches whose spines increase in size or do not increase relative to their individual baseline after enucleation (see STAR Methods). (D and E) Normalized spine size and spine density after enucleation for inhibitory (D) and excitatory (E) neurons. (F and G) Spine density versus average spine size normalized to baseline. Data taken at 48 hr (F) and 8 hr (G) after enucleation and normalized to baseline values for each branch (density) and individual spines (size). Normalized size change is then averaged across the dendritic branch. (H) Schematic showing the observed relationship between spine loss and spine size change before (top) and after (bottom) enucleation. Black dashed lines show lost spines. (I) Spine density (as a fraction of the average control value) for increasing and non-increasing spine size branches (see STAR Methods) in slices prepared 48 hr after enucleation. (J and K) Spine density versus spine size (as a fraction of the average control values for branches (density) and individual spines (size), and size is then averaged across the branch) in slices prepared 48 hr after enucleation. (L and M) Spine density normalized per branch to baseline for dendritic branches in deprived animals with the TNF-α inhibitor. (N) Spine density in deprived animals with the TNF-α inhibitor 48 hr post-enucleation normalized to baseline for individual branches whose spines increase (filled) or do not increase (open) in size relative to their individual baseline after enucleation. (Insets) Mouse with objective is in vivo imaging experiment, slice with objective is in vitro imaging experiment. NS, no significance; p < 0.05; ∗∗p < 0.01; ∗∗∗p < 0.001. For statistical comparisons and n values, see Table S3. Error bars, mean and SEM. See also Figure S3 and Table S3.
Figure 4
Figure 4
Model Comparing Mutual Information in Conditions of Branch-Specific and Global Synaptic Scaling (A) Schematic of model. Pre-deprivation: model architecture with synaptic weights as spines (colored open circles) on dendritic branches (colored vertical lines at top of schematic). The weights of the randomly chosen subset of activated inputs are summed and passed through a dendritic sigmoidal function (black circles). Then the individual branches’ activities are summed and passed through a somatic sigmoidal function (black triangle). (Bottom left) Global scaling following spine loss. (Bottom right) Branch-specific scaling following the same spine loss. Sigmoidal plots above the model represent the dendritic branch sigmoid, showing examples of summed dendritic inputs (colored vertical lines on sigmoid) translating to an output (corresponding color, horizontal lines on sigmoid). (B) Mutual information values (global versus branch specific, p < 0.001, t test) for simulations. ∗∗∗p < 0.001. Error bars, mean and SD.

Comment in

References

    1. Andermann M.L., Kerlin A.M., Roumis D.K., Glickfeld L.L., Reid R.C. Functional specialization of mouse higher visual cortical areas. Neuron. 2011;72:1025–1039. - PMC - PubMed
    1. Aoto J., Nam C.I., Poon M.M., Ting P., Chen L. Synaptic signaling by all-trans retinoic acid in homeostatic synaptic plasticity. Neuron. 2008;60:308–320. - PMC - PubMed
    1. Attinger A., Wang B., Keller G.B. Visuomotor coupling shapes the functional development of mouse visual cortex. Cell. 2017;169:1291–1302.e14. - PubMed
    1. Ayaz A., Saleem A.B., Schölvinck M.L., Carandini M. Locomotion controls spatial integration in mouse visual cortex. Curr. Biol. 2013;23:890–894. - PMC - PubMed
    1. Baraban S.C., Hollopeter G., Erickson J.C., Schwartzkroin P.A., Palmiter R.D. Knock-out mice reveal a critical antiepileptic role for neuropeptide Y. J. Neurosci. 1997;17:8927–8936. - PMC - PubMed

Substances