. 2017 Dec;6(12):1563-1573.
doi: 10.1016/j.molmet.2017.10.003. Epub 2017 Oct 18.

A polyphenol-rich cranberry extract reverses insulin resistance and hepatic steatosis independently of body weight loss

Affiliations

A polyphenol-rich cranberry extract reverses insulin resistance and hepatic steatosis independently of body weight loss

Fernando F Anhê et al. Mol Metab. 2017 Dec.

Abstract

Objective: Previous studies have reported that polyphenol-rich extracts from various sources can prevent obesity and associated gastro-hepatic and metabolic disorders in diet-induced obese (DIO) mice. However, whether such extracts can reverse obesity-linked metabolic alterations remains unknown. In the present study, we aimed to investigate the potential of a polyphenol-rich extract from cranberry (CE) to reverse obesity and associated metabolic disorders in DIO-mice.

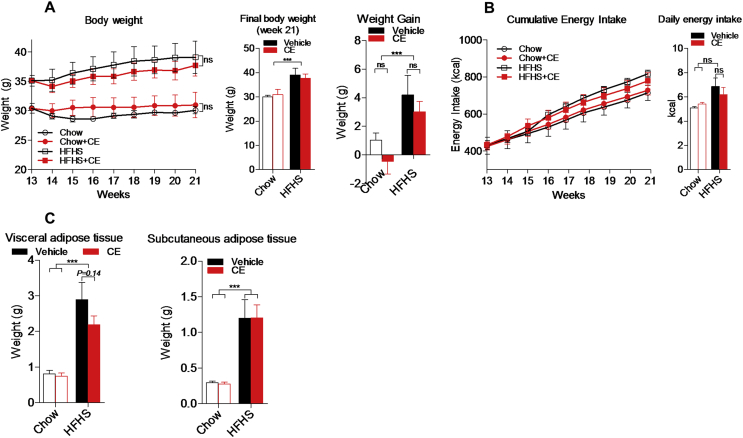
Methods: Mice were pre-fed either a Chow or a High Fat-High Sucrose (HFHS) diet for 13 weeks to induce obesity and then treated either with CE (200 mg/kg, Chow + CE, HFHS + CE) or vehicle (Chow, HFHS) for 8 additional weeks.

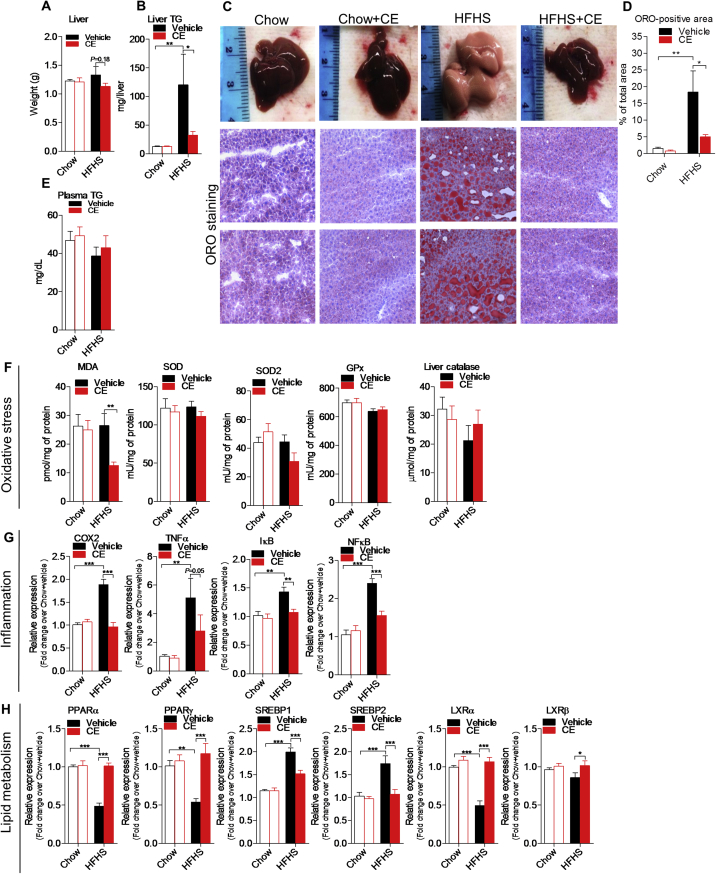
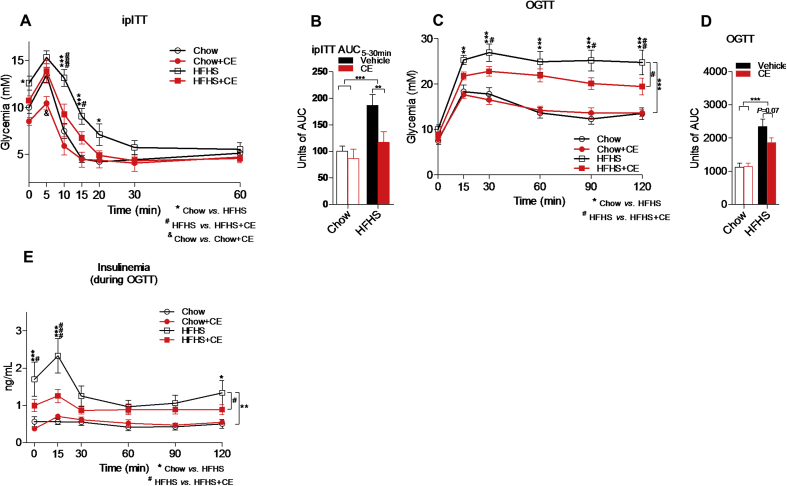
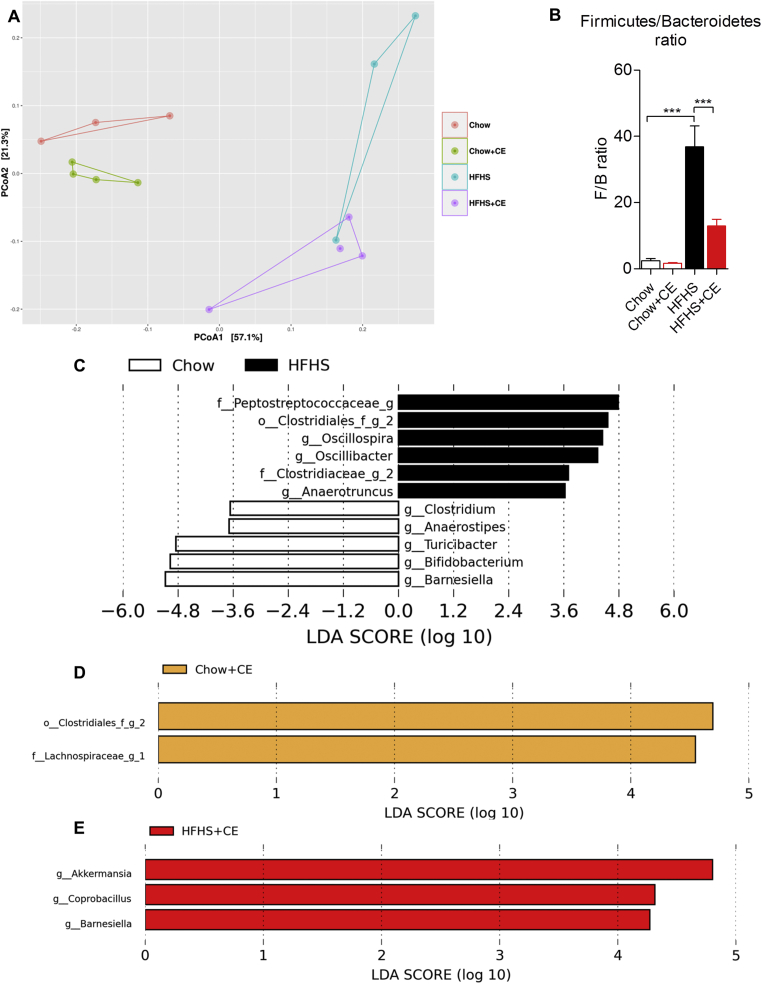
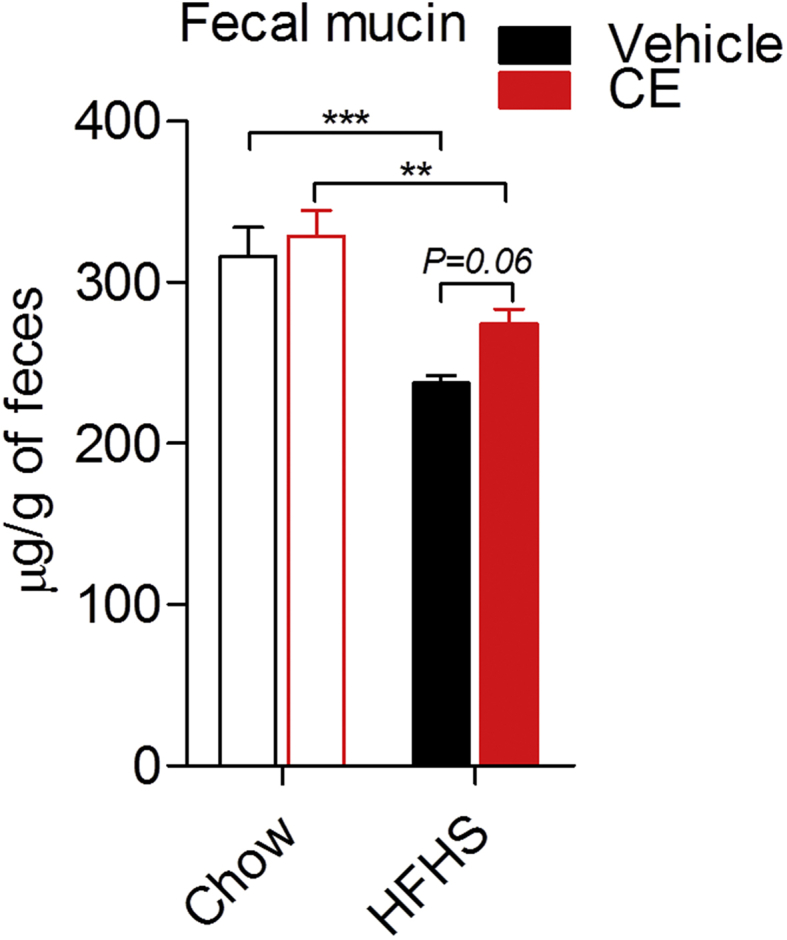
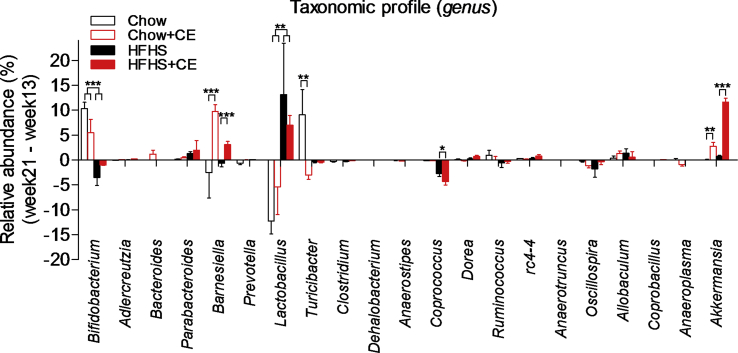
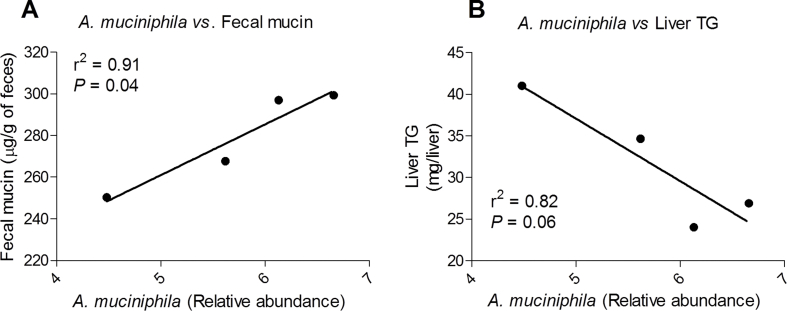
Results: CE did not reverse weight gain or fat mass accretion in Chow- or HFHS-fed mice. However, HFHS + CE fully reversed hepatic steatosis and this was linked to upregulation of genes involved in lipid catabolism (e.g., PPARα) and downregulation of several pro-inflammatory genes (eg, COX2, TNFα) in the liver. These findings were associated with improved glucose tolerance and normalization of insulin sensitivity in HFHS + CE mice. The gut microbiota of HFHS + CE mice was characterized by lower Firmicutes to Bacteroidetes ratio and a drastic expansion of Akkermansia muciniphila and, to a lesser extent, of Barnesiella spp, as compared to HFHS controls.

Conclusions: Taken together, our findings demonstrate that CE, without impacting body weight or adiposity, can fully reverse HFHS diet-induced insulin resistance and hepatic steatosis while triggering A. muciniphila blooming in the gut microbiota, thus underscoring the gut-liver axis as a primary target of cranberry polyphenols.

Keywords: Akkermansia; Barnesiella; Flavonoids; Obesity; Vaccinium macrocarpon.


Figures

Figure 1
Figure 1
Impact of CE on body features of Chow- and HFHS-fed mice. Mice were pre-fed a standard Chow diet or a high fat/high sucrose diet throughout 13 weeks and treated either with a cranberry extract (CE) or the vehicle for 8 additional weeks. (A) Weight gain and final body weight; (B) energy intake; (C) weight of visceral and subcutaneous fat pads. Two-way repeated measures RM-ANOVA with a Student-Newman-Keuls post hoc test was used to assign significance to the differences between time points within different groups. Two-way ANOVA with a Student-Newman-Keuls post hoc test was applied to calculate the significance of the differences between groups. Data are expressed as the mean ± SEM; n = 8–11; *P < 0.05, **P < 0.01 and ***P < 0.001.
Figure 2
Figure 2
CE reverses hepatic steatosis and alleviates liver inflammation. (A) Liver weight, (B) hepatic triglyceride accumulation, (C) representative images of hepatic lipid accumulation by oil red O (ORO) staining, (D) quantification of ORO-positive area, and (E) plasma triglycerides. (F) Hepatic quantification of [MDA] malondialdehyde, [SOD] superoxide dismutase, [GPx] glutathione peroxidase, and catalase. (G) Liver mRNA expression of [COX2] cyclooxygenase 2, [TNFα] tumor necrosis factor α, [NFκB], nuclear factor κ-light-chain-enhancer of activated B cells, [IκB] NFκB inhibitor. (H) Liver mRNA expression of [PPARα/γ] peroxisome proliferator-activated receptor α and γ, [SREBP1c/2] sterol regulatory element-binding protein 1c and 2 and [LXRα/β] liver X receptor α and β. Two-way ANOVA with a Student-Newman-Keuls post hoc test was applied to calculate the significance of the differences between groups. Data are expressed as the mean ± SEM; n = 8–11; *P < 0.05, **P < 0.01 and ***P < 0.001.
Figure 3
Figure 3
CE improves glucose homeostasis and insulin sensitivity in diet-induced obese mice. At week 17, mice were fasted for 6 h and (A, B) insulin tolerance tests (ipITT) were carried out after intraperitoneal insulin injections (ipITT, 0.65 IU/kg). At week 19, mice were fasted overnight (12 h) and submitted to (C, D) oral glucose tolerance tests (OGTT). (E) Blood was collected during OGTT and used to assess insulinemia after glucose challenge. (A, C, E) Two-way repeated measures ANOVA with a Student-Newman-Keuls post hoc test was used to assign significance to the differences between time points within groups. *P < 0.05, **P < 0.01 and ***P < 0.001 for Chow vs HFHS; #P < 0.05, ##P < 0.01; ###P < 0.001 for HFHS vs HFHS + CE; &P < 0.05 for Chow vs Chow + CE. (B, D, F) Two-way ANOVA with a Student-Newman-Keuls post hoc test was applied to calculate the significance of the differences between groups; n = 8–11; *P < 0.05, **P < 0.01 and ***P < 0.001. Data are expressed as the mean ± SEM.
Figure 4
Figure 4
CE administration alters the taxonomic profile of Chow- and HFHS-fed mice. Genomic DNA was extracted from feces collected at week 21 and subsequent 16S rRNA-based gut microbial profiling was performed. Feces from mice housed in the same cage were pooled and considered as one biological sample (Chow n = 3; Chow + CE n = 4; HFHS n = 3 and HFHS + CE n = 4). (A) β-diversity among groups was initially observed by means of principal component analysis (PCoA) on weighted unifrac distances, and the (B) Firmicutes to Bacteroidetes ratio was calculated as a general index of obesity-driven dysbiosis. Linear discriminant analysis (LDA) effect size (LEfSe) was calculated in order to explore the taxa that more strongly discriminate between the gut microbiota of (C) Chow vs. HFHS, (D) Chow vs Chow + CE and (E) HFHS vs HFHS + CE. (B) Two-way ANOVA with a Student-Newman-Keuls post hoc test was applied to calculate the significance of the differences between groups. *P < 0.05, **P < 0.01 and ***P < 0.001.
Figure 5
Figure 5
Fecal mucin quantification. Cecal contents were collected at week 21, snap-frozen in liquid nitrogen and stored at −80 °C. Cecal feces were freeze-powdered and the presence of mucins was determined using a fluorometric assay kit that discriminates O-linked glycoproteins (mucins) from N-linked glycoproteins. Two-way ANOVA with a Student-Newman-Keuls post hoc test was applied to calculate the significance of the differences between groups. *P < 0.05, **P < 0.01 and ***P < 0.001.
None
Supplemental Figure 1Gut microbial profile at genus level. In order to eliminate the putative influence of baseline (week 13) gut microbiota, the Δ relative abundance week21- relative abundance week13 was calculated. Significance was calculated using Mann–Whitney U test with a Monte Carlo permutation test, *P < 0.05, **P < 0.01 and ***P < 0.001.
None
Supplemental Figure 1Linear regression analysis. How the abundance of A. muciniphila in each cage explains the variability in the amount of (A) fecal mucin and (B) liver triglyceride deposition was calculated by regression analysis. The phenotype per cage (n = 4) considers the average of mice housed together. r2 – coefficient of determination.

References

    1. Finucane M.M., Stevens G.A., Cowan M.J., Danaei G., Lin J.K., Paciorek C.J. National, regional, and global trends in body-mass index since 1980: systematic analysis of health examination surveys and epidemiological studies with 960 country-years and 9.1 million participants. Lancet. 2011;377:557–567. - PMC - PubMed
    1. Locke A.E., Kahali B., Berndt S.I., Justice A.E., Pers T.H., Day F.R. Genetic studies of body mass index yield new insights for obesity biology. Nature. 2015;518:197–206. - PMC - PubMed
    1. David L.A., Maurice C.F., Carmody R.N., Gootenberg D.B., Button J.E., Wolfe B.E. Diet rapidly and reproducibly alters the human gut microbiome. Nature. 2014;505:559–563. - PMC - PubMed
    1. Zietak M., Kovatcheva-Datchary P., Markiewicz L.H., Stahlman M., Kozak L.P., Backhed F. Altered microbiota contributes to reduced diet-induced obesity upon cold exposure. Cell Metabolism. 2016;23:1216–1223. - PMC - PubMed
    1. Le Chatelier E., Nielsen T., Qin J., Prifti E., Hildebrand F., Falony G. Richness of human gut microbiome correlates with metabolic markers. Nature. 2013;500:541–546. - PubMed

Publication types

Grants and funding