. 2017 Nov 13;32(5):684-700.e9.
doi: 10.1016/j.ccell.2017.09.014. Epub 2017 Oct 26.

H3.3K27M Cooperates with Trp53 Loss and PDGFRA Gain in Mouse Embryonic Neural Progenitor Cells to Induce Invasive High-Grade Gliomas

Affiliations

H3.3K27M Cooperates with Trp53 Loss and PDGFRA Gain in Mouse Embryonic Neural Progenitor Cells to Induce Invasive High-Grade Gliomas

Manav Pathania et al. Cancer Cell. .

Abstract

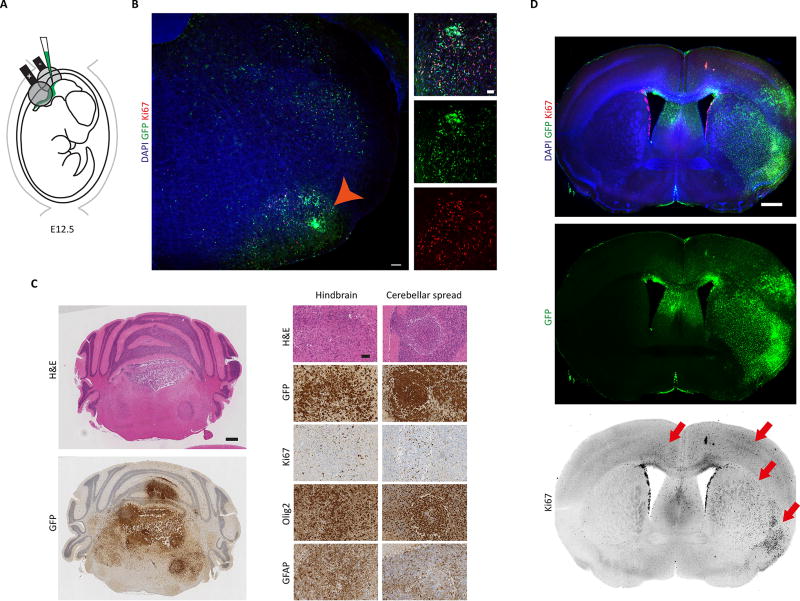
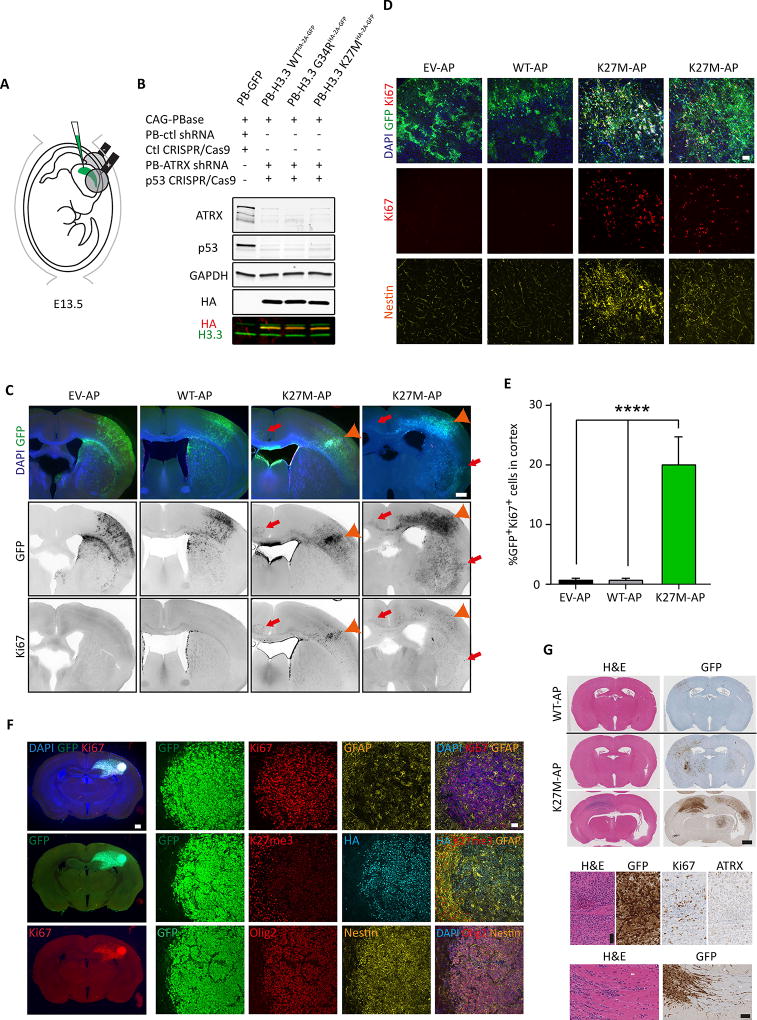
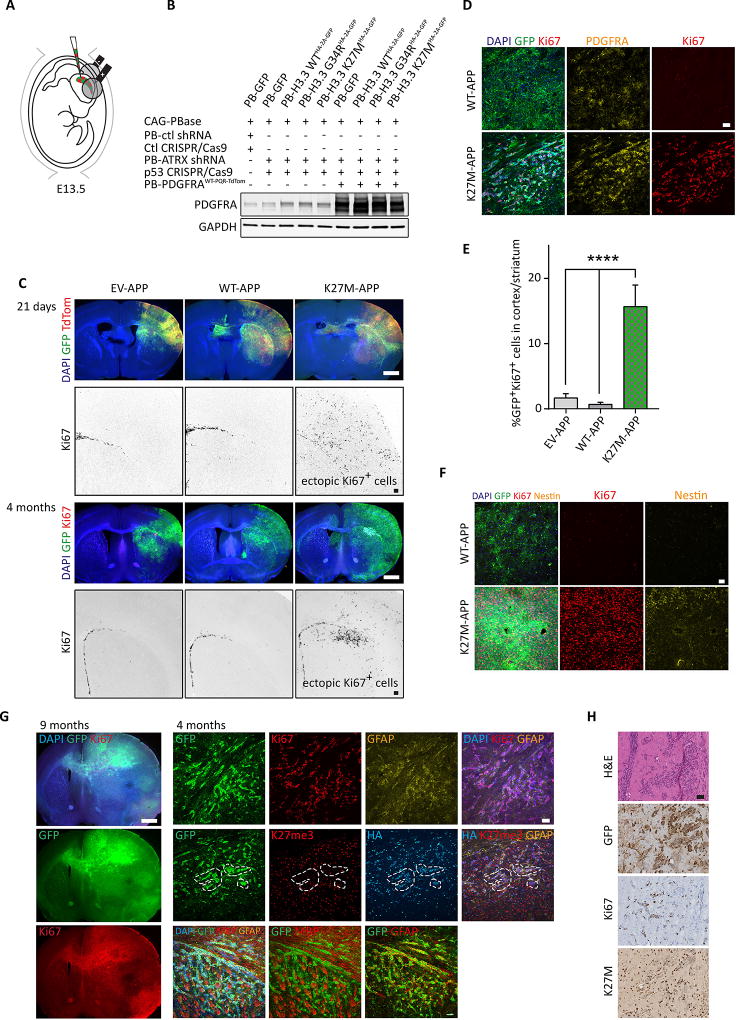
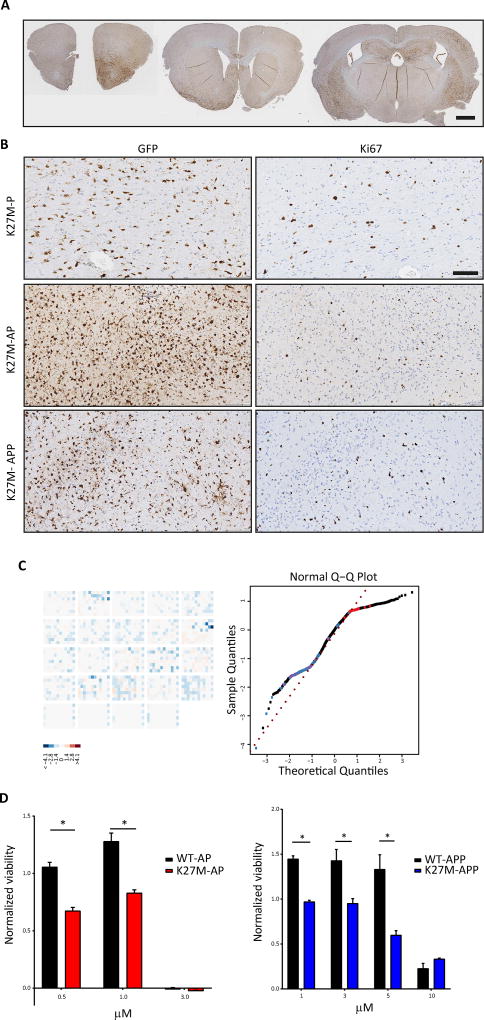
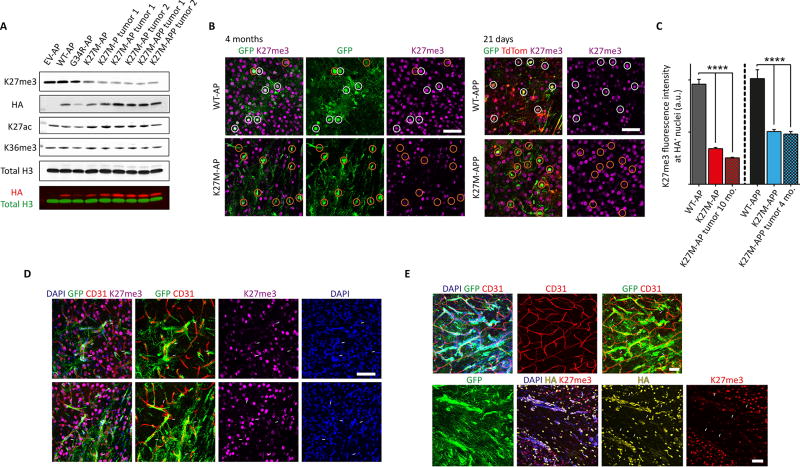
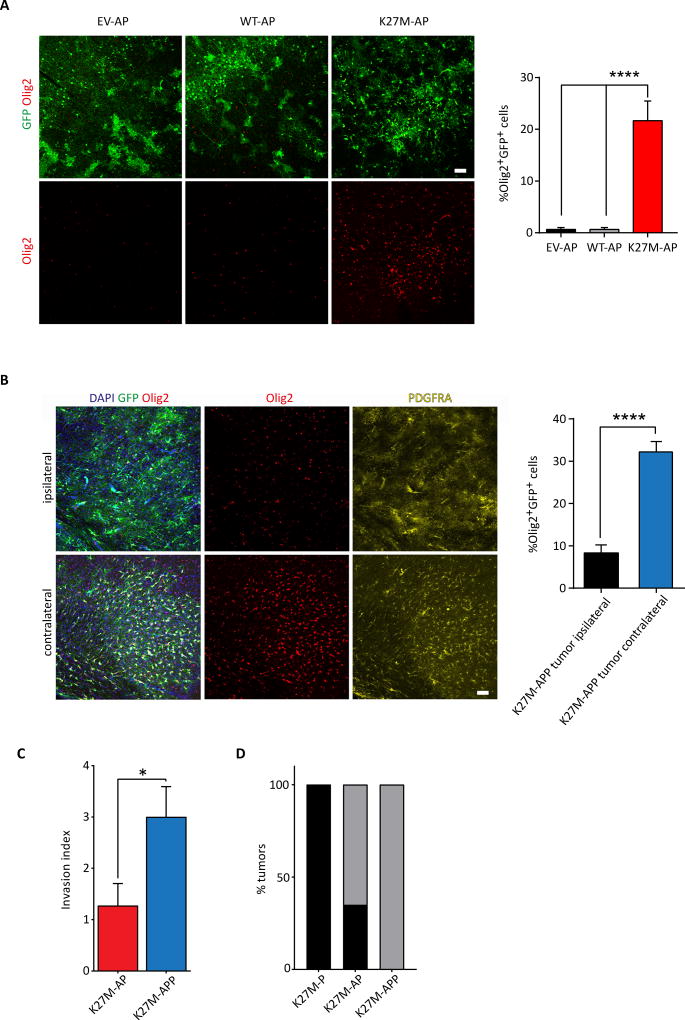
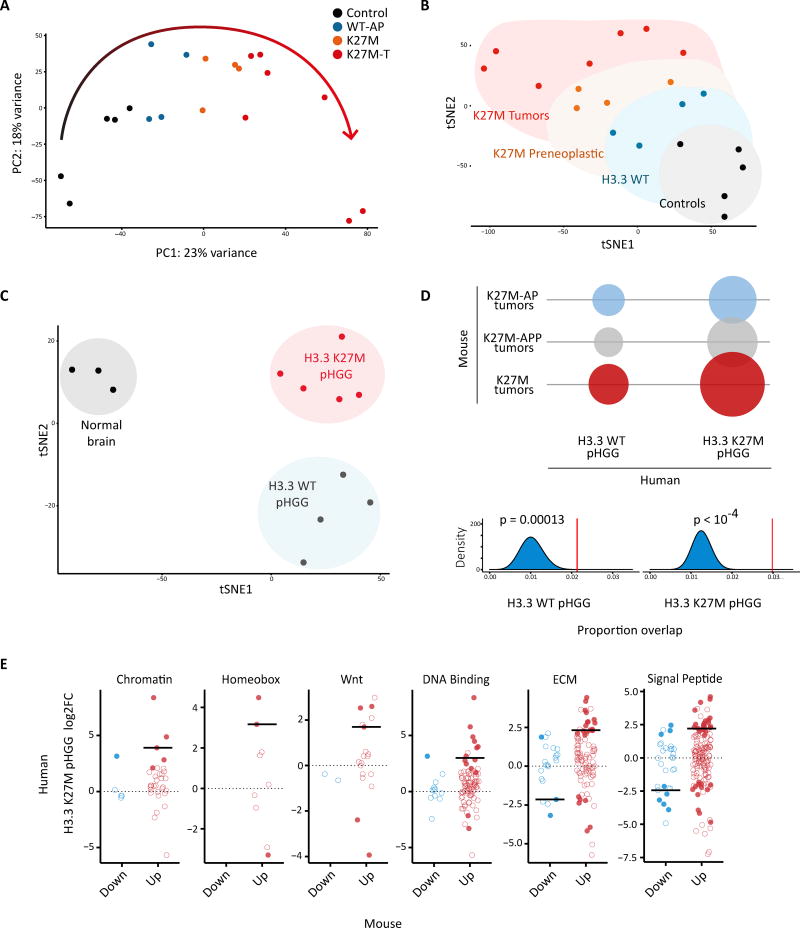
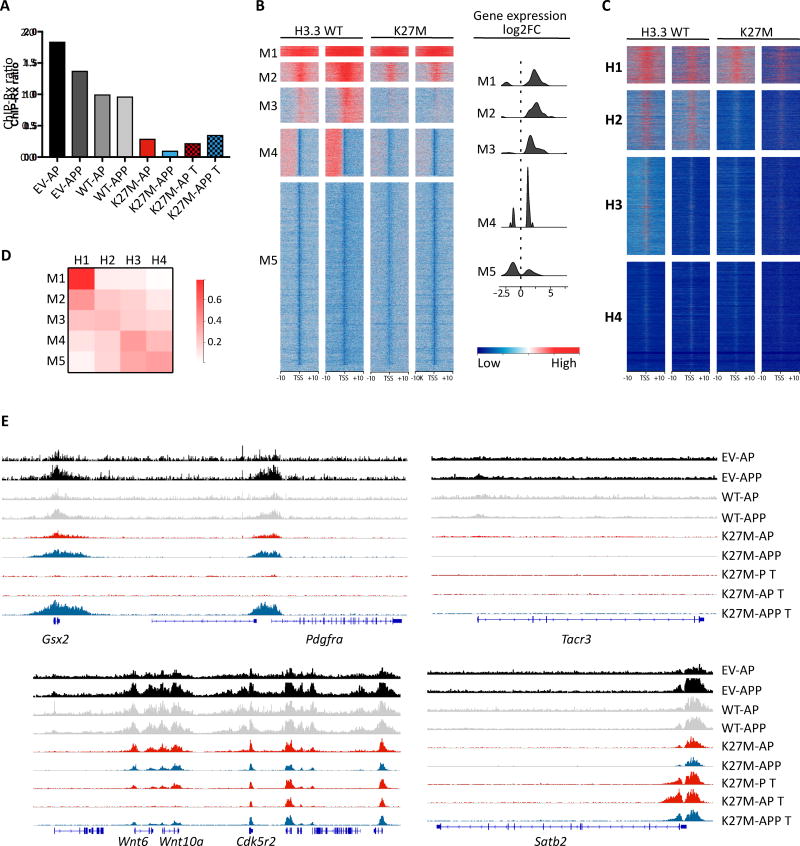
Gain-of-function mutations in histone 3 (H3) variants are found in a substantial proportion of pediatric high-grade gliomas (pHGG), often in association with TP53 loss and platelet-derived growth factor receptor alpha (PDGFRA) amplification. Here, we describe a somatic mouse model wherein H3.3K27M and Trp53 loss alone are sufficient for neoplastic transformation if introduced in utero. H3.3K27M-driven lesions are clonal, H3K27me3 depleted, Olig2 positive, highly proliferative, and diffusely spreading, thus recapitulating hallmark molecular and histopathological features of pHGG. Addition of wild-type PDGFRA decreases latency and increases tumor invasion, while ATRX knockdown is associated with more circumscribed tumors. H3.3K27M-tumor cells serially engraft in recipient mice, and preliminary drug screening reveals mutation-specific vulnerabilities. Overall, we provide a faithful H3.3K27M-pHGG model which enables insights into oncohistone pathogenesis and investigation of future therapies.

Keywords: clonal; mosaic; neurodevelopment; oncohistone; pediatric high-grade glioma.


Figures

Figure 1
Figure 1. H3.3K27M expression and Trp53 loss are able to induce tumorigenesis in both cortex and hindbrain
(A) Schematic describing the in utero electroporation strategy used to deliver piggyBac transposable-H3.3K27M and Trp53 CRISPR/Cas9 (K27M-P) into lower rhombic lip NPCs in vivo. (B) Coronal section prepared from a K27M-P hindbrain 6 months after electroporation showing immunofluorescent detection of GFP, Ki67 and DAPI. Orange arrowhead indicates GFP+Ki67+ cells in the pons, shown at higher magnification on the right. Diffusely spreading GFP+Ki67+ cells are also seen migrating dorsally within the hindbrain. Scale bars represent 100 µm (left) and 50 µm (right). (C) Histopathological analysis of a hindbrain K27M-P tumor harboring Ki67+, Olig2+ and GFAP+ cells. Scale bars represent 0.5 µm (left) and 75 µm (right). (D) Coronal view of cortical K27M-P driven tumorigenesis. 8 months following surgery GFP+Ki67+ cells are seen in cortical, ventral and contralateral locations (red arrows). Scale bars represent 1.5 mm. See also Figure S1 and Table S1.
Figure 2
Figure 2. H3.3K27M expression and knockdown of ATRX and p53 in embryonic NPCs leads to tumorigenesis in postnatal animals
(A) Schematic describing the in utero electroporation strategy used to deliver piggyBac transposable-empty vector, H3.3WT or H3.3K27M along with ATRX shRNA and Trp53 CRISPR/Cas9 (EV/WT/K27M-AP) into cortical NPCs in vivo. (B) Validation of H3.3K27M–HA expression and knockdown of ATRX and p53 in ex vivo NPCs sorted and expanded 3 days following electroporation. (C) Coronal sections of EV-AP, WT-AP and two biological replicates of K27M-AP brains prepared 4 months following electroporation showing immunofluorescent detection of GFP, Ki67 and DAPI. GFP+Ki67+ cells in the cortex are indicated with an orange arrowhead, and contralaterally or ventrally migrating GFP+Ki67+ cells are indicated by the red arrows. Scale bars represent 1 mm. (D) Immunofluorescent overlap between GFP+, Ki67+ and Nestin+ cells in EV-AP, WT-AP and K27M-AP brains (two separate biological replicates shown for K27M-AP) 4 months following electroporation. Scale bars represent 50 µm. (E) Quantification of GFP+Ki67+ cells in EV-AP, WT-AP and K27M-AP electroporated brains at 4 months. Data are represented as mean ± SEM. (F) K27M-AP tumor appearance and immunofluorescence analysis, as depicted, at 9 months following electroporation. Scale bars represent 1.5 mm (left) and 50 µm (right). (G) Histology of K27M-AP tumors in comparison to a WT-AP electroporated brain. Scale bars represent 1 mm (top) and 100 µm (bottom). *p<0.05, **p<0.01, ****p<0.0001. See also Figure S2; Tables S1 and S2.
Figure 3
Figure 3. Addition of PDGFRAWT overexpression to H3.3K27M and ATRX/p53 KD results in shorter latency of tumorigenesis
(A) Schematic describing the in utero electroporation strategy used to deliver piggyBac transposable-empty vector, H3.3WT or H3.3K27M along with PDGFRAWT, ATRX shRNA and Trp53 CRISPR/Cas9 (EV/WT/K27M-APP) into cortical NPCs in vivo. (B) Validation of PDGFRAWT overexpression in ex vivo NPCs sorted and expanded 3 days following electroporation. (C) Coronal sections of EV-APP, WT-APP and K27M-APP brains prepared 21 days and 4 months following electroporation showing immunofluorescent detection of GFP, TdTomato, Ki67 and DAPI. Scale bars represent 1.5 mm (multi-color panels) and 200 µm (black-and-white panels). (D) Immunofluorescent overlap between GFP+, Ki67+ and PDGFRA in WT-APP and K27M-APP brains. Scale bars represent 50 µm. (E) Quantification of GFP+Ki67+ cells in EV-APP, WT-APP and K27M-APP electroporated brains at 4 months. Data are represented as mean ± SEM. (F) Comparison of Ki67 and Nestin immunofluorescence levels in WT-APP and K27M-APP at 9 months following surgery. Scale bars represent 50 µm. (G) Left: low magnification view of K27M-APP tumors at 9 months. Right: immunofluorescence analysis of K27M-APP tumors, as depicted, 4 months following surgery. Scale bars represent 1.5 mm (left) and 50 µm (right). (H) Histology of K27M-APP tumors. Scale bars represent 100 µm. *p<0.05, **p<0.01, ****p<0.0001. See also Figure S3 and Table S1.
Figure 4
Figure 4. Allografted K27M-P, K27M-AP and K27M-APP tumor cells generate diffusely spreading Ki67+ lesions in NOD/SCID mice, demonstrating their transformed status
(A) Low magnification view of K27M-AP tumor cell detection using GFP immunohistochemistry in recipient cortex. Scale bars represent 1 mm. (B) Higher magnification views of GFP immunohistochemistry showing regions of dorsolateral and dorsomedial frontal cortex in K27M-P, K27M-AP and K27M-APP tumor cell-injected mice. Scale bars represent 100 µm. (C) A small molecule library of 430 kinase inhibitors was applied to WT-AP, WT-APP, K27M-AP tumor and K27M-APP tumor cells, as well as EV control cells. Changes in viability are shown as a screen-wide image of z-scores (left) and a normal Q-Q plot (right). The normalized percent inhibition method was used to compare z-scores of WT-AP and K27M-AP responses, as well as the z-scores of WT-APP and K27M-APP responses. (D) Quantification of the effect of vacquinol-1 (left) and Akti-1/2 (right) on viability of K27M-AP and K27M-APP tumor cells, respectively, at a range of concentrations. Data are represented as mean ± SEM. *p<0.05, **p<0.01, ****p<0.0001. See also Figure S4 and Table S3.
Figure 5
Figure 5. K27M-AP and K27M-APP tumor cells have reduced K27me3 levels and migrate along blood vessels
(A) Acid-extracted histone preparations made from EV-AP, WT-AP and K27M-AP preneoplastic cells and K27M-P, K27M-AP and K27M-APP tumor cells were probed for K27me3, HA, K27ac, K36me3 and total H3 levels. (B) Left: representative images of K27me3 immunofluorescence in WT-AP and K27M-AP cells at 4 months following electroporation. Right: representative images of K27me3 immunofluorescence in WT-APP and K27M-APP cells at 21 days following electroporation. Cell bodies are highlighted within circles. Scale bars represent 50 µm. (C) Quantification of K27me3 immunofluorescence signal intensity in WT-AP vs K27M-AP and WT-APP vs K27M-APP. Data are represented as mean ± SEM. (D) Immunofluorescent detection of K27M-AP tumor cells, K27me3 and CD31+ blood vessels (indicated by white arrows). Scale bars represent 50 µm. (E) Top panel: immunofluorescence of K27M-APP tumor cells expressing GFP and CD31+ blood vessels (indicated by white arrows). Bottom panel: immunofluorescence of K27me3 and HA signal (indicated by white arrows) in GFP+ K27M-APP tumor cells. Scale bars represent 50 µm. *p<0.05, **p<0.01, ****p<0.0001. See also Figure S5 and Table S4.
Figure 6
Figure 6. Olig2 levels are increased in K27M-AP and K27M-APP tumor cells
(A) Representative images and quantification of Olig2+GFP+ cells in EV-AP, WT-AP and K27M-AP brains at 4 months following electroporation. Scale bars represent 50 µm. Data are represented as mean ± SEM. (B) Representative images and quantification of Olig2+GFP+ cells in ipsilateral and contralateral cortical regions of K27M-APP brains at 4 months following electroporation. PDGFRA immunofluorescence is also shown. Scale bars represent 50 µm. Data are represented as mean ± SEM. (C) Relative invasion index of K27M-APP vs K27M-AP tumor cells. Data are represented as mean ± SEM. (D) Quantification of the incidence of focal tumors correlating with ATRX loss. Chi-squared test. *p<0.05, **p<0.01, ****p<0.0001. See also Figure S6 and Table S1.
Figure 7
Figure 7. H3.3K27M-dependent transformation induces transcriptomic changes that are recapitulated in human tumors
(A) Principal component analysis (PCA) of murine samples based on transcriptome-wide expression level data is shown. Curved arrow indicates a progression in global transcriptomic patterns from the untransformed to the transformed state. Control: EV-AP/EV-APP. WT: WT-AP. K27M: K27M-AP/K27M-APP. K27M–T: K27M-AP T / K27M-APP T. (B) Two-dimensional visualization of the expression dataset was performed by t-SNE on the PCA space, using the first 50 PCs. 5,000 iterations were performed with perplexity=6 and theta=0.5. (C) t-SNE visualization of human normal brain, H3.3WT pediatric High Grade Glioma (pHGG) and H3.3K27M pHGG samples based on the expression of human orthologs of the murine K27M–T. 10,000 iterations were performed on the PCA space (first 50 PCs) with perplexity=2, theta=0. (D) Top: bubble plot summarizing the number of overlapping genes between the signatures derived from murine and human tumors. Bottom: Random expectations for the number of overlapping genes (N) with pGBM signatures were derived by iteratively sampling N genes from the human genome and computing the overlap with human tumor signatures (blue histograms, 10,000 iterations). Red vertical lines correspond to the observed overlaps (K27M–T signature). P-values indicate the probability of observing these overlaps by chance based on random expectations. (E) Gene expression changes (log2 FC) of the human orthologs of pathway-specific gene subsets extracted from the murine K27M–T signature using functional annotation in H3.3K27M pHGG with respect to normal brain are shown. Red: K27M–T upregulated genes. Blue: K27M–T downregulated genes. Filed circles: statistically significant genes. Open circles: non-significant genes. Solid line: median log2 FC of significant genes. See also Figure S7; Tables S5, S6 and S7.
Figure 8
Figure 8. K27M–induced alteration of genome-wide H3K27me3 deposition is captured by the mouse model
(A) ChIP-Rx Ratio: ratio of sequencing reads mapping to mouse genome and drosophila genome, normalized by input. (B) Heatmaps illustrating H3K27me3 levels at transcription start sites (TSSs). H3K27me3 levels in regions of 10Kb surrounding TSSs (in rows) were normalized locally on a per-sample basis (in columns), and genes were subsequently clustered by k-means (k=12) based on average H3K27me3 levels in each sample. The five gene clusters most recapitulative of human K27M tumor H3K27me3 loss are shown, alongside the magnitude of changes in expression of their constituent genes (right). Only significant gene expression changes are reported, in the form of log2 fold-change in K27M–T relative to baseline controls. H3.3 WT: EV-ctl, EV-PDGFRA. K27M: K27M-AP T /K27M-APP T. (C) Human genes were classified as in (B) into four tiers (k=4). K27me3 ChIP-Seq data was obtained from (Bender et al., 2013). A lower k was used since the lower coverage of this data set prevented a high resolution clustering of genes. Note that the number of annotated genes for mouse and human differ, and thus the heatmaps are not scaled to proportion. (D) Pairwise similarity matrix between murine (rows) and human (columns) gene clusters. Similarity was measured as the proportion of mouse genes with human orthologs present in each human cluster. (E) H3K27me3 levels found at the loci of selected genes showing increased (Pdgfra, Satb2) or decreased (Wnt6, Wnt10a, Tacr3) mark deposition. Coverage is normalized across all samples. See also Figure S8 and Table S8.

Comment in

  • Pontine Infantile Glioma Simplified.
    Ramaswamy V, Taylor MD. Ramaswamy V, et al. Cancer Cell. 2017 Nov 13;32(5):548-549. doi: 10.1016/j.ccell.2017.10.013. Cancer Cell. 2017. PMID: 29136501

References

    1. Alcantara Llaguno S, Chen J, Kwon CH, Jackson EL, Li Y, Burns DK, Alvarez-Buylla A, Parada LF. Malignant astrocytomas originate from neural stem/progenitor cells in a somatic tumor suppressor mouse model. Cancer cell. 2009;15:45–56. - PMC - PubMed
    1. Bae S, Park J, Kim JS. Cas-OFFinder: a fast and versatile algorithm that searches for potential off-target sites of Cas9 RNA-guided endonucleases. Bioinformatics. 2014;30:1473–1475. - PMC - PubMed
    1. Barbie DA, Tamayo P, Boehm JS, Kim SY, Moody SE, Dunn IF, Schinzel AC, Sandy P, Meylan E, Scholl C, et al. Systematic RNA interference reveals that oncogenic KRAS-driven cancers require TBK1. Nature. 2009;462:108–112. - PMC - PubMed
    1. Bender S, Tang Y, Lindroth AM, Hovestadt V, Jones DT, Kool M, Zapatka M, Northcott PA, Sturm D, Wang W, et al. Reduced H3K27me3 and DNA hypomethylation are major drivers of gene expression in K27M mutant pediatric high-grade gliomas. Cancer cell. 2013;24:660–672. - PubMed
    1. Bolger AM, Lohse M, Usade IB. Trimmomatic: a flexible trimmer for Illumina sequence data. Bioinformatics. 2014;30:2114–2120. - PMC - PubMed

Publication types

MeSH terms

Substances