. 2017 Nov 6;27(21):3375-3383.e3.
doi: 10.1016/j.cub.2017.09.051. Epub 2017 Oct 26.

Caudate Microstimulation Increases Value of Specific Choices

Affiliations

Caudate Microstimulation Increases Value of Specific Choices

Samantha R Santacruz et al. Curr Biol. .

Abstract

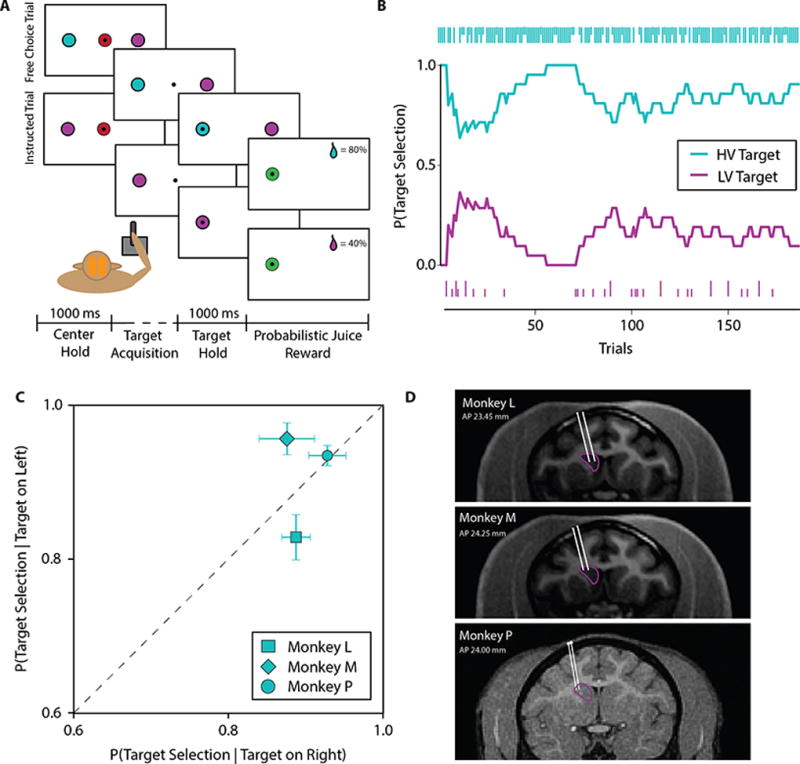
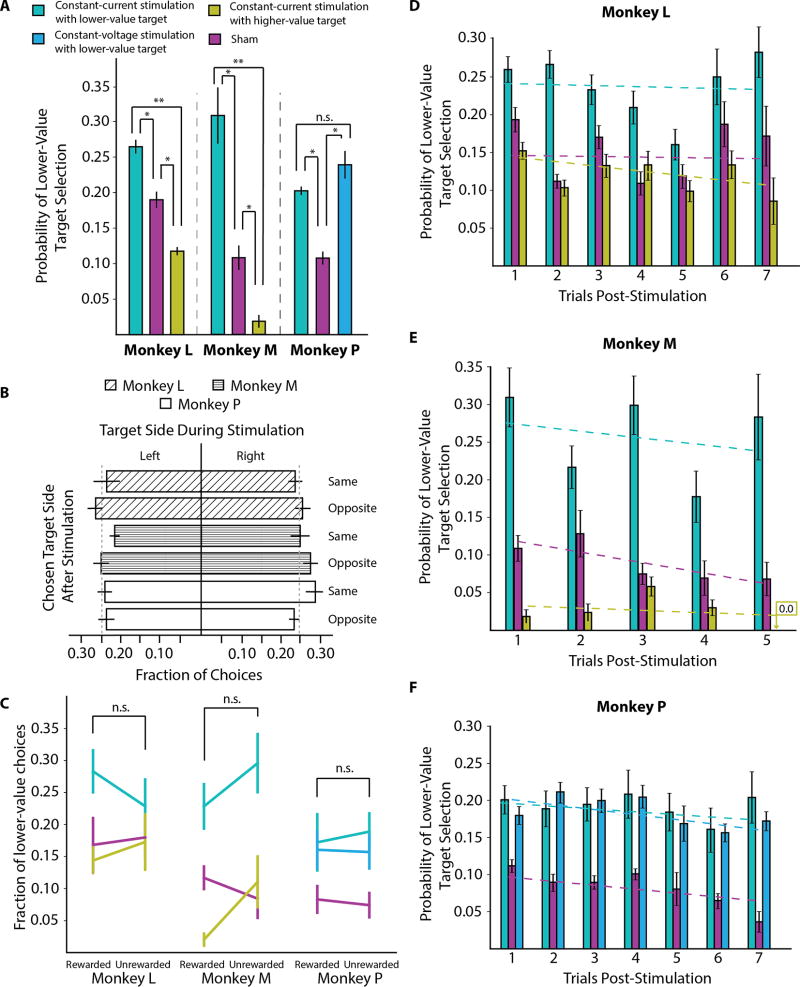
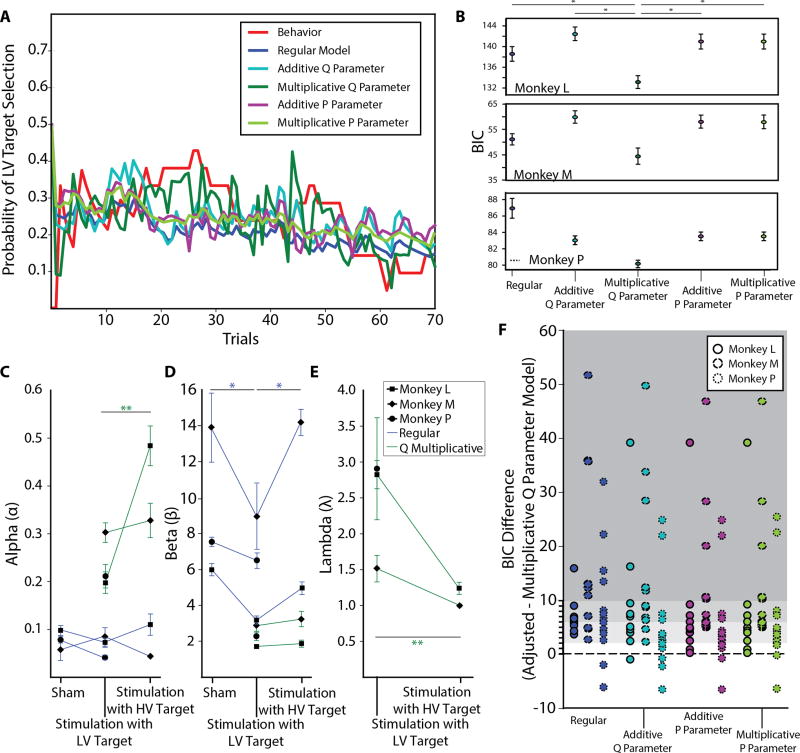
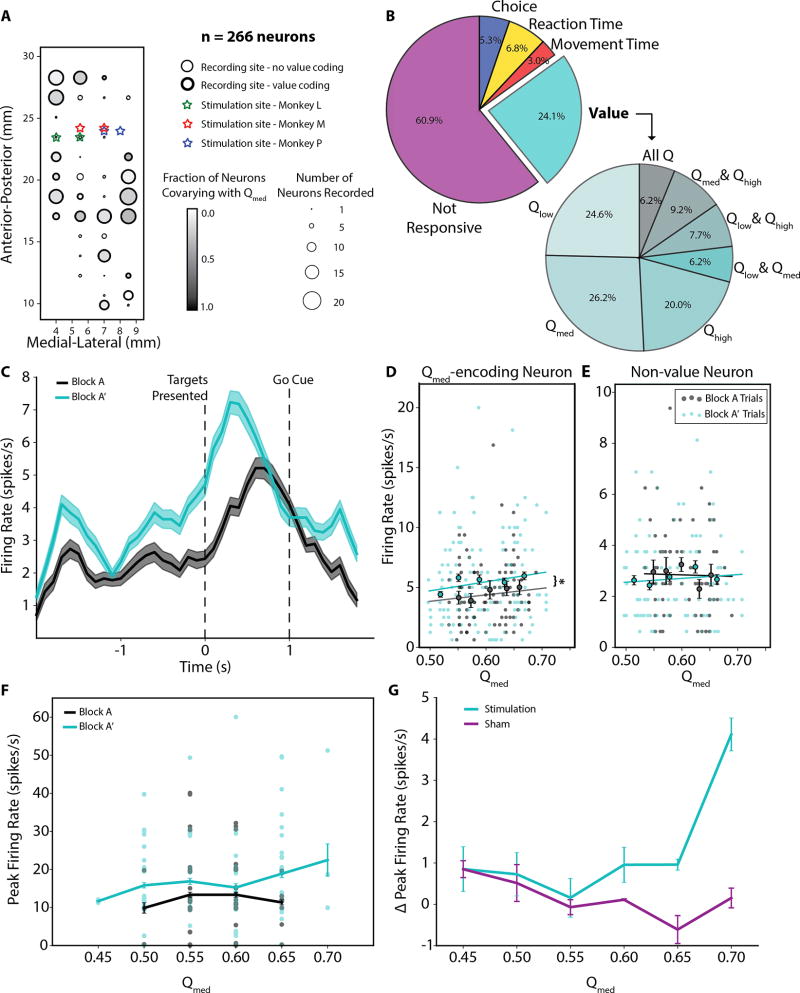
Value-based decision-making involves an assessment of the value of items available and the actions required to obtain them. The basal ganglia are highly implicated in action selection and goal-directed behavior [1-4], and the striatum in particular plays a critical role in arbitrating between competing choices [5-9]. Previous work has demonstrated that neural activity in the caudate nucleus is modulated by task-relevant action values [6, 8]. Nonetheless, how value is represented and maintained in the striatum remains unclear since decision-making in these tasks relied on spatially lateralized responses, confounding the ability to generalize to a more abstract choice task [6, 8, 9]. Here, we investigate striatal value representations by applying caudate electrical stimulation in macaque monkeys (n = 3) to bias decision-making in a task that divorces the value of a stimulus from motor action. Electrical microstimulation is known to induce neural plasticity [10, 11], and caudate microstimulation in primates has been shown to accelerate associative learning [12, 13]. Our results indicate that stimulation paired with a particular stimulus increases selection of that stimulus, and this effect was stimulus dependent and action independent. The modulation of choice behavior using microstimulation was best modeled as resulting from changes in stimulus value. Caudate neural recordings (n = 1) show that changes in value-coding neuron activity are stimulus value dependent. We argue that caudate microstimulation can differentially increase stimulus values independent of action, and unilateral manipulations of value are sufficient to mediate choice behavior. These results support potential future applications of microstimulation to correct maladaptive plasticity underlying dysfunctional decision-making related to neuropsychiatric conditions.

Keywords: caudate; decision-making; macaque monkey; microstimulation; reinforcement learning; striatum; value.


Figures

Figure 1
Figure 1. Experimental setup and behavioral task
(A) Cartoon depicting the two different trial types encountered by the subject in the probabilistic reward choice task. Note that the target colors randomly alternate sides of presentation, so that the subjects must learn to associate color, not spatial location, with reward probability. (B) Representative choice behavior during free-choice trials. The main plot shows the empirical probability of selecting each target over a sliding window of 20 trials. The small bars on the top and bottom portions of the screen indicate whether a reward was give or not when each target was chosen. Short bars indicate the absence of reward and long bars indicate presence of reward. (C) Conditional probabilities of selecting the higher-value (HV) target given that it was presented on either the left or right side of the screen. Selection agnostic to spatial location would lie on the identity line, shown as a dashed line in the plot. Results shown are from sham sessions for all subjects. (D) Microelectrode positions superimposed on MR images for each subject. The caudate is outlined in magenta and microelectrode trajectories are marked in white.
Figure 2
Figure 2. Microstimulation results
(A) The probability of selecting the lower-value target on free-choice trials. (B) Fraction of times of target presentation on a given side during the instructed trial with stimulation and the selection of a target on the same or opposite side in the subsequent free-choice trial. (C) Fraction of lower-value target choices on free-choice trial following a stimulation trial that was either rewarded or unrewarded. (D) The probability of selecting the lower-value target on free-choice trials aligned to their latency following the forced-choice trial with stimulation for Monkey L (interaction effect: F8,135 = 0.507, p = 0.849, main effect of stimulation condition: F2,135 = 4.959, p = 0.008, main effect of trial latency from stimulation: F4,135 = 1.535, p = 0.196; two-way ANOVA), (E) for Monkey M (interaction effect: F8,161 = 0.470, p = 0.876, main effect of stimulation condition: F2,161 = 21.798, p < 0.001, main effect of trial latency from stimulation: F4,161 = 0.453, p = 0.770), and (F) for Monkey P (interaction effect: F8,185 = 0.281, p = 0.972, main effect of stimulation condition: F2,185 = 12.125, p < 0.001, main effect of trial latency: F4,185 = 0.490, p = 0.743; two-way ANOVA). Significant differences are indicated as: n.s. (not significant), ** (p < 0.01), and * (p < 0.05).
Figure 3
Figure 3. Computational model fitting
(A) Representative model fits for the regular and adjusted Q-learning algorithms with a soft-max decision rule. Results are plotted along with the raw behavior of the subject which is averaged over a sliding window of 20 trials. (B) Session-averaged BIC values for the regular and adjusted Q-learning candidate models. (C)–(E) Average Q-learning parameters averaged across sessions. The inverse temperature, β, was significantly different across conditions for the regular Q-learning model (main effect of stimulation condition: F2,27 = 6.247, p < 0.01 for Monkey L; F2,21 = 9.563, p< 0.01 for Monkey M; F2,30 = 7.379, p < 0.01 for Monkey P; one-way MANOVA). (F) The difference between BIC values per session for the various adjusted models (including the regular unadjusted model) and the model with the value update equation modified to include a multiplicative parameter capturing the effect of stimulation. Gray shadings indicate preference for the multiplicative Q parameter modification, with a BIC difference in the range 2 – 6 indicating a positive preference, 6 – 10 indicating a strong preference, and > 10 indicating a very strong preference. Significant differences are indicated as: n.s. (not significant), ** (p < 0.01), and * (p < 0.05) using post-hoc Tukey’s HSD.
Figure 4
Figure 4. Neural correlates of value changes
(A) Recording locations for Monkey M and stimulation locations for all subjects. A totally of 266 task-related caudate neurons were recorded. Medial-lateral coordinate values are presented from midline, while Anterior-Posterior coordinates are presented relative to the interaural line. The marker size indicates the number of neurons sampled per site, while the marker outline indicates if any neuron recorded at the location significantly co-varied with stimulus value. The shading of the marker indicates the proportion of neurons that particularly co-varied with the value Qmed. (B) Pie chart on left shows the neurons (n = 266) categorized into five main types based on the linear regression analysis. The pie chart on the right expands upon the number of Value neurons to demonstrate the frequency in which neurons were responsive to three different values, Qlow, Qmed, and Qhigh, and combinations thereof. (C) Average firing rate of a representative Qmed-value coding caudate neuron during Blocks A and A’. Activity is taken only from trials in which Qmed was associated with the lower-value target, i.e. when the medium-value and high-value targets were presented together. Only the last 100 trials in Block A, after initial learning, are considered so that firing rate changes are not dominated by effects of learning. (D) The firing rate during picture onset as a function of the modeled value Qmed is shown for the same representative neuron. Each marker represents the per trial firing rate in the window [0,400) ms from when the targets are presented, while the lines represent the linear fit of firing rate as a function of value given by the linear regression. The slopes of the linear regression fits were not significantly different (mBlock A = 6.279, mBlock A’ = 8.573, t-value = 1.263, p = 0.21), but there was a significant difference of 0.962 in the y-intercept (t-value = 2.213, p = 0.028). This suggests that there is a significant increase in firing rate during Block A’ for all Q-values. Circles with error bars represent the trial-averaged firing rates for each of 5 equally populated stimulus value bins. Again, only the last 100 trials in Block A are used for comparison so that firing rate changes are not dominated by effects of learning. (E) Similar data as shown in Figure 2D for a representative non-value coding neuron from the same recording session. The linear regression coefficients were not significant (p > 0.05 for both blocks), indicating firing rate was not significantly modulated by stimulus value in either block. (F) The peak firing rate during picture onset as a function of the modeled value is shown for the same representative stimulus value-coding neuron for Blocks A (late trials only) and A’. (G) The difference in peak firing rate between Blocks A’ and A averaged across all value-coding neurons (n = 64). The peak firing rate was taken from the window [0,400) ms from target presentation. Only the last 100 trials in Block A are used for comparison so that firing rate changes are not dominated by effects of learning. A two-way ANOVA finds that there are significant main effects (stimulation condition: F1,69 = 4.17, p < 0.05; stimulus value: F5,69 = 2.53, p < 0.05), as well as a significant interaction effect between stimulation condition and value (F5,69 = 4.98, p < 0.01).

References

    1. Gremel CM, Costa RM. Orbitofrontal and striatal circuits dynamically encode the shift between goal-directed and habitual actions. Nat. Commun. 2013;4:2264. - PMC - PubMed
    1. Hikosaka O, Nakamura K, Nakahara H. Basal Ganglia Orient Eyes to Reward. J Neurophysiol. 2006;95:567–584. - PubMed
    1. Redgrave P, Rodriguez M, Smith Y, Rodriguez-Oroz MC, Lehericy S, Bergman H, Agid Y, DeLong MR, Obeso JA. Directed and habitual control in the basal ganglia : implications for Parkinson ’ s disease. Nat. Rev. Neurosci. 2010;11:760–772. - PMC - PubMed
    1. Yin HH, Knowlton BJ. The role of the basal ganglia in habit formation. Nat. Rev. Neurosci. 2006;7:464–476. - PubMed
    1. Kravitz AV, Tye LD, Kreitzer AC. Distinct roles for direct and indirect pathway striatal neurons in reinforcement. Nat. Neurosci. 2012;15:816–818. - PMC - PubMed