. 2017 Nov 6;12(11):e0186924.
doi: 10.1371/journal.pone.0186924. eCollection 2017.

Treatment with proteasome inhibitor bortezomib decreases organic anion transporting polypeptide (OATP) 1B3-mediated transport in a substrate-dependent manner

Affiliations

Treatment with proteasome inhibitor bortezomib decreases organic anion transporting polypeptide (OATP) 1B3-mediated transport in a substrate-dependent manner

Khondoker Alam et al. PLoS One. .

Abstract

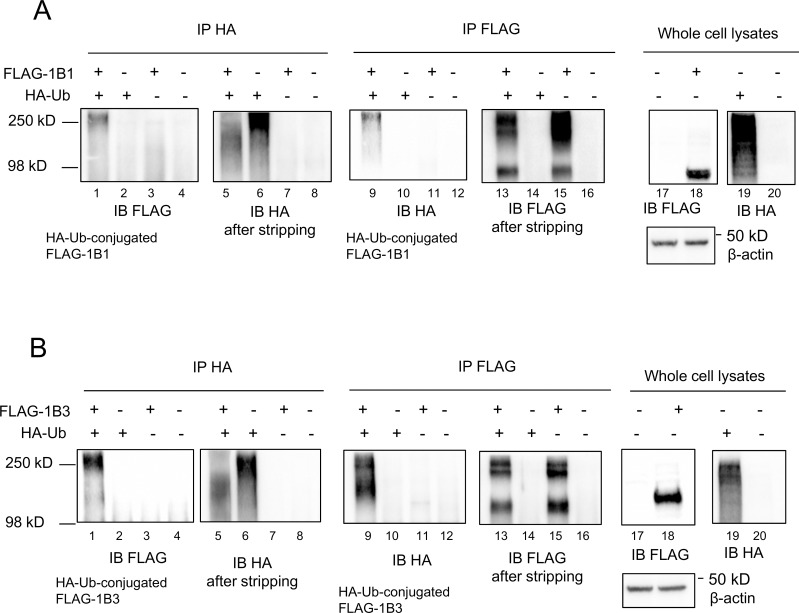
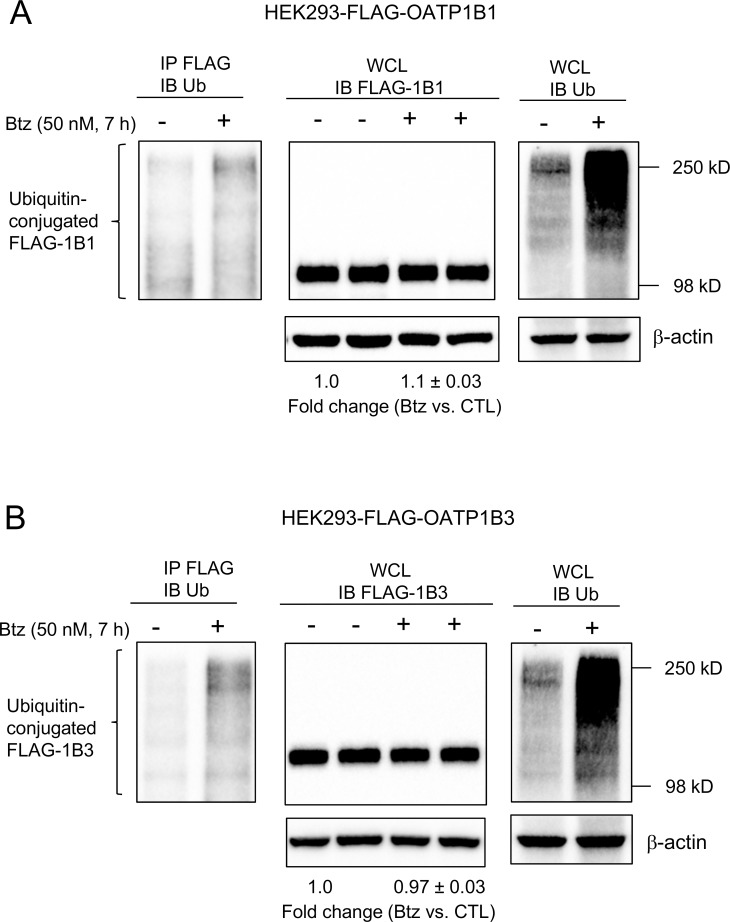
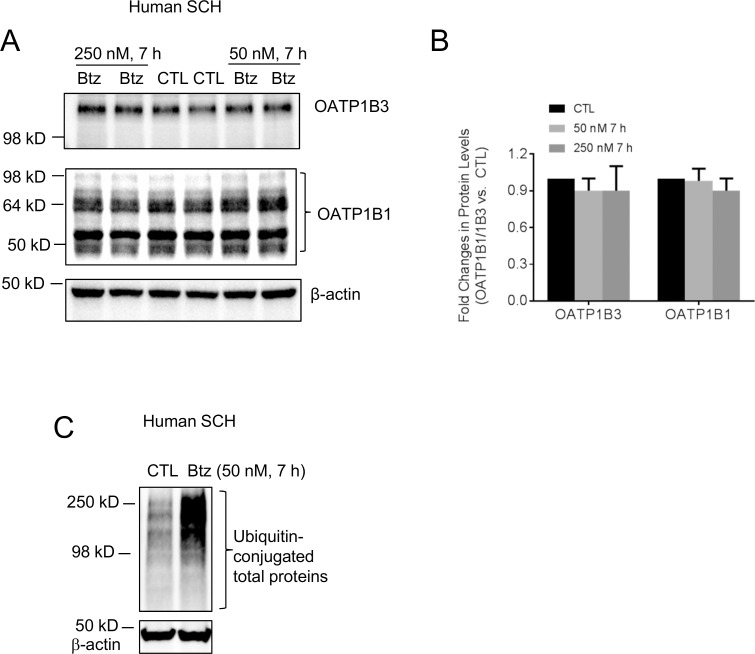
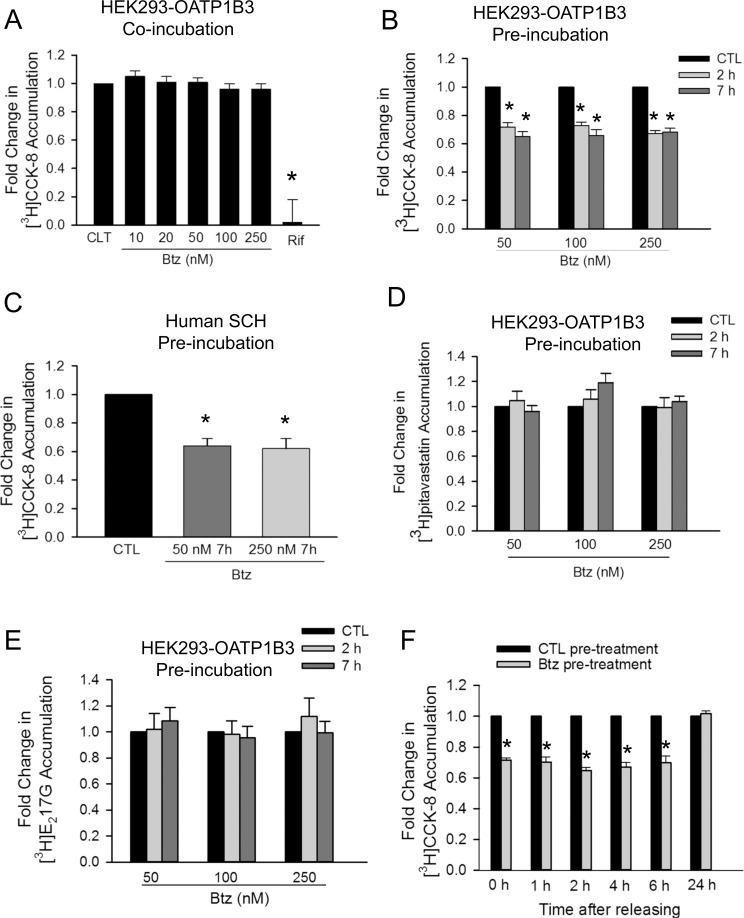
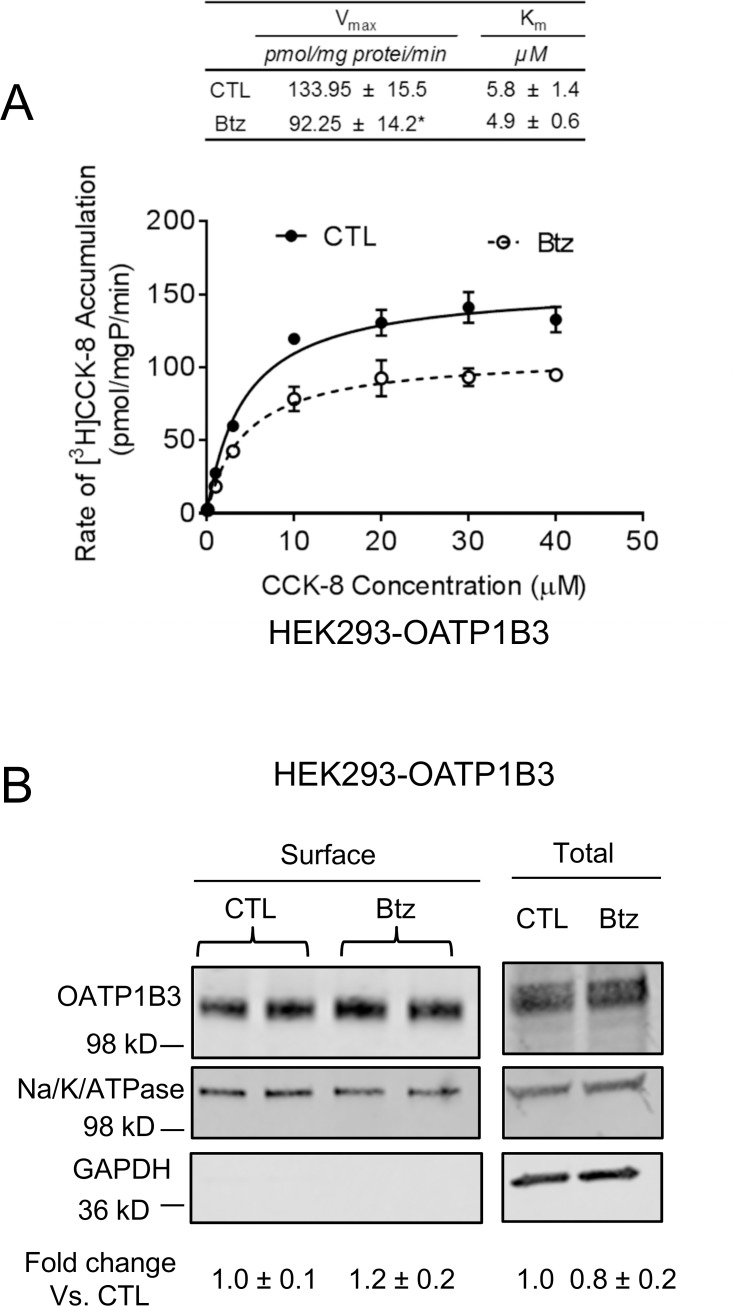
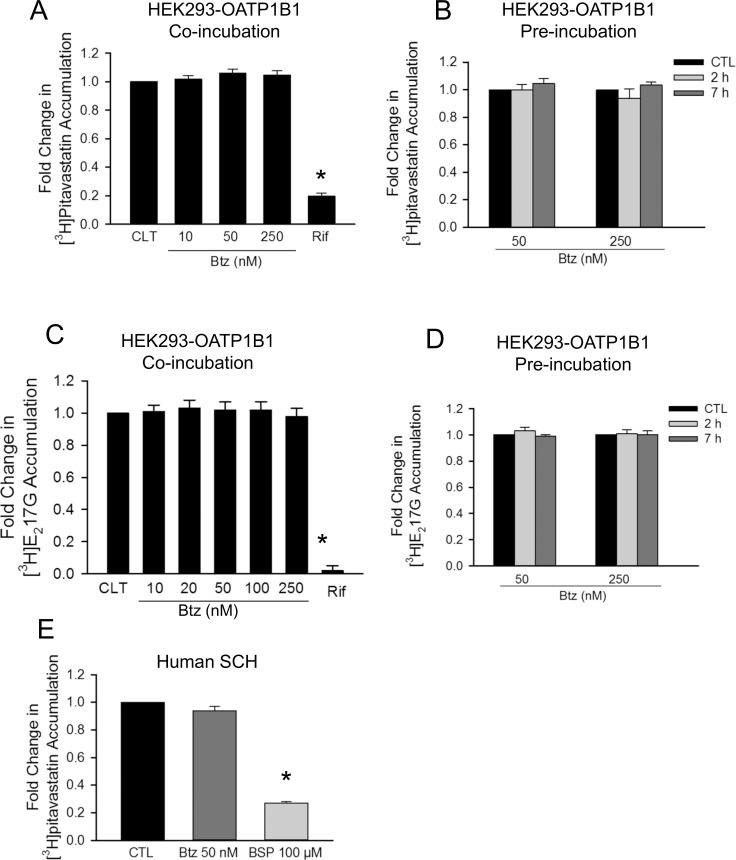
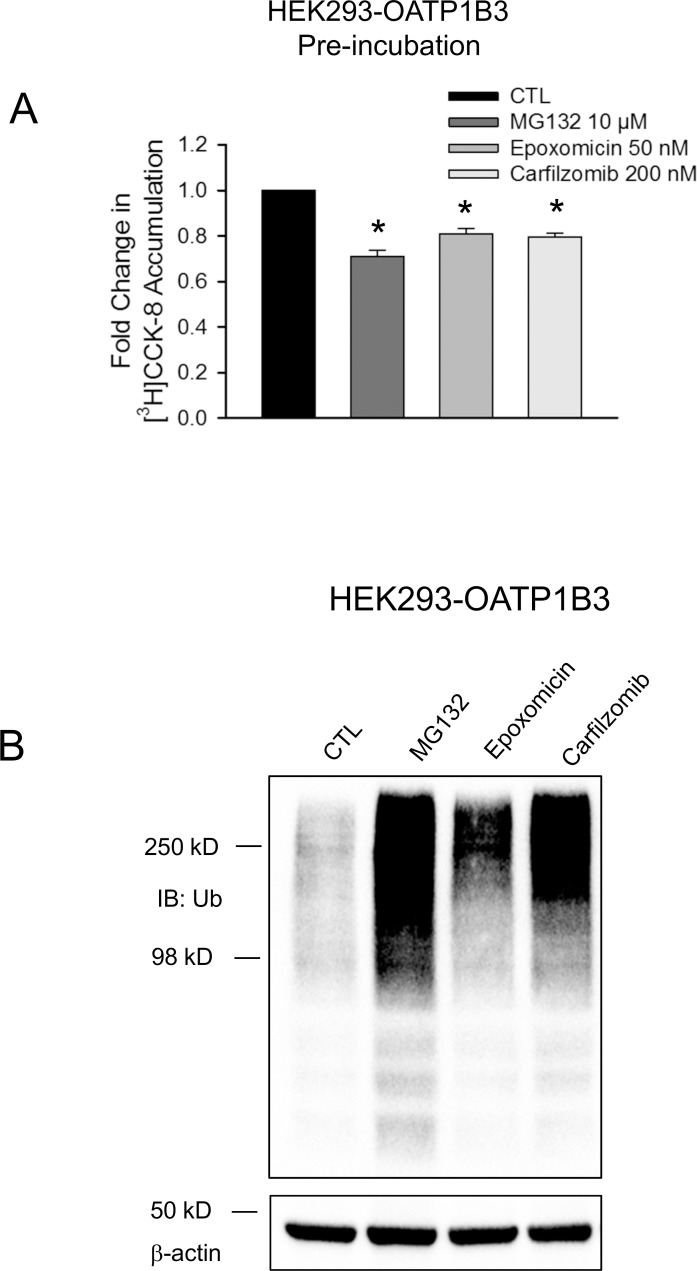
OATP1B1 and OATP1B3 mediate hepatic uptake of many drugs (e.g., statins) and can mediate transporter-mediated drug-drug-interactions (DDIs). Bortezomib is the first-in-class proteasome inhibitor drug approved by the U. S. Food and Drug Administration for the treatment of multiple myeloma. The potential of bortezomib to cause OATP-mediated DDIs has not been assessed. The current study investigated the involvement of the ubiquitin-proteasome system (UPS) in OATP1B1 and OATP1B3 degradation and determined the effects of proteasome inhibitors on OATP1B1- and OATP1B3-mediated transport. Co-immunoprecipitation of FLAG-OATP1B1/1B3 and HA-ubiquitin was observed in human embryonic kidney (HEK) 293 cells co-transfected with FLAG-tagged OATP1B1/OATP1B3 and hemagglutinin (HA)-tagged ubiquitin, suggesting that OATP1B1 and OATP1B3 can be ubiquitin-modified. Although blocking proteasome activity by bortezomib treatment (50 nM, 7 h) increased the endogenous ubiquitin-conjugated FLAG-OATP1B1 and FLAG-OATP1B3 in HEK293-FLAG-OATP1B1 and-OATP1B3 cells, such treatment did not affect the total protein levels of OATP1B1 and OATP1B3, suggesting that the UPS plays a minor role in degradation of OATP1B1 and OATP1B3 under current constitutive conditions. Pretreatment with bortezomib (50-250 nM, 2-7 h) significantly decreased transport of [3H]CCK-8, a specific OATP1B3 substrate, in HEK293-OATP1B3 and human sandwich-cultured hepatocytes (SCH). However, bortezomib pretreatment had negligible effects on the transport of [3H]E217βG and [3H]pitavastatin, dual substrates of OATP1B1 and OATP1B3, in HEK293-OATP1B1/1B3 cells and/or human SCH. Compared with vehicle control treatment, bortezomib pretreatment significantly decreased the maximal transport velocity (Vmax) of OATP1B3-mediated transport of CCK-8 (92.25 ± 14.2 vs. 133.95 ± 15.5 pmol/mg protein/min) without affecting the affinity constant (Km) values. Treatment with other proteasome inhibitors MG132, epoxomicin, and carfilzomib also significantly decreased OATP1B3-mediated [3H]CCK-8 transport. In summary, the current studies for the first time report ubiquitination of OATP1B1 and OATP1B3 and the apparent substrate-dependent inhibitory effect of bortezomib on OATP1B3-mediated transport. The data suggest that bortezomib has a low risk of causing OATP-mediated DDIs.


Conflict of interest statement

Competing Interests: The authors have declared that no competing interests exist.

Figures

Fig 1
Fig 1. Co-immunoprecipitation of FLAG-OATP1B1/OATP1B3 with HA-Ub.
pCMV6-FLAG-OATP1B1 (A) or pCMV6-FLAG-OATP1B3 (B) vectors were transfected into HEK293 cells, either alone or in combination with HA-Ub expression vector. Transfection with empty vector pCMV6 served as the vehicle control in all experiments. Whole cell lysates (WCL) were subjected to immunoprecipitation (IP) with HA or FLAG antibody, followed by immunoblotting (IB) with FLAG or HA antibody, respectively. After stripping, the same blot was re-probed with HA or FLAG antibody, as indicated in the figure. Immunoblots of HA and FLAG were also conducted using WCL with β-actin serving as the loading control. Representative immunoblot images from n = 3 independent experiments are shown.
Fig 2
Fig 2. Effects of bortezomib on the ubiquitination and total protein levels of FLAG-OATP1B1 and FLAG-OATP1B3 in HEK293-FLAG-OATP1B1 and HEK293-FLAG-OATP1B3 cell lines.
HEK293-FLAG-OATP1B1 and–FLAG-OATP1B3 stable cell lines were seeded at a density of 3x10⁶ cells per 100-mm2 dish. After culturing for 48 h, cells were treated with bortezomib (Btz) (50 nM, 7 h) or vehicle control (CTL). Whole cell lysates (WCL) (500 μg) from HEK293-FLAG-OATP1B1 (A, left panel) and HEK293-FLAG-OATP1B3 (B, left panel) were subjected to immunoprecipitation (IP) with FLAG antibody, followed by immunoblotting with ubiquitin antibody. Immunoblots of FLAG (A and B, middle panels) and ubiquitin (right panels of A and B) were conducted using whole cell lysates (50 μg) of HEK293-FLAG-OATP1B1 (A) and HEK293-FLAG-OATP1B3 (B) cells treated with bortezomib (50 nM, 7 h) or vehicle control. β-actin served as the loading control. FLAG-OATP1B1 and FLAG-OATP1B3 protein levels determined by densitometry were normalized to levels of β-actin. Fold changes of total protein levels in bortezomib-treated cells vs. CTL were expressed as mean ± SD. Representative images from n = 3 independent experiments are shown.
Fig 3
Fig 3. Effects of bortezomib on total OATP1B1 and OATP1 B3 protein levels and total ubiquitin-conjugated proteins in human SCH.
Human SCH were cultured as described in the Materials and Methods section. (A) Immunoblot of OATP1B3 and OATP1B1 in whole cell lysates of human SCH that were treated with bortezomib (Btz) (50 and 250 nM) or vehicle control (CTL). β-actin served as the loading control. Representative images are shown from n = 3 and 4 donors for 50 and 250 nM treatment, respectively. (B) Fold changes of OATP1B1 and OATP1B3 protein levels. Densitometry of OATP1B1 and OATP1B3 protein levels was normalized to that of β-actin. Fold changes of total protein levels of OATP1B1 and OATP1B3 in bortezomib-treated cells vs. CTL were expressed as mean ± SD n = 3 and 4 donors for 50 and 250 nM treatment, respectively. (C) Immunoblot of ubiquitin in whole cell lysates of human SCH treated with bortezomib (Btz) (50 nM, 7 h) or vehicle control. β-actin served as the loading control. Representative images are shown from n = 3 donors.
Fig 4
Fig 4. Effects of lysosome inhibitor chloroquine on total protein levels of OATP1B3 in HEK293-OATP1B3 cells and human SCH.
HEK293-OATP1B3 cells were seeded in 24-well plates at a density of 1.2 x 10⁵ cells/well and were cultured for 48 h prior to treatment. Human SCH were cultured as described in the Materials and Methods section. Cells were pretreated with chloroquine (CQ) (25 μM, 5 h) or vehicle control (CTL) prior to immunoblotting for OATP1B3 in HEK293-OATP1B3 cells (A) and in day 1 human SCH (B). β-actin served as the loading control in both A and B. OATP1B3 protein levels determined by densitometry were normalized to levels of β-actin. Fold changes of total protein levels of OATP1B3 in chloroquine (CQ) -treated cells vs. vehicle control treatment (CTL) were expressed as mean ± SD (n = 3).
Fig 5
Fig 5. Effects of bortezomib on OATP1B3-mediated transport.
(A) Model-estimated fold change and associated SE of [3H]CCK-8 accumulation (1 μM, 3 min) in the presence of 10–250 nM bortezomib (Btz) or 25 μM rifampicin (Rif) vs. control (CTL) in HEK293-OATP1B3 cells without any pre-incubation (Co-incubation). (B) Model-estimated fold change and associated SE of [3H]CCK-8 accumulation (1 μM, 3 min) in HEK293-OATP1B3 cells pretreated with bortezomib (Btz) vs. vehicle CTL at each indicated pretreatment concentration and time (Pre-incubation). After pretreatment, cells were washed three times with the HBSS buffer, and the [3H]CCK-8 accumulation was determined in the absence of bortezomib. (C) Model-estimated fold change and associated SE of [3H]CCK-8 accumulation (1 μM, 3 min) in human SCH pretreated with bortezomib (Btz) (50 and 250 nM, 7 h) vs. vehicle CTL. After pretreatment, cells were washed three times with the HBSS buffer, and the [3H]CCK-8 accumulation was determined in the absence of bortezomib. Model-estimated fold change and associated SE of OATP1B3-mediated [3H]pitavastatin (1 μM, 1 min) (D) and [3H]E217βG accumulation (1 μM, 2 min) (E) in bortezomib pretreatment vs. vehicle CTL at each indicated pretreatment concentration and time (Pre-incubation). In D and E, HEK293-OATP1B3 and HEK293-Mock cells were pretreated with vehicle control (CTL) or bortezomib at the indicated concentrations and time. After washing with the HBSS buffer, OATP1B3-mediated [3H]pitavastatin (D) and [3H]E217βG accumulation (E) was determined by subtracting the values determined in the HEK293-Mock cells from those in HEK293-OATP1B3 cells. (F) Model-estimated fold change and associated SE in [3H]CCK-8 accumulation (1 μM, 3 min) vs. CTL. Cells were pre-incubated with bortezomib-free (CTL) or 50 nM bortezomib-containing media for 2 h. At the end of pre-incubation, the culture medium was removed. After washing, CTL- and bortezomib-pretreated cells were cultured in bortezomib-free medium for the indicated time duration. [3H]CCK-8 (1 μM, 3 min) accumulation was determined at the indicated time points after washing three times (n = 3 in triplicate). A generalized linear mixed model was fit to the data in A-F as described in the “Materials and Methods” (n = 3 for A, D-F; n = 6 for B; n = 5 for C; all experiments were performed in triplicate). To account for multiple comparisons, p-values were adjusted based on the Bonferroni method. * indicates a statistically significant difference (adjusted p<0.05) vs. CTL.
Fig 6
Fig 6. Effects of bortezomib treatment on the transport kinetics of CCK-8 and surface protein levels of OATP1B3 in HEK293-OATP1B3 cells.
HEK293-OATP1B3 cells were seeded at a density of 1.2 x 10⁵ cells/well in 24-well plates, and were cultured for 48 h prior to performing the experiment. (A) The concentration-dependent accumulation of CCK-8 (0.1–40 μM, 3 min) was determined in HEK293-OATP1B3 cells pretreated with control (CTL) or bortezomib (Btz) (50 nM, 7 h). Solid and dashed lines represent the best fit lines of the Michaelis–Menten equation to the data of vehicle control (CTL) (closed circles) and bortezomib (Btz) pretreatment (open circles), respectively. A representative graph of three independent experiments performed in triplicate is shown. The student’s t-test was conducted to compare the Vmax and Km values between bortezomib and vehicle control pretreatment. * indicates a statistically significant difference (p<0.05; bortezomib vs. CTL). (B) HEK293-OATP1B3 cells were pretreated with 50 nM bortezomib (Btz) or vehicle control (CTL) for 7 h. Surface levels of OATP1B3 were determined via biotinylation, followed by immunoblotting with OATP1B3 and Na-K-ATPase antibodies. GAPDH was used as a cytoplasmic protein marker. OATP1B3 surface protein levels were determined by densitometry and were normalized to those of Na-K-ATPase. Fold changes in the surface levels of OATP1B3 (bortezomib vs. CTL) were expressed as mean ± SD of three independent experiments.
Fig 7
Fig 7. Effects of bortezomib on OATP1B1-mediated [3H]pitavastatin and [3H]E217βG transport in HEK293-OATP1B1 cells and on [3H]pitavastatin accumulation in human SCH.
HEK293-OATP1B1 cells were seeded at a density of 1.2 x 10⁵ cells/well in a 24-well plate and were cultured to confluence. Human SCH were cultured as described in the “Materials and Methods”. (A) Model-estimated fold change and associated SE in [3H]pitavastatin accumulation (1 μM, 0.5 min) in the presence of 10–250 nM bortezomib (Btz) or 25 μM rifampicin (Rif) vs. vehicle control (CTL) in HEK293-OATP1B1 cells (Co-incubation). (B) Model-estimated fold change and associated SE in [3H]pitavastatin accumulation (1 μM, 0.5 min) in HEK293-OATP1B1 cells pretreated with bortezomib (Btz) vs. vehicle control (CTL) at each indicated time and concentration (Pre-incubation). Following pretreatment, cells were washed three times with HBSS buffer, and the [3H]pitavastatin accumulation was determined in the absence of bortezomib. (C) Model-estimated fold change and associated SE in [3H]E217βG accumulation in the presence of 10–250 nM bortezomib (Btz) or 25 μM rifampicin (Rif) vs. vehicle CTL in HEK293-OATP1B1 cells (Co-incubation). (D) Model-estimated fold change and associated SE in [3H]E217βG accumulation (1 μM, 2 min) vs. vehicle CTL treatment in HEK293-OATP1B1 cells pretreated with bortezomib (Btz) for the indicated times and at the indicated concentrations (Pre-incubation). Following pretreatment, cells were washed three times with HBSS buffer, and the [3H]E217βG accumulation was determined in the absence of bortezomib. (E) Model-estimated fold change and associated SE of [3H]pitavastatin accumulation (1 μM, 0.5 min) in human SCH pre-incubated with bortezomib (50 nM for 7 h) or co-incubated with positive control bromosulfophthalein (BSP) (100 μM) vs. vehicle CTL. Fold changes and SEs were estimated by linear mixed effects models, as described in the “Data Analysis” section (n = 3 hepatocyte donors in triplicate). To account for multiple comparisons, p-values were adjusted based on the Bonferroni method. * indicates a statistically significant difference (adjusted p<0.05) vs. CTL.
Fig 8
Fig 8. Effects of proteasome inhibitors MG132, epoxomicin and carfilzomib on OATP1B3-mediated transport and total ubiquitin-conjugated proteins in HEK293 stable cell lines.
HEK293-OATP1B3 cells were seeded at a density of 1.2 x 10⁵ cells/well in 24-well plates and cultured to confluence. (A) Model-estimated fold change and associated SE in [3H]CCK-8 accumulation (1 μM, 3 min) in HEK293-OATP1B3 cells pretreated with MG132 (10 μM), epoxomicin (50 nM) and carfilzomib (200 nM) for 2 h vs. vehicle control (CTL) pretreatment. Fold changes and SE were estimated by linear mixed effects models, as described in the “Data Analysis” section (n = 3 in triplicate). To account for multiple comparisons, p-values were adjusted based on the Bonferroni method. * indicates a statistically significant difference (adjusted p<0.05) vs. CTL. (B) Immunoblot of ubiquitin was conducted in whole cell lysates of HEK293-OATP1B3 cells pretreated with MG132 (10 μM), epoxomicin (50 nM) and carfilzomib (200 nM) or vehicle control for two hours. β-actin served as the loading control for the whole cell lysates.

References

    1. König J. Uptake transporters of the human OATP family: molecular characteristics, substrates, their role in drug-drug interactions, and functional consequences of polymorphisms. Handb Exp Pharmacol. 2011(201):1–28. doi: 10.1007/978-3-642-14541-4_1 - DOI - PubMed
    1. Letschert K, Faulstich H, Keller D, Keppler D. Molecular characterization and inhibition of amanitin uptake into human hepatocytes. Toxicol Sci. 2006;91(1):140–9. doi: 10.1093/toxsci/kfj141 - DOI - PubMed
    1. Kiser JJ, Gerber JG, Predhomme JA, Wolfe P, Flynn DM, Hoody DW. Drug/Drug interaction between lopinavir/ritonavir and rosuvastatin in healthy volunteers. Journal of acquired immune deficiency syndromes. 2008;47(5):570–8. doi: 10.1097/QAI.0b013e318160a542 - DOI - PubMed
    1. Shitara Y, Itoh T, Sato H, Li AP, Sugiyama Y. Inhibition of transporter-mediated hepatic uptake as a mechanism for drug-drug interaction between cerivastatin and cyclosporin A. J Pharmacol Exp Ther. 2003;304(2):610–6. doi: 10.1124/jpet.102.041921 - DOI - PubMed
    1. Hirano M, Maeda K, Shitara Y, Sugiyama Y. Contribution of OATP2 (OATP1B1) and OATP8 (OATP1B3) to the hepatic uptake of pitavastatin in humans. J Pharmacol Exp Ther. 2004;311(1):139–46. doi: 10.1124/jpet.104.068056 - DOI - PubMed

MeSH terms

LinkOut - more resources