. 2017 Nov 6;13(11):e1007049.
doi: 10.1371/journal.pgen.1007049. eCollection 2017 Nov.

Long-lasting masculinizing effects of postnatal androgens on myelin governed by the brain androgen receptor

Affiliations

Long-lasting masculinizing effects of postnatal androgens on myelin governed by the brain androgen receptor

Charly Abi Ghanem et al. PLoS Genet. .

Abstract

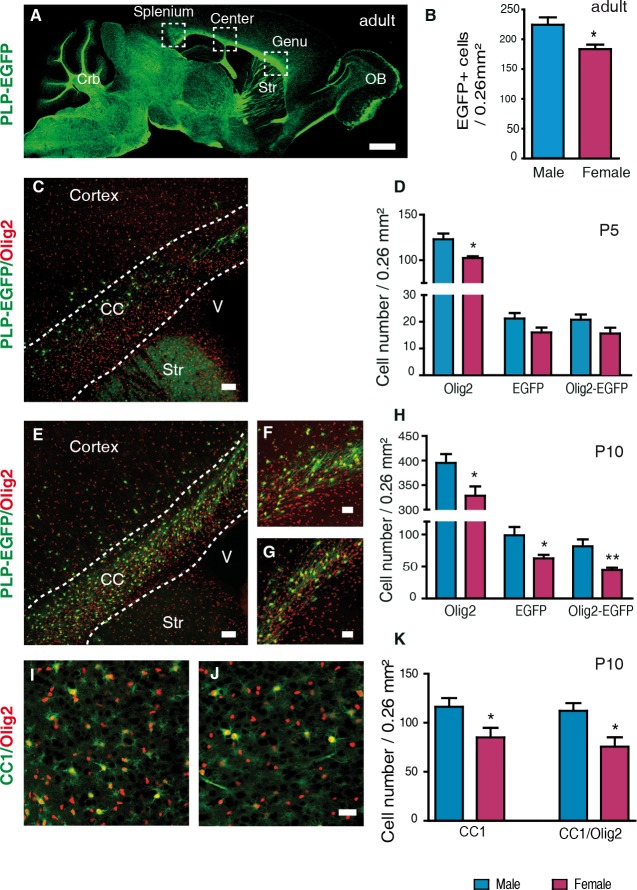
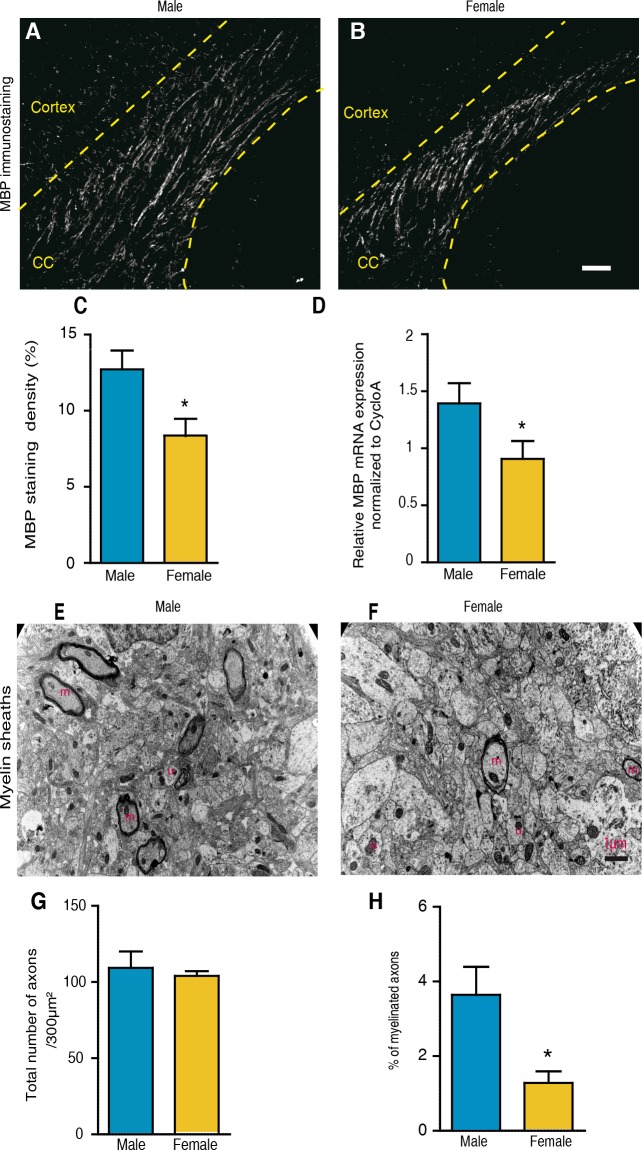
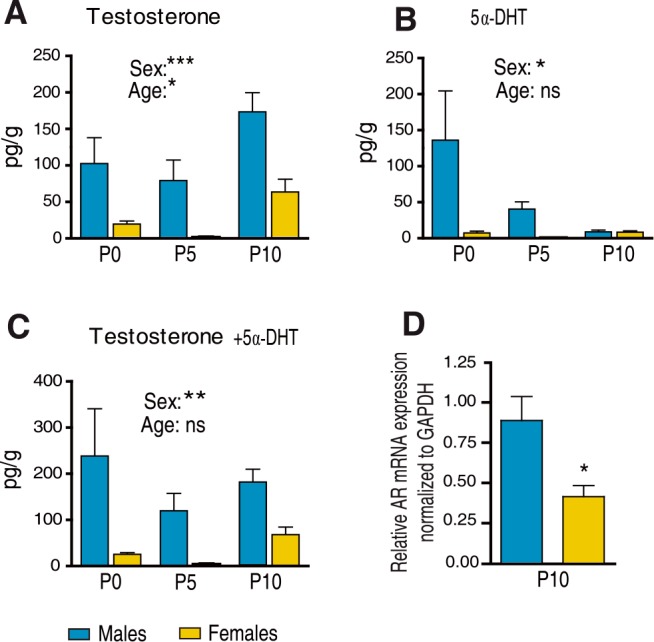
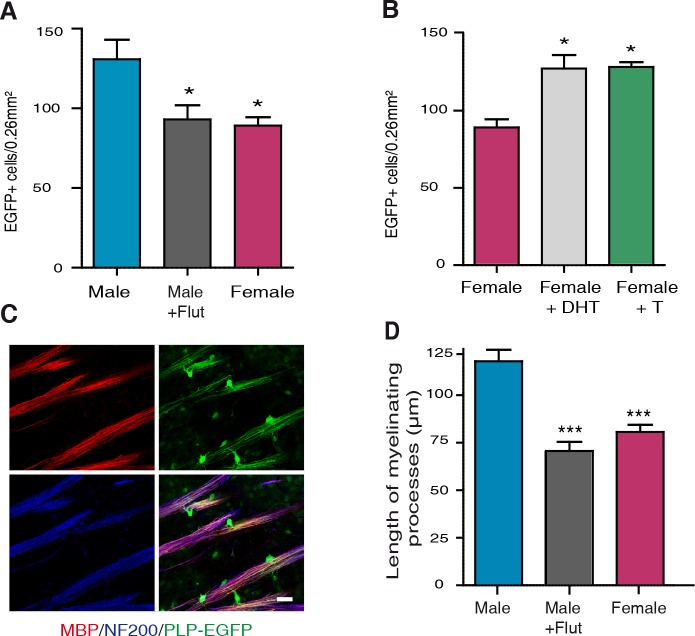
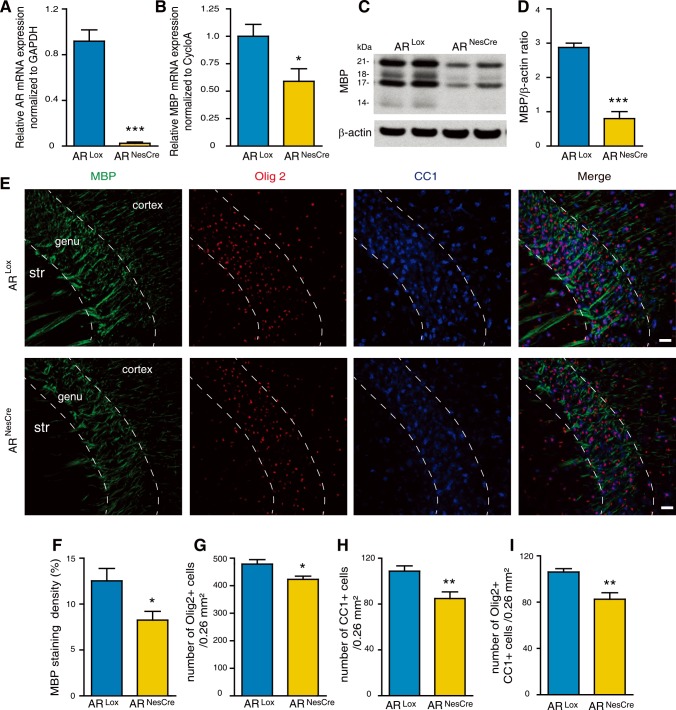
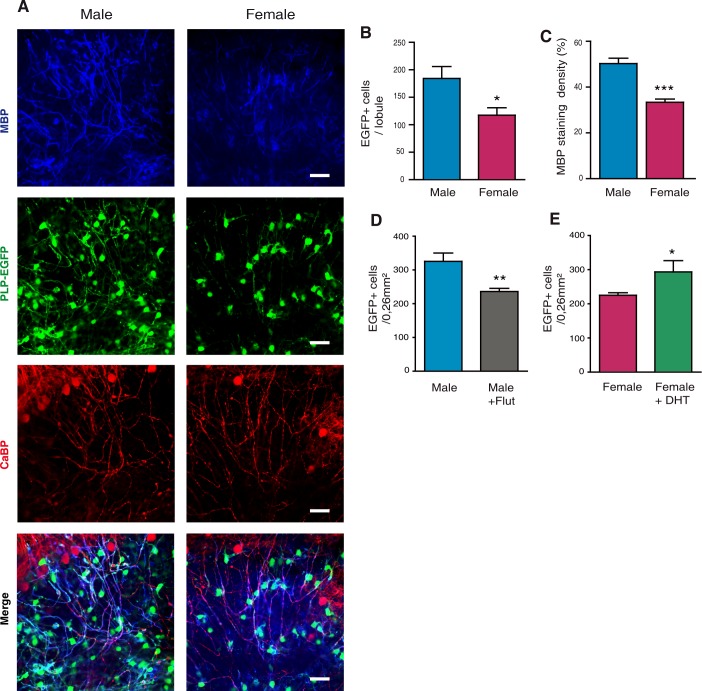
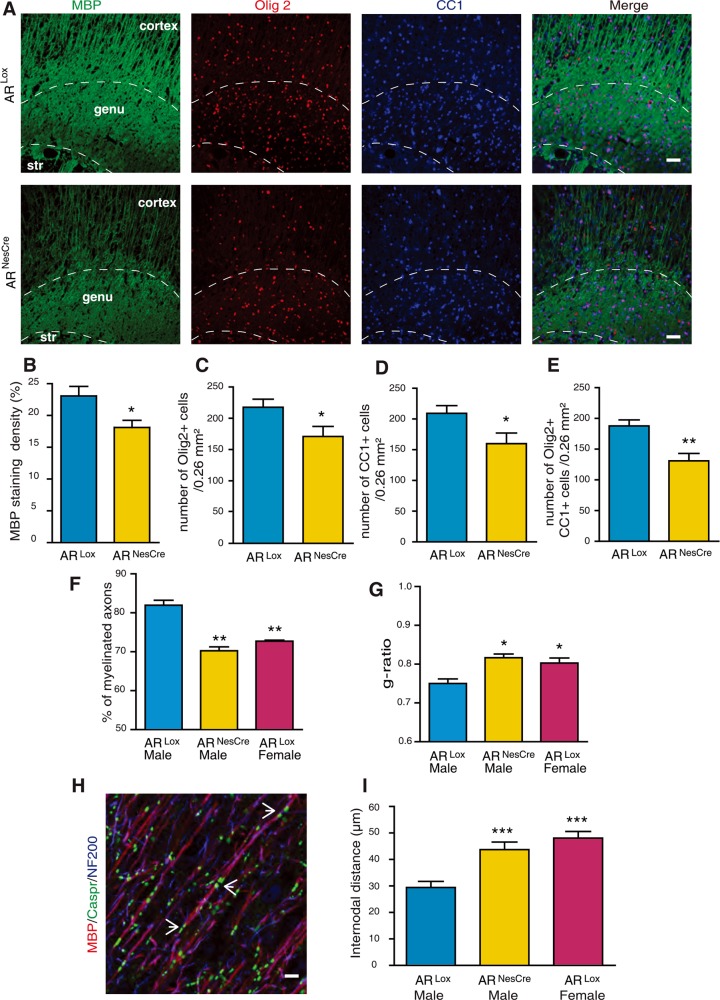
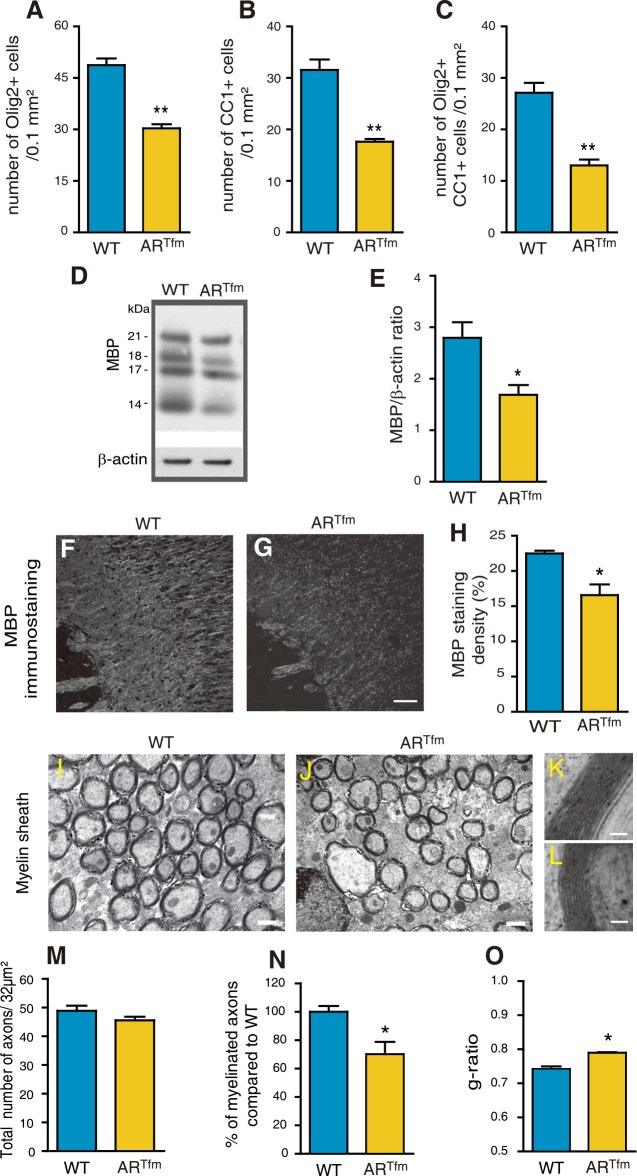
The oligodendrocyte density is greater and myelin sheaths are thicker in the adult male mouse brain when compared with females. Here, we show that these sex differences emerge during the first 10 postnatal days, precisely at a stage when a late wave of oligodendrocyte progenitor cells arises and starts differentiating. Androgen levels, analyzed by gas chromatography/tandem-mass spectrometry, were higher in males than in females during this period. Treating male pups with flutamide, an androgen receptor (AR) antagonist, or female pups with 5α-dihydrotestosterone (5α-DHT), revealed the importance of postnatal androgens in masculinizing myelin and their persistent effect into adulthood. A key role of the brain AR in establishing the sexual phenotype of myelin was demonstrated by its conditional deletion. Our results uncover a new persistent effect of postnatal AR signaling, with implications for neurodevelopmental disorders and sex differences in multiple sclerosis.


Conflict of interest statement

The authors have declared that no competing interests exist.

Figures

Fig 1
Fig 1. The density of oligodendroglial cells becomes sexually differentiated between P5 and P10.
(A) Sagittal section showing EGFP expression in the adult PLP-EGFP mouse brain. White matter tracts display intense green fluorescence, including the three subregions of the corpus callosum: genu, center and splenium. Crb = cerebellum; OB = olfactory bulb; Str = striatum.(B) Comparison of the densities of EGFP+ oligodendroglial cells in corpus callosum (CC) between adult male and female PLP-EGFP mice (n = 5). (C) Immunostaining of Olig2+ gliogenic progenitors (red) and EGFP+ oligodendroglial cells (green) on a sagittal brain section of a PLP-EGFP male mouse at P5. CC = corpus callosum; Str = striatum; V = third ventricle. (D) Comparison of the densities of Olig2+, EGFP+ and Olig2+/EGFP+ double-positive cells in corpus callosum between P5 male and female PLP-EGFP mice (n = 5). Immunostaining of Olig2+ cells (red) and EGFP+ cells (green) on sagittal brain sections at P10 of (E and F) a male and (G) a female. CC = corpus callosum; Str = striatum; V = third ventricle. (H) Comparison of the densities of Olig2+, EGFP+ and Olig2+/EGFP+ double-positive cells in corpus callosum between P10 males and females PLP-EGFP mice (n = 9). (I and J) Immunostaining of Olig2+ cells (red) and CC1+ mature oligodendrocytes (green) on sagittal corpus callosum sections at P10 of (I) a male and (J) a female C57Bl/6 mouse. (K) Comparison of the densities of CC1+ oligodendrocytes and CC1+/Olig2+ double-positive cells in corpus callosum at P10 between males and females (n = 5). Cell densities are presented as means ± SEM. Significance was calculated using two-tailed Student’s t test (**p < 0.01; *p < 0.05 when compared to the corresponding male group). Scale bars: (A) 1 mm; (C and E) 50 μm; (F-J) 20 μm.
Fig 2
Fig 2. Corpus callosum myelin is sexually dimorphic at P10.
(A and B) Immunostaining of myelin basic protein (MBP) on sagittal corpus callosum sections at P10 of (A) a male and (B) a female C57Bl/6 mouse. CC = corpus callosum. The dotted lines delimit the corpus callosum. (C) Quantification of the MBP immunostaining in P10 corpus callosum of male and female mice. For each animal, the MBP+ area was determined within 0.26 mm2 fields of splenium, center and genu using NIH image software and the mean area was calculated (n = 8). (D) MBP mRNA expression within the brain of males and female mice analyzed by qRT-PCR. The cyclophilin A gene was used for normalization (n = 3–4). (E and F) Electron micrographs of P10 corpus callosum of a (E) male and a (F) female WT mouse. Pictures show unmyelinated (u) and myelinated axons (m). (G-H) Analysis by electron microscopy of the total number of axons (G) and the percentage of myelinated axons (H) in corpus callosum at P10 (n = 3). Results are presented as means ± SEM. Significance was calculated using two-tailed Student’s t test (*p < 0.05 when compared to the corresponding male group). Scale bars: A and B = 20 μm; E and F = 1 μm.
Fig 3
Fig 3. Brain levels of testosterone and 5α-dihydrotestosterone in males and females between P0 and P10 and androgen receptor expression.
Comparison of brain levels of (A) testosterone, (B) 5α-dihydrotestosterone (5α-DHT) and (C) testosterone + 5α-DHT between male and female mice. Androgen levels were analyzed by GC-MS/MS at P0 (n = 16), P5 (n = 7–9) and P10 (n = 17–19). (D) Androgen receptor (AR) mRNA expression was analyzed within the brains of male and female mice by qRT-PCR. The GAPDH gene was used for normalization (n = 5). Results are presented as means ± SEM. Significance was calculated by two-way ANOVA with sex and age as factors. A significant effect of sex is indicated in the figures. (D) Comparison by two-tailed Student’s test (***p < 0.001; **p < 0.01; *p < 0.05 when compared to the corresponding male group).
Fig 4
Fig 4. The role of androgens in determining sex differences in myelin at P10.
(A) Comparison of the density of EGFP+ cells in corpus callosum of P10 PLP-EGFP male mice treated or not with the AR antagonist flutamide (Flut, 1 mg/kg), every two days between P0 and P10, and their control animals treated with sesame oil vehicle (n = 5). (B) Comparison of the density of EGFP+ cells in corpus callosum of P10 PLP-EGFP female mice treated with non-aromatizable 5α-dihydrotestosterone (DHT, 1 mg/kg), testosterone (T, 1 mg/kg) or with sesame oil vehicle, every two days between P0 and P10 (n = 5). (C) Immunolabeling of MBP+ myelin (red, top left) and NF200+ neurofilaments (blue, bottom left) on sagittal brain slices of PLP-EGFP+ P10 mice (green fluorescence, top right). The combination of all three markers (bottom right) shows oligodendrocytes and their processes (green) and myelinated axonal segments (purple). Photomicrographs were taken at the level of the junction between the striatum and the genu of corpus callosum. Scale bar = 20 μm. (D) Analysis of the myelinated axonal segments in P10 PLP-EGFP male mice treated or not with flutamide and female mice treated with sesame oil vehicle. (***p < 0.001; *p < 0.05 when compared to control males or females by one-way ANOVA followed by Newman-Keuls tests).
Fig 5
Fig 5. The role of brain androgen receptors in determining sex differences in myelin at P10.
(A and B) Analysis by qRT-PCR of AR (A) and MBP (B) mRNA expressions in the brain at P10 of ARNesCre male mice. Littermates carrying a floxed exon 1 of the AR gene (ARLox) were used as controls (n = 4). GAPDH and cyclophilin A were used as normalization genes. (C and D) MBP protein levels, analyzed by Western blot and normalized to the endogenous β-actin protein, in the brain of ARNesCre mice when compared to ARLox controls at P10 (n = 4). (E) Immunostaining of MBP (green), Olig2 (red), CC1 (mature oligodendrocytes, blue) and the merged triple immunostaining (yellow). Representative photomicrographs were taken at the level of the genu of the corpus callosum (str = striatum). Scale bar = 100 μm. (F-I) Within the P10 corpus callosum, (F) quantification of the MBP+ area in a 0.26 mm2 field and counting of (G) Olig2+ oligodendroglial cells, (H) CC1+ mature oligodendrocytes and (I) Olig2/CC1 double positive cells in ARNesCre mice compared with ARLox littermates (n = 6). Results are presented as means ± SEM. For each animal, the mean value of the corpus callosum was calculated from the splenium, the center and the genu. Significance was calculated using two-tailed Student’s t test (***p < 0.001; *p < 0.05 when compared to the corresponding control ARLox males).
Fig 6
Fig 6. Androgen-dependent sex differences in myelin are maintained over time: In vivo and in vitro studies.
(A) Immunostaining of MBP+ myelin (blue) and EGFP+ oligodendroglial cells (green) in cerebellar slices taken from PLP-EGFP male and female mice at P10 and maintained in culture for two weeks in the absence of androgens. The Purkinje neuron marker Calbindin (CaBP) (red) was used to track nerve cells. The merged triple immunostaining (bottom) documented the higher myelination of the male cerebellar slices. (B and C) Analysis of the density of EGFP+ oligodendroglial cells (B) and of the MBP+ area (C) within the male and female cerebellar slices. (n = 5 animals, three slices and three regions from each slice were analyzed per animal). (D) Injecting male PLP-EGFP mice every two days between P0 and P10 with the AR antagonist flutamide (Flut, 1 mg/kg) and control mice with sesame oil vehicle. Analysis of EGFP+ oligodendroglial cells was performed at 3 months of age (n = 5). (E) Injecting female PLP-EGFP mice every two days between P0 and P10 with 5α-dihydrotestosterone (DHT, 1 mg/kg) and control mice with sesame oil vehicle. Analysis of EGFP+ oligodendroglial cells was performed at 3 months of age (n = 5). Results are presented as means ± SEM. Significance was calculated using two-tailed Student’s t test (***p < 0.001; **p < 0.01 *p < 0.05 when compared to the corresponding control).
Fig 7
Fig 7. A female-like phenotype of myelin in adult ARNesCre males.
(A) Immunostaining of MBP (green), Olig2 (red), CC1 (mature oligodendrocytes, blue) and the merged triple immunostaining. Representative photomicrographs were taken at the level of the genu of the corpus callosum (str = striatum) of 3 months old ARLox control and ARNesCre males. Scale bar = 100 μm. (B-E) Within the corpus callosum of 3 months old ARLox and ARNesCre males, quantification of the MBP+ area (B) and counting of Olig2+ oligodendroglial cells (C), CC1+ mature oligodendrocytes (D) and Olig2/CC1 double positive cells (E), (n = 6). (F and G) Analysis by electron microscopy of the percentage of myelinated axons (F) and g-ratios of myelinated axons (G) in corpus callosum of adult ARLox males and females and ARNesCre males (n = 3). (H) Immunostaining of the paranodal junction marker, Caspr (contactin associated protein, green, pointed by white arrows), MBP+ myelin (red) and Neurofilament (NF200, blue) in sagittal sections of the adult male mouse cerebral cortex. Scale bar = 5 μm. (I) Comparison of internodal distances in cerebral cortex between adult ARLox males, ARLox females and ARNesCre males (n = 5). Results are presented as means ± SEM. Significance was calculated using two-tailed Student’s t test for comparisons between two groups and Newman-Keuls tests after one-way ANOVA for comparisons between three groups (***p < 0.001; **p < 0.01; *p < 0.05 when compared to ARLox males).
Fig 8
Fig 8. A female-like phenotype of myelin in adult ARTfm males.
Within the corpus callosum of 3 months old wild type males (WT) and males carrying the testicular feminization mutation (ARTfm) (n = 6), quantification of the density of Olig2+ oligodendroglial cells (A), CC1+ mature oligodendrocytes (B) and Olig2/CC1 double positive cells (C). (D and E) Representative Western Blot analysis and quantification of all MBP isoforms, normalized to the endogenous β-actin protein, in brain of WT and ARTfm males (n = 4). (F and G) MBP immunostaining of corpus callosum in sagittal brain sections from WT (F) or ARTfm males (G). Scale bar = 100 μm. (H) Quantification of the MBP positive area density in a 0.26 mm2 field in the corpus callosum of WT and ARTfm mice (n = 6). For each animal, the mean value of the corpus callosum was calculated from splenium, center and genu. (I-L) Representative electron micrographs of nerve fibers in corpus callosum of adult WT (I) and ARTfm (J) male mice. Scale bar = 0.5 μm. High magnification electron micrographs of a representative axon and its myelin sheath in WT and ARTfm males, (K and L) respectively. Scale bar = 50 nm. (M-O) Analysis by electron microscopy of the total number of axons (M), the percentage of myelinated axons (N) and the g-ratios (O) in corpus callosum of WT and ARTfm males (n = 3). Results are presented as means ± SEM. Significance was calculated using two-tailed Student’s tests (**p < 0.01; *p < 0.05; when compared to the corresponding control WT males).

References

    1. Clayton JA, Collins FS. Policy: NIH to balance sex in cell and animal studies. Nature. 2014;509(7500):282–3. . - PMC - PubMed
    1. Cahill L, Aswad D. Sex Influences on the Brain: An Issue Whose Time Has Come. Neuron. 2015;88(6):1084–5. doi: 10.1016/j.neuron.2015.11.021 . - DOI - PubMed
    1. McCarthy MM, Arnold AP. Reframing sexual differentiation of the brain. Nat Neurosci. 2011;14(6):677–83. doi: 10.1038/nn.2834 . - DOI - PMC - PubMed
    1. Gong G, He Y, Evans AC. Brain connectivity: gender makes a difference. Neuroscientist. 2011;17(5):575–91. doi: 10.1177/1073858410386492 . - DOI - PubMed
    1. Ingalhalikar M, Smith A, Parker D, Satterthwaite TD, Elliott MA, Ruparel K, et al. Sex differences in the structural connectome of the human brain. Proc Natl Acad Sci U S A. 2014;111(2):823–8. doi: 10.1073/pnas.1316909110 . - DOI - PMC - PubMed

LinkOut - more resources