. 2017 Nov 6;13(11):e1007060.
doi: 10.1371/journal.pgen.1007060. eCollection 2017 Nov.

Epigenetic memory via concordant DNA methylation is inversely correlated to developmental potential of mammalian cells

Affiliations

Epigenetic memory via concordant DNA methylation is inversely correlated to developmental potential of mammalian cells

Minseung Choi et al. PLoS Genet. .

Abstract

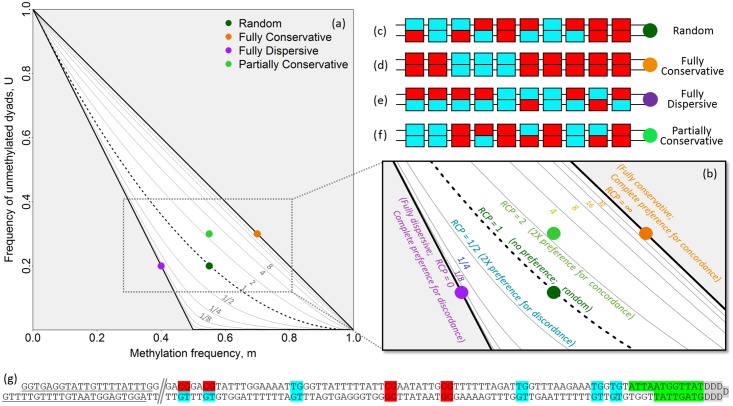
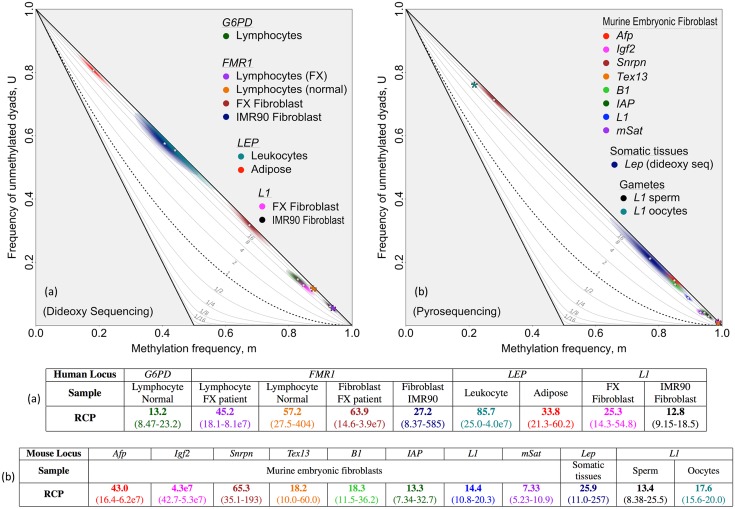
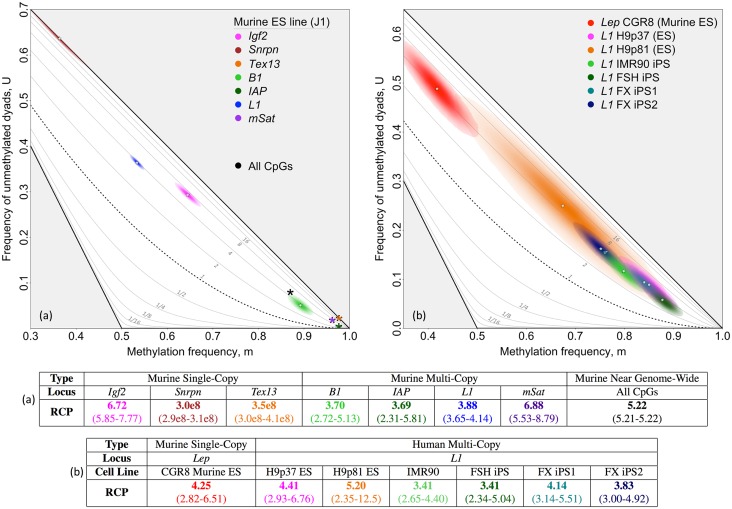
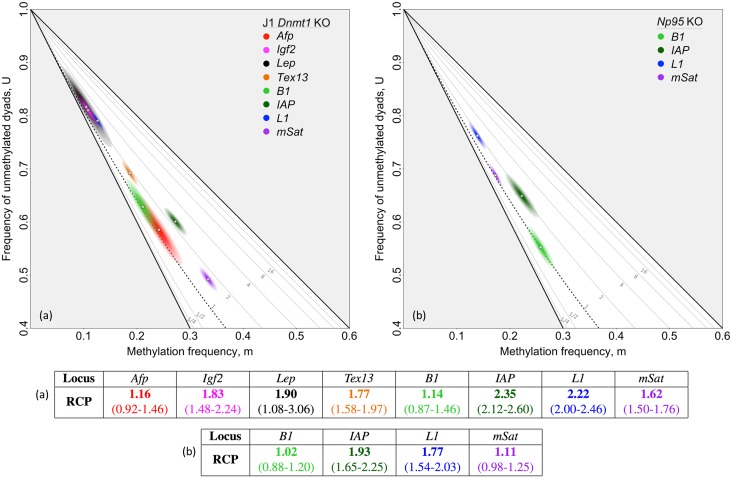
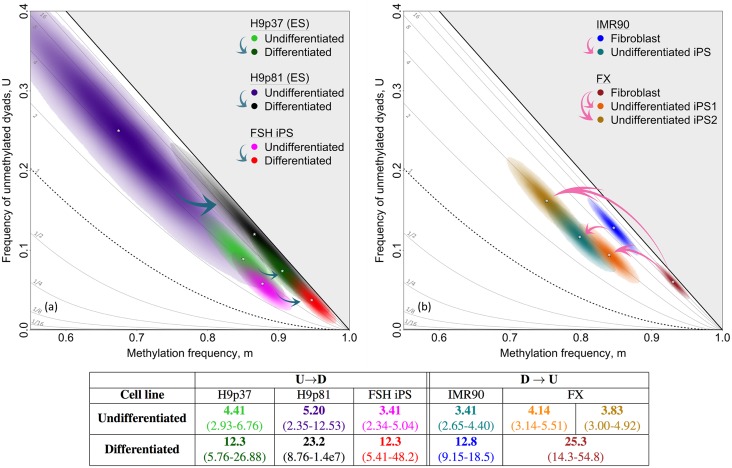
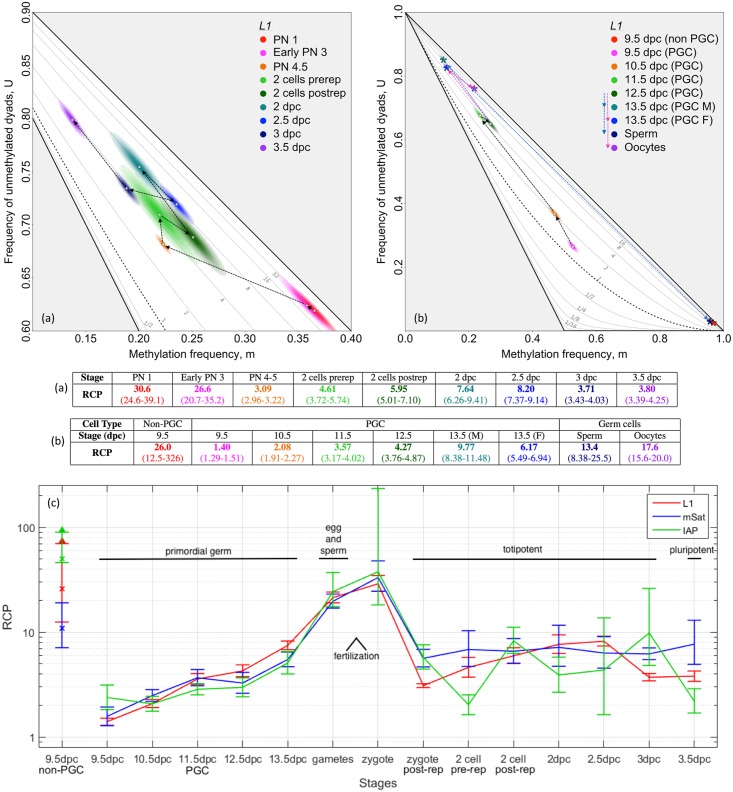
In storing and transmitting epigenetic information, organisms must balance the need to maintain information about past conditions with the capacity to respond to information in their current and future environments. Some of this information is encoded by DNA methylation, which can be transmitted with variable fidelity from parent to daughter strand. High fidelity confers strong pattern matching between the strands of individual DNA molecules and thus pattern stability over rounds of DNA replication; lower fidelity confers reduced pattern matching, and thus greater flexibility. Here, we present a new conceptual framework, Ratio of Concordance Preference (RCP), that uses double-stranded methylation data to quantify the flexibility and stability of the system that gave rise to a given set of patterns. We find that differentiated mammalian cells operate with high DNA methylation stability, consistent with earlier reports. Stem cells in culture and in embryos, in contrast, operate with reduced, albeit significant, methylation stability. We conclude that preference for concordant DNA methylation is a consistent mode of information transfer, and thus provides epigenetic stability across cell divisions, even in stem cells and those undergoing developmental transitions. Broader application of our RCP framework will permit comparison of epigenetic-information systems across cells, developmental stages, and organisms whose methylation machineries differ substantially or are not yet well understood.


Conflict of interest statement

The authors have declared that no competing interests exist.

Figures

Fig 1
Fig 1. Characterizing methylation systems using double-stranded DNA methylation patterns.
(a) Frequencies of methylated cytosines (m) and unmethylated dyads (U) locate each data set on the continuum from complete preference for concordance to complete preference for discordance. Ratio of Concordance Preference (RCP) is indicated for each contour line. (b) Expanded view. For this schematic, individual double-stranded methylation patterns (c-f) are used to illustrate different methylation configurations that lie along this continuum. Individual patterns, with methylated and unmethylated cytosines indicated in red and blue, respectively, can reflect (c) a random methylation system; (d) a fully conservative system, with complete preference for generating concordant dyads; (e) a fully dispersive system, with complete preference for generating discordant dyads (partial preference for dispersive placement is also possible); or (f) a partially conservative system, with more concordant dyads than expected under random processes, but fewer than expected under fully conservative processes. (g) A representative partial double-stranded DNA methylation pattern collected using hairpin-bisulfite PCR. The experiment-specific batchstamp is shown in green, and can be used to monitor for PCR contamination; the molecule-specific barcode shown in gray, generalized as “DDDDDDD” and a random sequence of non-cytosine nucleotides, can be used to identify redundant sequences. The batchstamp and barcode are encoded by the hairpin oligonucleotide used to join the top and bottom strands. Primer-binding sites are underlined at the left end of the molecule.
Fig 2
Fig 2. Inferring RCP for loci in differentiated human and murine cells.
Methylation in human and murine differentiated cells was consistently inferred to have strong contributions from conservative processes, using data sets that span a wide range of methylation frequencies. For each locus or multi-copy family, we inferred the RCP point estimate of the m, U pair and the two-dimensional confidence region, determined by the uncertainty in the two variables (S7 Text). The intensity of coloration at a given point in a confidence region reflects the confidence level at that point. The m, U point estimates for most data sets are indicated with white asterisks, and the corresponding RCP values are given in the associated table. A larger, colored asterisk is used when the confidence interval of a data set is too small to be readily visible. RCP point estimates and bias-corrected bootstrap confidence intervals are shown in figure-associated tables. (a) Three single-copy human loci—G6PD, FMR1, and LEP—and one human repeat family, L1, all from various tissues as indicated. (b) Four single-copy loci and four repeat families—Afp, Igf2, Snrpn, Tex13, B1, IAP, L1, and mSat—from murine embryonic fibroblasts, one single-copy murine locus—Lep—from somatic tissue, and one repeat family—L1—from murine gametes. Data in (a) were collected using hairpin-bisulfite PCR and dideoxy sequencing, and taken from published [24, 28, 29, 41] and previously unpublished work (S3 Table). Data in (b) were collected by Arand et al. [14] using hairpin-bisulfite PCR and pyrosequencing, with the exception of murine Lep for which data from somatic tissues were collected by Stoger [29], using dideoxy sequencing. Compared to dideoxy sequencing, pyrosequencing can provide greater sequencing depth, but yields considerably shorter reads. Our analyses of these data sets applied bootstrapping approaches and accounted for inappropriate and failed conversion of methylcytosine using methods described in Supporting Information (S4 Text). Dyad counts, conversion-error rates, and inferences for methylation frequencies and RCPs are summarized in S3 and S4 Tables.
Fig 3
Fig 3. Inferring RCP in undifferentiated human and murine stem cells.
Methylation patterns in undifferentiated, cultured human and murine stem cells were consistently inferred to have substantial contributions from conservative processes, with concordance greater than the random expectation. RCP point estimates and biased-corrected bootstrap confidence intervals are shown for individual loci and “All CpGs”. (a) Three single-copy loci—Igf2, Snrpn, and Tex13—as well as four multi-copy loci—B1, IAP, L1, and mSat—from murine ES J1 cells were assayed by Arand et al. [14]. “All CpGs” data, collected by Zhao et al. [15]), reflect methylation at 17.3% of CpG dyads in the murine genome (S5 Table). Data from both Arand et al. [14] and Zhao et al. [15] were collected using hairpin-bisulfite PCR and pyrosequencing. (b) Human L1 and LEP data were collected using hairpin-bisulfite PCR and dideoxy sequencing (data from published [29] and previously unpublished work (S3 Table)). Our analyses of these data sets applied bootstrapping approaches and accounted for inappropriate and failed conversion of methylcytosine using methods described in Supporting Information (S4 Text). Dyad counts, conversion-error rates, and inferences for methylation frequencies are given in S3, S4 and S5 Tables.
Fig 4
Fig 4. Inferring RCP in Dnmt1 knockout and Np95 knockout ES cells.
(a) In the absence of the Dnmt1 maintenance methyltransferase, some loci in cultured murine ES cells had RCP values close to 1, the random expectation. Data from Lep, collected using hairpin-bisulfite PCR and dideoxy sequencing, are from Al-Alzzawi [32]. Data from seven additional loci are from Arand et al. [14], who used hairpin-bisulfite PCR and pyrosequencing. Our analysis of these published data revealed two of the eight loci analyzed—Afp and B1—to have very low RCP values not significantly different from 1. (b) In the absence of Np95, a protein critical for recruiting Dnmt1 to hemimethylated regions in newly replicated DNA, one of the four loci analyzed—B1—was inferred to have a very low RCP value, not significantly different from 1. Our analyses of these data sets from Arand et al. [32] applied bootstrapping approaches and accounted for inappropriate and failed conversion of methylcytosines using methods described in S4 Text. Point estimates and approximate 95% confidence intervals on RCP are given above, and also along with conversion-error-rate estimates in S3 and S4 Tables.
Fig 5
Fig 5. Shifts in RCP of L1 elements upon differentiation of cultured human ES cells and dedifferentiation of cultured fibroblasts.
RCP values of L1 elements in cultured stem cells grown under non-differentiating conditions are compared to those for the same cells grown under differentiating conditions. RCP values for progenitor fibroblast lines are compared with those for their descendent iPS cells. Blue arrows indicate differentiation and pink arrows indicate dedifferentiation. (a) Undifferentiated cells from each of three human ES and iPS lines had only moderate preference for concordance. Upon differentiation, their RCP values shifted in parallel toward stronger preference for concordance. (b) Differentiated human fibroblast lines had substantial preference for concordance. Upon dedifferentiation to iPS cells, RCP values were reduced, indicating diminished preference for concordance. We present data for two different iPS lines established independently from the fibroblast line, FX. These iPS lines differed in their methylation frequency, m, at L1 elements, but had similar RCP values. Some data were previously shown in Figs 2 and 3, and are included again here to illustrate more directly the relationships of L1 methylation in the differentiated and undifferentiated cultured cells. We applied bootstrapping approaches and accounted for inappropriate and failed conversion of methylcytosine using methods described in S4 Text. Point estimates of RCP, with approximate 95% confidence intervals, are shown above, and also with dyad counts, conversion-error rates, and inferences for methylation frequencies in S3 and S4 Tables.
Fig 6
Fig 6. Shifts in RCP during murine embryonic and germ-cell development.
Major transitions in RCP values occur during early embryonic and primordial germ cell (PGC) development. RCP point estimates and approximate 95% bias-corrected bootstrap confidence intervals are given in the associated tables and in (c). (a) Transitions from early pronuclear stages (1 and 3) to late stages (4-5) were accompanied by a sharp decrease in RCP at L1 elements, to a level similar to that observed in cultured stem cells (Fig 3). Further embryonic development was accompanied by minor increases and subsequent decreases in methylation and RCP values. (b) In PGCs at the earliest stage for which data are available, 9.5 days post conception (dpc), L1 elements had RCP values that were unusually low but still significantly greater than 1 (p < 10−16). RCP values increased during PGC maturation to stage 13.5 dpc even as methylation frequencies decreased by more than 50%. RCP values for eggs and sperm, shown previously in Fig 2b), are included here to highlight the transition from early primordial germ cells to terminally differentiated gametes. (c) Tracking RCP at repeat families during development. We inferred RCP for the embryonic and differentiated stages for which data were published by Arand et al. [17]. The topology of our longitudinal RCP plot highlights the transitions also evident in Arand et al.’s plot of the percentage of hemimethylated CpG dyads relative to all methylated CpG dyads (Figure 6b in [17]). Their metric captures relative shifts in concordance, but, in contrast to RCP, does not include a null model enabling quantitative comparison of inferred concordance across data sets with disparate methylation frequencies [17]. Point estimates and approximate 95% confidence intervals for all but one data set were estimated by bootstrapping and applying the BCa correction (S7 Text). Dyad counts, methylation frequencies, and conversion error rates are in S3 Table. In cases where data were available for multiple replicates, dyad frequencies were pooled (S6 Text). For one data set, 3 dpc at mSat, double-stranded sequences and methylation patterns were not available to us for bootstrap analysis; we therefore used a likelihood-based method for the estimation of confidence intervals (S8 Text).

References

    1. Feinberg AP, Vogelstein B, et al. Hypomethylation distinguishes genes of some human cancers from their normal counterparts. Nature. 1983;301(5895):89–92. doi: 10.1038/301089a0 - DOI - PubMed
    1. Baylin SB, Jones PA. A decade of exploring the cancer epigenome—biological and translational implications. Nature Reviews Cancer. 2011;11(10):726–734. doi: 10.1038/nrc3130 - DOI - PMC - PubMed
    1. Chen Y, Breeze CE, Zhen S, Beck S, Teschendorff AE. Tissue-independent and tissue-specific patterns of DNA methylation alteration in cancer. Epigenetics & chromatin. 2016;9(1):1. - PMC - PubMed
    1. Ohi Y, Qin H, Hong C, Blouin L, Polo JM, Guo T, et al. Incomplete DNA methylation underlies a transcriptional memory of somatic cells in human iPS cells. Nature cell biology. 2011;13(5):541–549. doi: 10.1038/ncb2239 - DOI - PMC - PubMed
    1. Monk M, Boubelik M, Lehnert S. Temporal and regional changes in DNA methylation in the embryonic, extraembryonic and germ cell lineages during mouse embryo development. Development. 1987;99(3):371–382. - PubMed

MeSH terms