

Role of Melt Curve Analysis in Interpretation of Nutrigenomics' MicroRNA Expression Data
- PMID: 29109097
- PMCID: PMC6070330
- DOI: 10.21873/cgp.20057
Role of Melt Curve Analysis in Interpretation of Nutrigenomics' MicroRNA Expression Data
Abstract
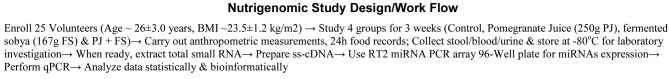
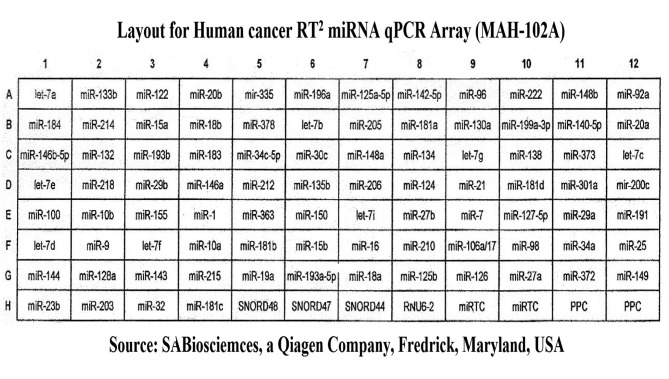
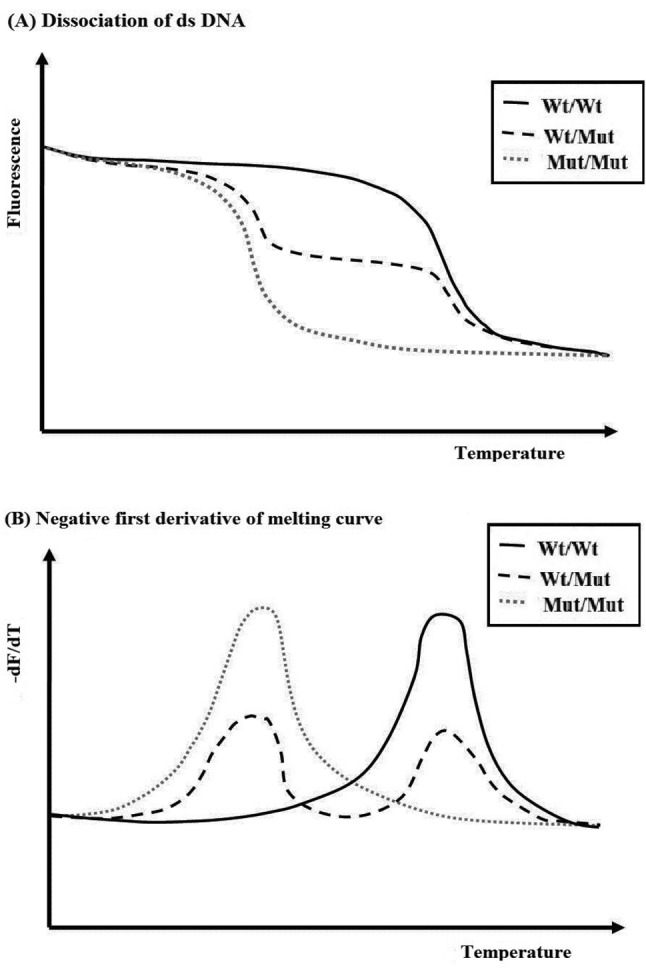
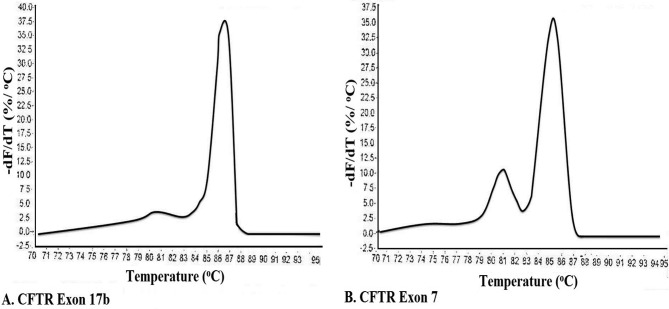
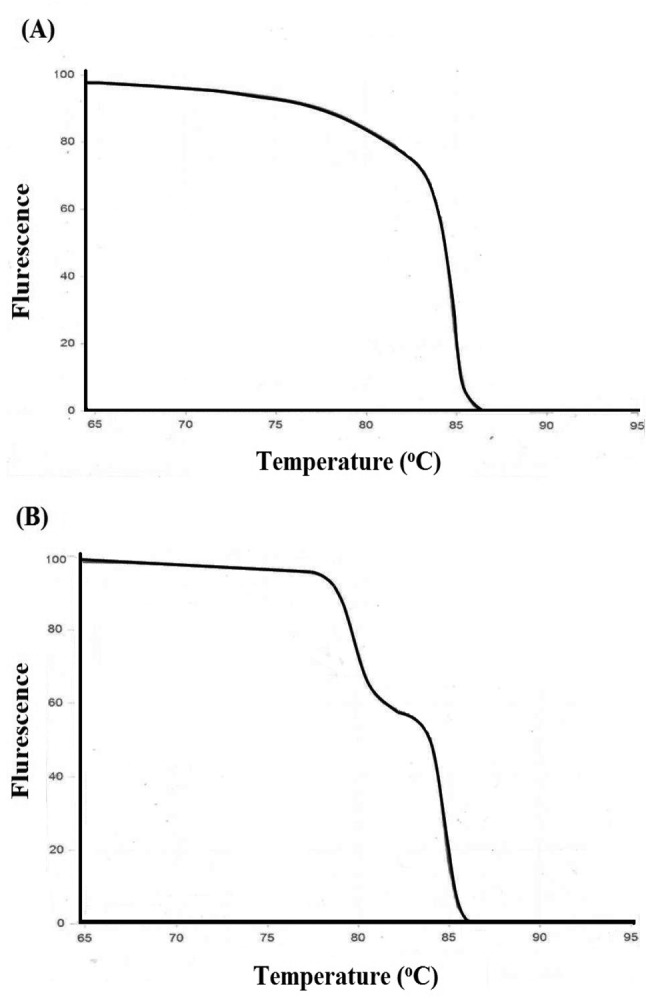
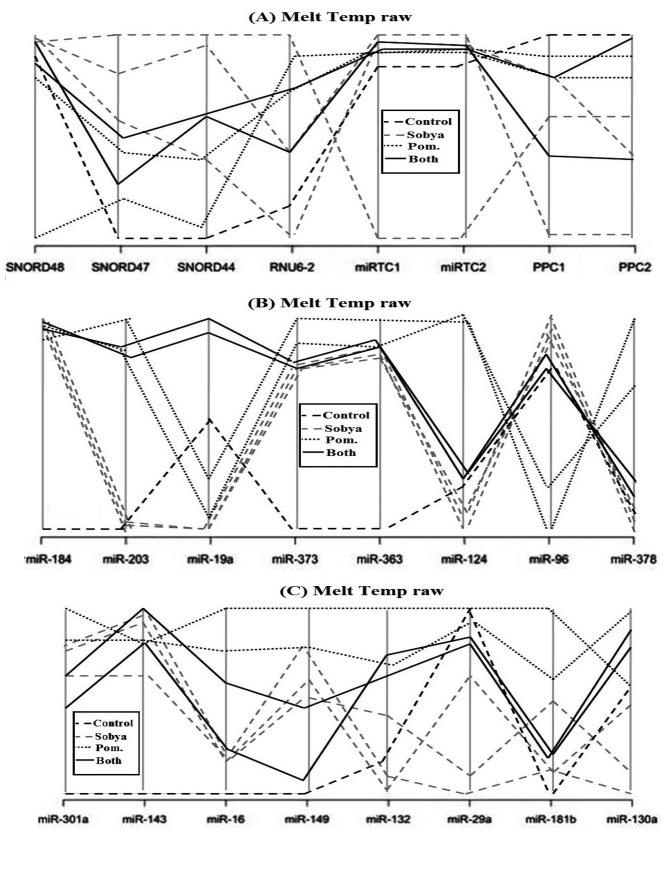
This article illustrates the importance of melt curve analysis (MCA) in interpretation of mild nutrogenomic micro(mi)RNA expression data, by measuring the magnitude of the expression of key miRNA molecules in stool of healthy human adults as molecular markers, following the intake of Pomegranate juice (PGJ), functional fermented sobya (FS), rich in potential probiotic lactobacilli, or their combination. Total small RNA was isolated from stool of 25 volunteers before and following a three-week dietary intervention trial. Expression of 88 miRNA genes was evaluated using Qiagen's 96 well plate RT2 miRNA qPCR arrays. Employing parallel coordinates plots, there was no observed significant separation for the gene expression (Cq) values, using Roche 480® PCR LightCycler instrument used in this study, and none of the miRNAs showed significant statistical expression after controlling for the false discovery rate. On the other hand, melting temperature profiles produced during PCR amplification run, found seven significant genes (miR-184, miR-203, miR-373, miR-124, miR-96, miR-373 and miR-301a), which separated candidate miRNAs that could function as novel molecular markers of relevance to oxidative stress and immunoglobulin function, for the intake of polyphenol (PP)-rich, functional fermented foods rich in lactobacilli (FS), or their combination. We elaborate on these data, and present a detailed review on use of melt curves for analyzing nutigenomic miRNA expression data, which initially appear to show no significant expressions, but are actually more subtle than this simplistic view, necessitating the understanding of the role of MCA for a comprehensive understanding of what the collective expression and MCA data collectively imply.
Keywords: Biomarkers; DNA; PCR; RNA; SNPs; fermented sobya; food; miRNA; nutrigenomics; pomegranate.
Copyright© 2017, International Institute of Anticancer Research (Dr. George J. Delinasios), All rights reserved.
Figures
References
-
- Ahmed FE, Vos P, James S, Lysle DT, Allison RR, Flake G, Sinar DR, Naziri W, Marcuard SP, Pennington R. Transcriptomic molecular markers for screening human colon cancer in stool and tissue. Cancer Genomics Proteomics. 2007;4:1–20. - PubMed
-
- Lee RC, Feinbaum RL, Ambros V. The C. elegans heterochronic gene lin-4 encodes a small RNAs with antisense complimentarity to lin-14. Cell. 1993;75:843–854. - PubMed
-
- Lund E, Dahlberg JE. Substrate selectivity of exportin 5 and Dicer in the biogenesis of microRNAs. Cold Spring Harb Symp Quant Biol. 2006;71:59–66. - PubMed
-
- Lim LP, Lau NC, Garrett-Engele P, Grimson A, Schelter JM, Castle J, Bartel DP, Linsley PS, Johnson JM. Microarray analysis shows that some microRNAs down-regulate large numbers of target mRNAs. Nature. 2005;433:769–773. - PubMed
Publication types
MeSH terms
Substances
LinkOut - more resources
Full Text Sources
Other Literature Sources
Miscellaneous