

SOX9 predicts progression toward cirrhosis in patients while its loss protects against liver fibrosis
- PMID: 29109128
- PMCID: PMC5709769
- DOI: 10.15252/emmm.201707860
SOX9 predicts progression toward cirrhosis in patients while its loss protects against liver fibrosis
Abstract
Fibrosis and organ failure is a common endpoint for many chronic liver diseases. Much is known about the upstream inflammatory mechanisms provoking fibrosis and downstream potential for tissue remodeling. However, less is known about the transcriptional regulation in vivo governing fibrotic matrix deposition by liver myofibroblasts. This gap in understanding has hampered molecular predictions of disease severity and clinical progression and restricted targets for antifibrotic drug development. In this study, we show the prevalence of SOX9 in biopsies from patients with chronic liver disease correlated with fibrosis severity and accurately predicted disease progression toward cirrhosis. Inactivation of Sox9 in mice protected against both parenchymal and biliary fibrosis, and improved liver function and ameliorated chronic inflammation. SOX9 was downstream of mechanosignaling factor, YAP1. These data demonstrate a role for SOX9 in liver fibrosis and open the way for the transcription factor and its dependent pathways as new diagnostic, prognostic, and therapeutic targets in patients with liver fibrosis.
Keywords: SOX9; YAP1; extracellular matrix; hepatic stellate cells; liver fibrosis.
© 2017 The Authors. Published under the terms of the CC BY 4.0 license.
Figures
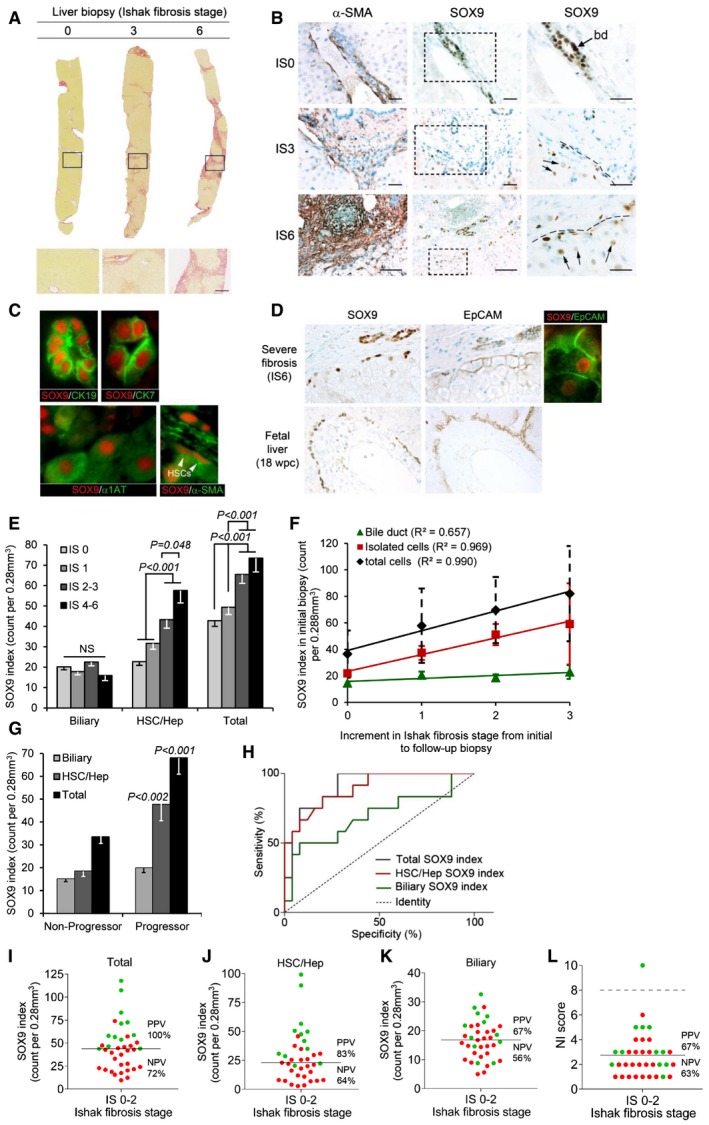
- A
Liver biopsies showing no (IS0), moderate (IS3), and severe (IS6) fibrosis stained by PSR. Size bar, 300 μm.
- B
Immunohistochemistry (brown staining) for αSMA and SOX9 on consecutive sections from patients with no (IS0), moderate (IS3), and severe (IS6) fibrosis. Boxed areas are shown to the right at higher magnification. Bile duct (bd). SOX9 detected in HSCs with elongated nuclei (hatched line) next to scar and in hepatocytes with rounded nuclei (arrows). Size bars, 200 μm.
- C
Immunofluorescence for SOX9 (red) costained with CK19, CK7, α1AT, and αSMA (green). Arrowheads show elongated nuclei in αSMA‐positive HSCs.
- D
Immunohistochemistry for SOX9 and EpCAM (brown staining) on consecutive sections from severe (IS6) fibrosis and normal fetal liver at 18 weeks post‐conception (wpc). Dual immunofluorescence confirms SOX9 and EpCAM in the same cell in severe fibrosis.
- E–G
Data for SOX9 index for the biliary, HSC/Hep, and total (biliary + HSC/Hep) populations. In worsening categories of liver fibrosis (E). In the initial biopsy plotted against the increment in Ishak fibrosis stage between the initial and follow‐up biopsy (F). The lines show the best fit by ordinal logistic regression analysis. In the initial biopsy categorized by whether patients did or did not progress by at least two stages on follow‐up biopsy (G).
- H
Receiver operator curves for the sensitivity and specificity of the SOX9 index in the initial biopsy as a predictor of non‐progressors and progressors.
- I–L
Plots of SOX9 index (total, HSC/Hep, and biliary) and NI score marking progressors in green and non‐progressors in red. The solid line indicates the mean in each graph. The broken line in NI dot plot (L) indicates the threshold (score = 8) below which all NI is categorized as “mild”.
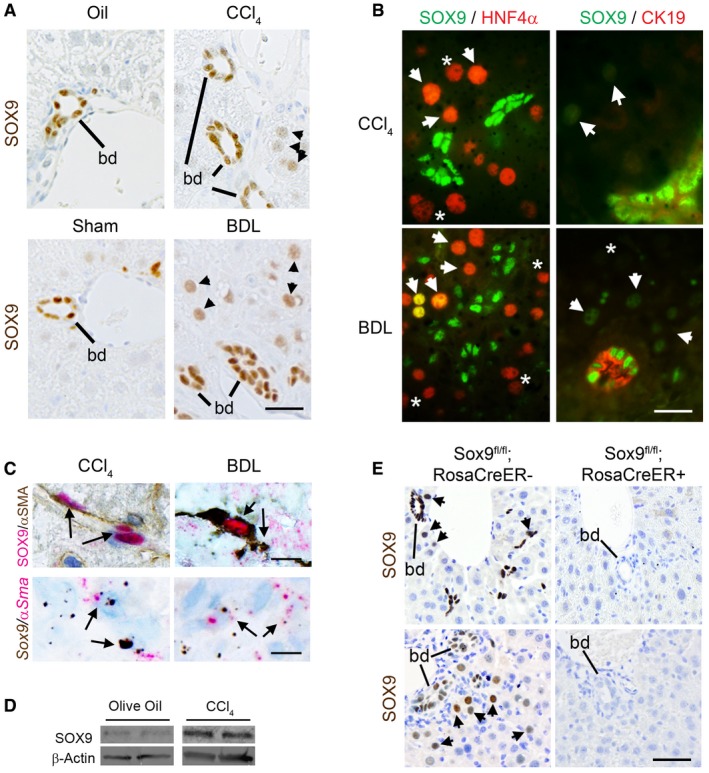
Immunohistochemistry for SOX9 (brown) in wild‐type (WT) mice following CCl4‐ or BDL‐induced fibrosis. SOX9‐positive bile ducts (bd) and hepatocytes (arrowheads) indicated.
(Left panel) Immunofluorescence for SOX9 (green) and HNF4α (red) in WT fibrotic mice. Arrowheads (orange/yellow staining) indicate SOX9+/HNF4α+ hepatocytes, and star (*; red) indicates SOX−/HNF4α+ hepatocytes. (Right panel) Immunofluorescence for SOX9 (green nucleus) and CK19 (red cytoplasm) in WT fibrotic mice. Arrowheads (green) indicate SOX9+ hepatocytes, and star (*) indicates SOX− hepatocytes identified by DAPI staining in Appendix Fig S1.
Co‐localization by immunohistochemistry (top panel) and in situ hybridization (lower panel) for SOX9 (red) and αSMA (brown) in wild‐type (WT) mice following CCl4‐ or BDL‐induced fibrosis.
Expression of SOX9 protein by immunoblotting of in vivo activated HSCs extracted from WT mice following CCl4 injections compared to olive oil control.
Immunohistochemistry for SOX9 (brown) in control (Sox9fl/fl;RosaCreER−) or Sox9‐null (Sox9fl/fl;RosaCreER+) mice following fibrosis. Bile ducts (bd) and hepatocytes (arrowheads) indicated. SOX9 is absent, even in bile ducts in Sox9‐null liver.
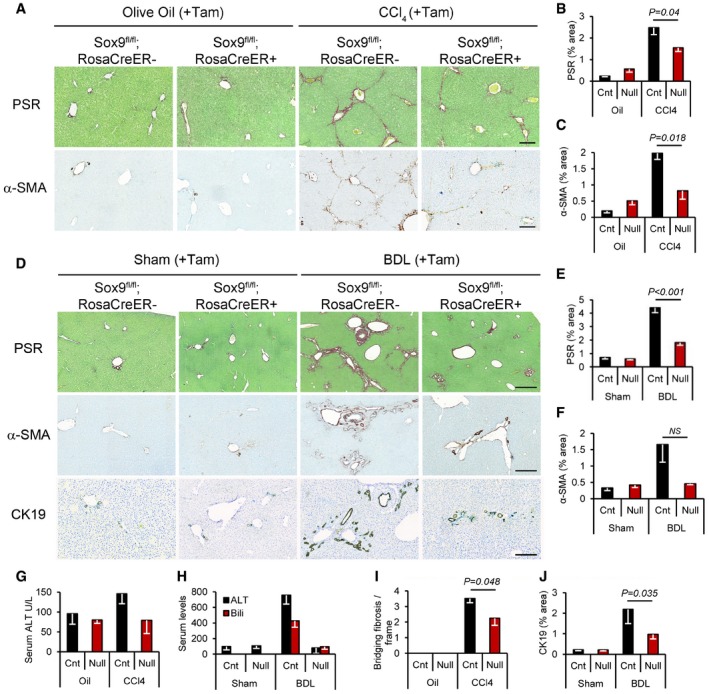
- A
Picrosirius red (PSR) staining (collagen deposition in red) counterstained with fast green (top row) and immunohistochemistry for α‐SMA (brown staining bottom row; activated HSC/myofibroblast marker) in olive oil‐treated (left) or chronic CCl4‐induced fibrosis (right) in control and Sox9‐null mice. Size bars = 200 μm.
- B, C
Quantification of surface area covered by the PSR staining or α‐SMA in control (Cnt) and Sox9‐null (Null) in (A).
- D
PSR staining (red; top row) and immunohistochemistry for α‐SMA (brown; middle row) and CK19 (brown; bottom row) in control and Sox9‐null mice following Sham operation (left) or BDL‐induced fibrosis (right). Size bars = 500 μm.
- E, F
Quantification of surface area covered by the PSR staining or α‐SMA in (D).
- G, H
Liver function is improved in Sox9‐null mice following CCl4 (G)‐ or BDL (H)‐induced fibrosis compared to control mice. Reduction in serum alanine aminotransferase (ALT; G, H) and bilirubin (H) down to levels shown in non‐fibrotic mice (olive oil‐treated groups; oil).
- I
Sox9 loss improved severity of fibrosis compared to control mice indicated by quantification of bridging fibrosis in PSR sections following CCl4. Olive oil‐treated mice had no bridging fibrosis, in line with a non‐fibrotic liver histology in (A).
- J
Ductal hyperplasia as quantified by the surface area covered by CK19‐positive ducts in (D) is reduced in Sox9‐null mice compared to control following BDL.
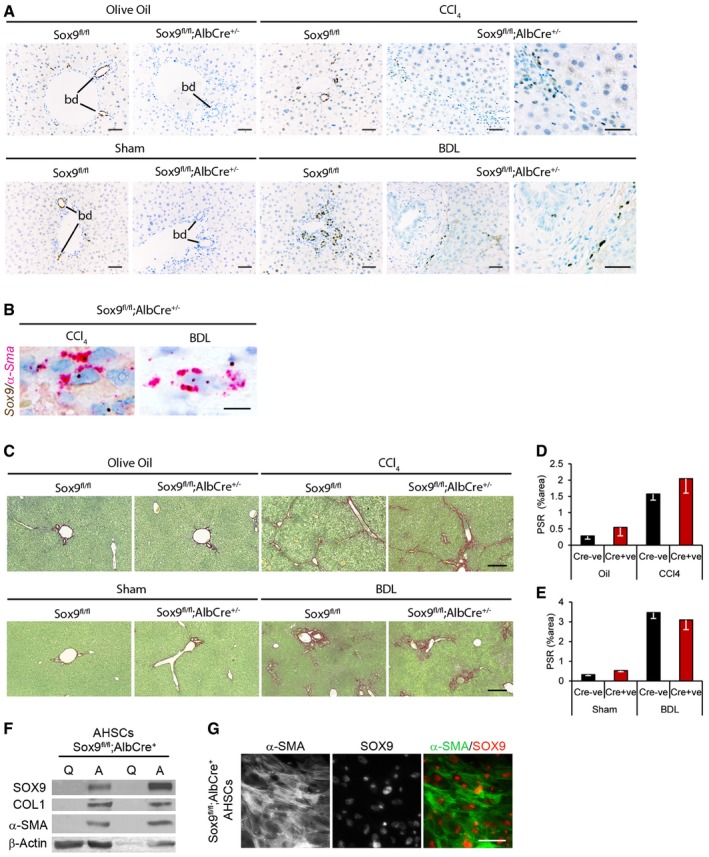
- A–C
Representative images shown for olive oil‐treated (n = 5) or chronic CCl4 (n = 5)‐induced fibrosis or following sham operation (n = 6 Sox9fl/fl;AlbCre−; n = 5 Sox9fl/fl;AlbCre+) or BDL (n = 5 Sox9fl/fl;AlbCre−; n = 8 Sox9fl/fl;AlbCre+)‐induced fibrosis. SOX9 immunohistochemistry (brown; A), in situ hybridization for Sox9 (brown) and α‐Sma (red) and collagen deposition by PSR staining (red; B) in control (Sox9fl/fl;AlbCre−) or Sox9‐null (Sox9fl/fl;AlbCre+) mice following fibrosis. Higher magnified image of SOX9 localization in discrete cells within the scar is shown for CCl4 and BDL in the Sox9fl/fl;AlbCre+ mice (A).
- D, E
Quantification of surface area covered by the PSR staining in (C).
- F
Expression of SOX9 protein by immunohistochemistry in quiescent (Q) and activated (A) HSCs extracted from Sox9fl/fl;AlbCre+ mice.
- G
Individual fluorescent channels showing localization and expression of α‐SMA (left panel), SOX9 (middle panel), and composite image for α‐SMA (green) and SOX9 (red) in right panel in activated Sox9fl/fl;AlbCre+ HSCs (genotyping shown in Appendix Fig S9).
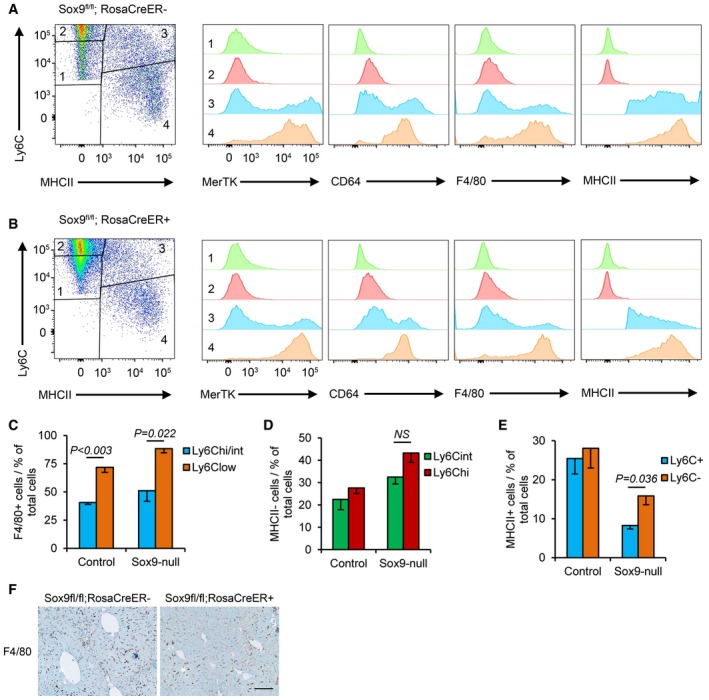
- A, B
Flow cytometry of CD45+ CD11B+ cells in control (Sox9fl/fl;RosaCre−; A) and Sox9‐null (Sox9fl/fl;RosaCre+; B) livers stained for Ly6C and MHCII (far left) to identify four populations of cells with differences in their expression of MerTK, CD64, F4/80, and MHCII.
- C
Graphical representation of Ly6C and F4/80 staining in macrophages from populations 3 and 4.
- D, E
Graphical representation of cell numbers in the four Ly6C and MHCII cell populations in control and Sox9‐null livers. Data are representative of four independent experiments.
- F
F4/80 immunohistochemistry (brown staining) in control and Sox9‐null mice livers following 4‐week CCl4‐induced fibrosis. Size bar = 100 μm.
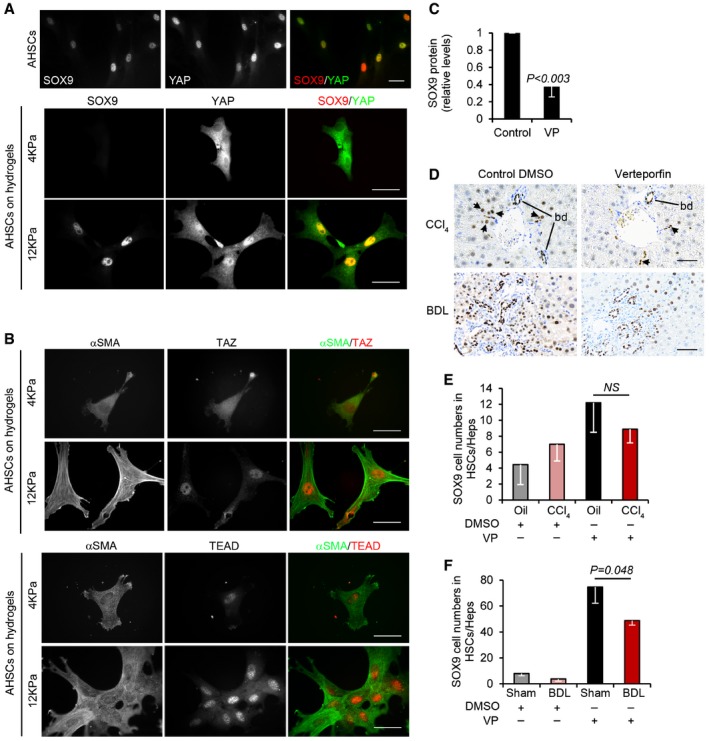
- A, B
Immunofluorescence of activated mouse HSCs cultured on plastic (A) or hydrogels (A, B). Individual fluorescent channels showing localization and expression of SOX9 (left), YAP (middle), and composite image for SOX9 (red) and YAP (green) in right panel. (B) Individual and composite images for αSMA (green) and TAZ (red) or TEAD (red). Size bars, 25 μm.
- C
Quantified decrease in SOX9 protein levels following inhibition of YAP using verteporfin (VP) in activated mouse HSCs expressed relative to DMSO control (n = 3).
- D
Immunohistochemistry for SOX9 (brown) following CCl4‐ or BDL‐induced fibrosis in mice treated with DMSO (CCl4 n = 4, BDL n = 7) or verteporfin (CCl4 n = 3, BDL n = 5). Size bar, 50 μm.
- E, F
Quantification of SOX9 cell numbers in the HSC/Hep population.
References
-
- De Minicis S, Seki E, Uchinami H, Kluwe J, Zhang Y, Brenner DA, Schwabe RF (2007) Gene expression profiles during hepatic stellate cell activation in culture and in vivo . Gastroenterology 132: 1937–1946 - PubMed
Publication types
MeSH terms
Substances
Grants and funding
LinkOut - more resources
Full Text Sources
Other Literature Sources
Medical
Molecular Biology Databases
Research Materials
Miscellaneous
