. 2017 Dec 13;37(50):12297-12313.
doi: 10.1523/JNEUROSCI.0986-17.2017. Epub 2017 Nov 6.

Graded Elevation of c-Jun in Schwann Cells In Vivo: Gene Dosage Determines Effects on Development, Remyelination, Tumorigenesis, and Hypomyelination

Affiliations

Graded Elevation of c-Jun in Schwann Cells In Vivo: Gene Dosage Determines Effects on Development, Remyelination, Tumorigenesis, and Hypomyelination

Shaline V Fazal et al. J Neurosci. .

Abstract

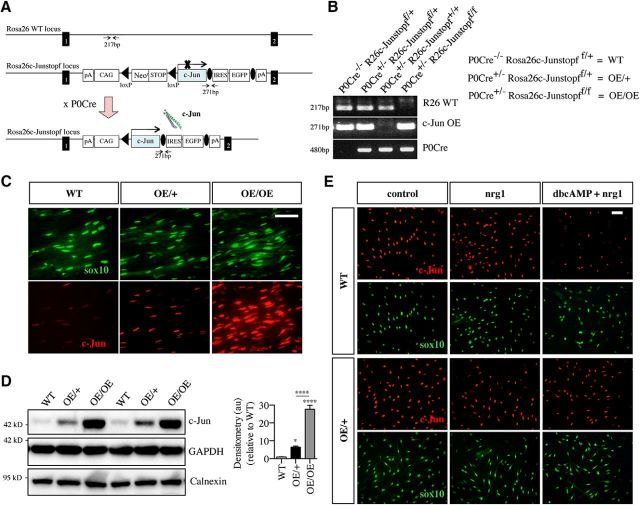
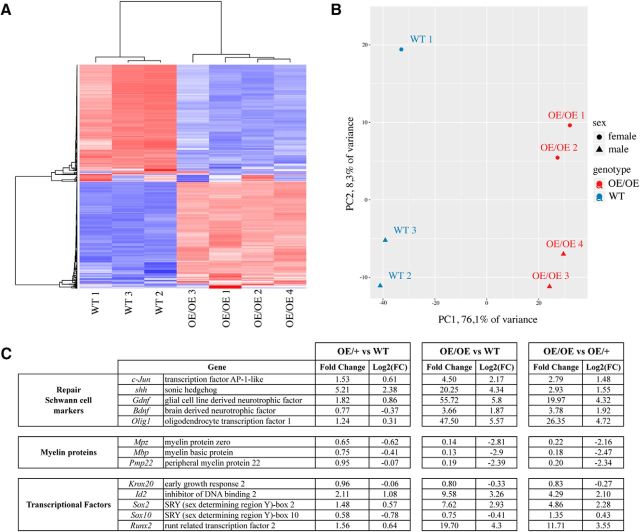
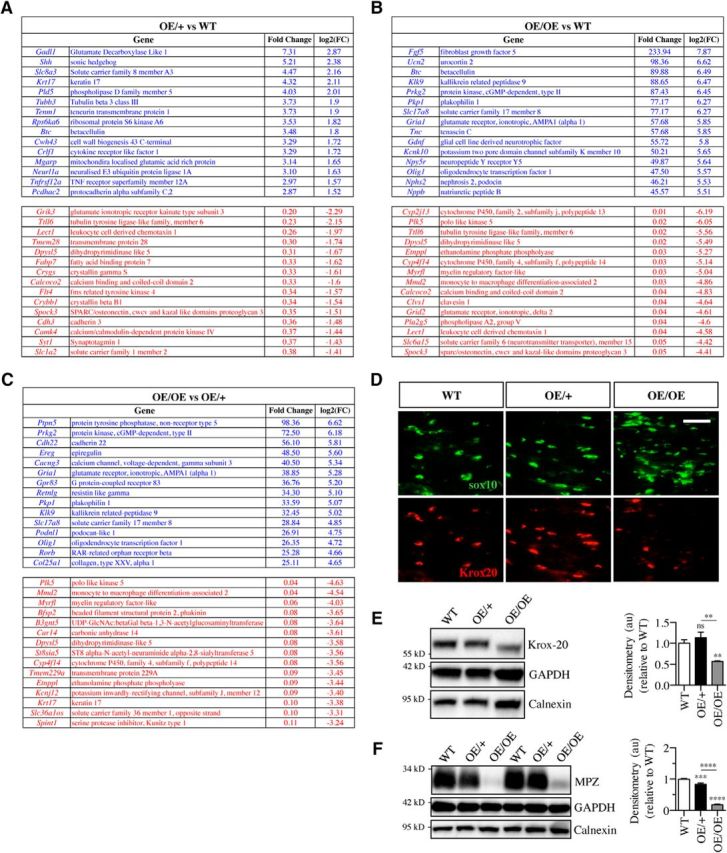
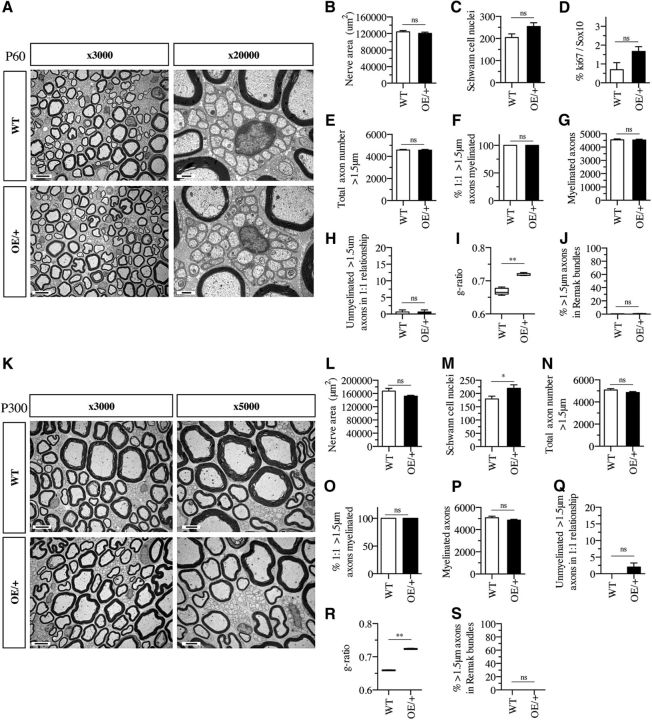
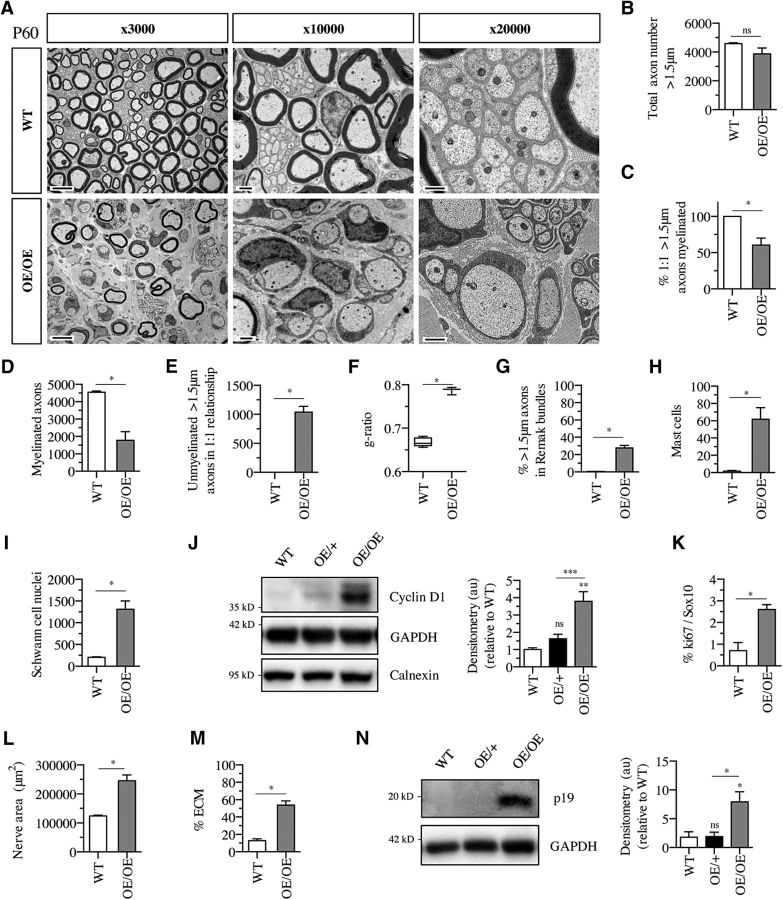
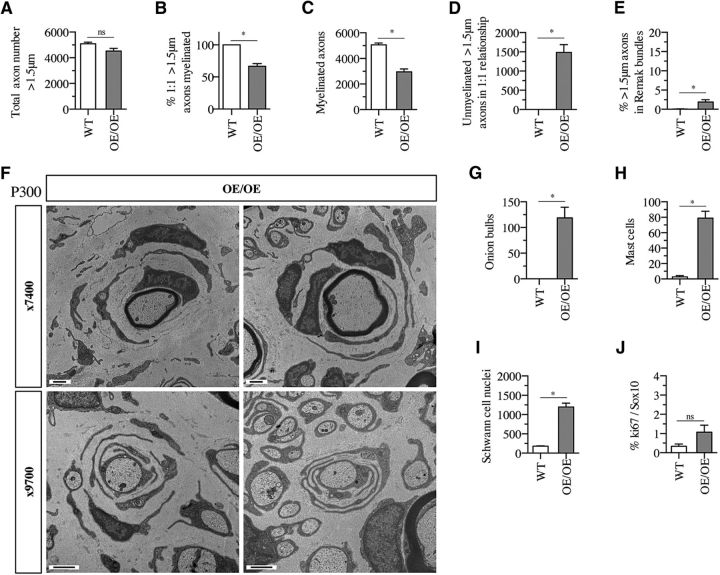
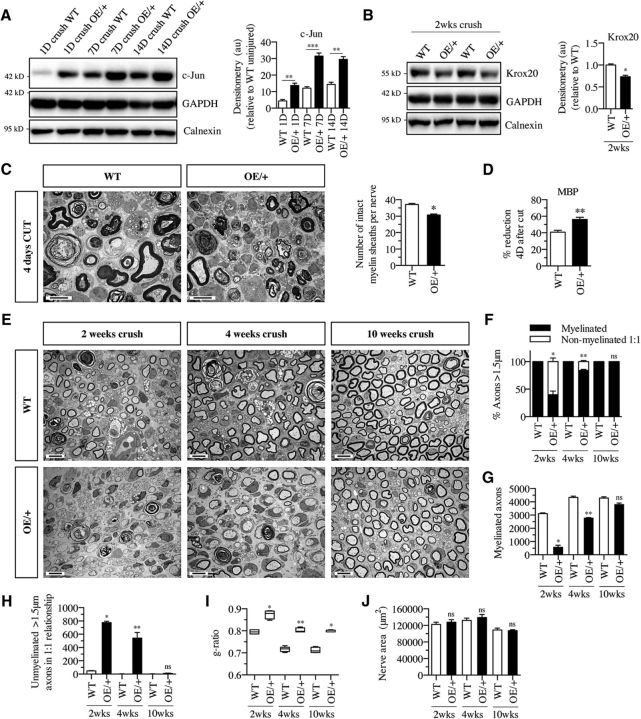
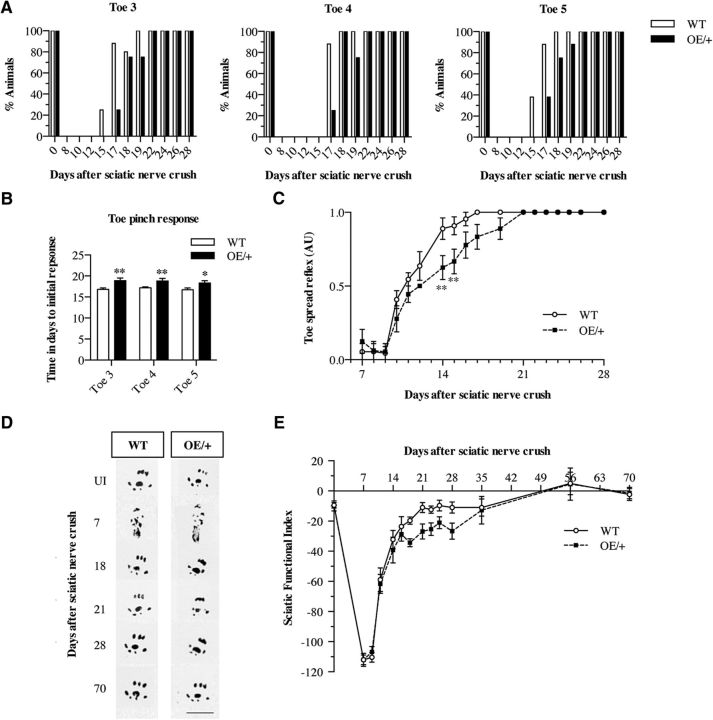
Schwann cell c-Jun is implicated in adaptive and maladaptive functions in peripheral nerves. In injured nerves, this transcription factor promotes the repair Schwann cell phenotype and regeneration and promotes Schwann-cell-mediated neurotrophic support in models of peripheral neuropathies. However, c-Jun is associated with tumor formation in some systems, potentially suppresses myelin genes, and has been implicated in demyelinating neuropathies. To clarify these issues and to determine how c-Jun levels determine its function, we have generated c-Jun OE/+ and c-Jun OE/OE mice with graded expression of c-Jun in Schwann cells and examined these lines during development, in adulthood, and after injury using RNA sequencing analysis, quantitative electron microscopic morphometry, Western blotting, and functional tests. Schwann cells are remarkably tolerant of elevated c-Jun because the nerves of c-Jun OE/+ mice, in which c-Jun is elevated ∼6-fold, are normal with the exception of modestly reduced myelin thickness. The stronger elevation of c-Jun in c-Jun OE/OE mice is, however, sufficient to induce significant hypomyelination pathology, implicating c-Jun as a potential player in demyelinating neuropathies. The tumor suppressor P19ARF is strongly activated in the nerves of these mice and, even in aged c-Jun OE/OE mice, there is no evidence of tumors. This is consistent with the fact that tumors do not form in injured nerves, although they contain proliferating Schwann cells with strikingly elevated c-Jun. Furthermore, in crushed nerves of c-Jun OE/+ mice, where c-Jun levels are overexpressed sufficiently to accelerate axonal regeneration, myelination and function are restored after injury.SIGNIFICANCE STATEMENT In injured and diseased nerves, the transcription factor c-Jun in Schwann cells is elevated and variously implicated in controlling beneficial or adverse functions, including trophic Schwann cell support for neurons, promotion of regeneration, tumorigenesis, and suppression of myelination. To analyze the functions of c-Jun, we have used transgenic mice with graded elevation of Schwann cell c-Jun. We show that high c-Jun elevation is a potential pathogenic mechanism because it inhibits myelination. Conversely, we did not find a link between c-Jun elevation and tumorigenesis. Modest c-Jun elevation, which is beneficial for regeneration, is well tolerated during Schwann cell development and in the adult and is compatible with restoration of myelination and nerve function after injury.

Keywords: PNS; Schwann; c-Jun; myelin; regeneration; tumorigenesis.


Figures

Figure 1.
Figure 1.
Graded overexpression of c-Jun Schwann cell nuclei of c-Jun OE/+ and c-Jun OE/OE mice. A, Genomic structure of the c-Jun floxed allele in the Rosa26 locus. Excision of the stop codon is effected by crossing Rosa26c-Junff/+ mice with P0 cre-expressing mice to generate c-Jun OE/+ and c-Jun OE/OE mice overexpressing c-Jun specifically in Schwann cells. B, PCR analysis showing the presence of c-Jun OE, Rosa26 WT, and P0 cre bands from DNA samples extracted from tails of WT, c-Jun OE/+, and c-Jun OE/OE mice. C, Representative immunofluorescence images from WT, OE/+, and OE/OE sciatic nerve cryosections showing Sox10- and c-Jun-positive nuclei. Note the graded increase in c-Jun in c-JunOE/+ and c-Jun OE/OE mice. Scale bar, 50 μm. D, Western blot of sciatic nerve protein extracts from P60 WT, c-Jun OE/+, and c-Jun OE/OE mice showing increasing c-Jun levels. The graph quantifies c-Jun expression in WT (n = 7), c-Jun OE/+ (n = 6), and c-Jun OE/OE (n = 6) mice. The quantifications are normalized to the levels in uninjured WT nerves, which are set as 1. Note that the difference in c-Jun expression between c-Jun OE/+ and c-Jun OE/OE nerves is also significant. One-way ANOVA with Tukey's comparison; *p < 0.05, ****p < 0.0001. E, Representative immunofluorescence images from purified Schwann cell cultures from WT and c-Jun OE/+ mice. The cells were exposed to neuregulin (nrg) alone or neuregulin plus cAMP analog (dbcAMP), a combination that mimics axonal myelination signals. Note that neuregulin plus dbcAMP suppresses c-Jun in WT, but not in c-Jun OE/+, cells. Sox10 was used as a Schwann cell marker to show levels of c-Jun specifically in Schwann cells.
Figure 2.
Figure 2.
Gene expression in c-Jun OE/+ and c-Jun OE/OE mice. A, Heat map of the 400 most regulated genes in uninjured nerves of WT and c-Jun OE/OE mice. B, Principal component analysis map of gene regulation in WT and c-Jun OE/OE nerves. C, Expression of 13 genes of interest in the sciatic nerve of OE/+ and OE/OE mice. The table shows how c-Jun elevation affects the expression of a subset of repair cell markers, myelin proteins, and transcription factors in the mouse lines indicated. Note that, in OE/+ nerves, only Shh is regulated ≥2-fold. In OE/OE nerves, repair cell markers are upregulated and myelin genes are downregulated, although two important myelin regulators, Krox20 and Sox10, are not strongly affected. WT, n = 3; OE/+, n = 4; and OE/OE, n = 4.
Figure 3.
Figure 3.
The 15 most upregulated and downregulated genes in the sciatic nerve of OE/+ and OE/OE mice. A, B, The 15 most strongly elevated genes (top) and the 15 most suppressed genes (bottom) in response to c-Jun elevation in the mouse lines indicated. C, The 15 most strongly regulated gene in OE/OE nerves compared with expression in OE/+ nerves. D, Representative immunofluorescence images from WT, c-Jun OE/+, and c-Jun OE/OE sciatic nerve cryosections showing Krox20 in Sox10-positive Schwann cell nuclei. Note similar Krox20 expression in WT and c-Jun OE/+ nerves, but much reduced levels in c-Jun OE/OE nerves. Scale bar, 50 μm. E, Western blot of sciatic nerve protein extracts from P60 mice showing similar levels of Krox20 in WT and c-Jun OE/+ nerves, but lower levels in c-Jun OE/OE nerves. The graph quantifies Krox20 expression in WT (n = 5), c-Jun OE/+ (n = 4), and c-Jun OE/OE (n = 5) mice. The quantifications are normalized to the levels in uninjured WT nerves, which are set as 1. One-way ANOVA with Tukey's comparison: *p < 0.05, **p < 0.01. F, Western blot of sciatic nerve protein extracts from P60 mice. Note that Mpz expression is 15% lower than WT in c-Jun OE/+ nerves, but strongly suppressed in c-Jun OE/OE nerves. The graph quantifies Mpz expression in WT (n = 5), c-Jun OE/+ (n = 4), and c-Jun OE/OE (n = 5) mice. The quantifications are normalized to the levels in uninjured WT nerves, which are set as 1. One-way ANOVA with Tukey's comparison: ****p < 0.0001.
Figure 4.
Figure 4.
Electron microscopic structure of adult nerves in WT and OE/+ mice. A, Electron micrographs showing similar overall appearance of nerves from P60 WT and OE/+ mice. Scale bar, 5 μm. B, Total area of P60 WT and OE/+ mouse nerves is not significantly different. Mann–Whitney U test: p = 0.5317 (n = 5). C, The number of Schwann cell nuclei per sciatic nerve profiles is not significantly different between P60 WT and OE/+ nerves. Mann–Whitney U test: p = 0.0952 (n = 5). D, Counts of Ki67-positive/Sox10-positive nuclei indicate that the difference in Schwann cell proliferation between WT and c-Jun OE/+ mice is not significantly different. Mann–Whitney U test: p = 0.2000 (n = 3). E, The total number of axons larger than 1.5 μm in diameter is similar in P60 WT and OE/+ nerves. Mann–Whitney U test: p = 0.9444 (n = 5). F, The percentage of axons in a 1: 1 relationship and >1.5 μm in diameter that are myelinated is similar in P60 WT and OE/+ nerves. Mann–Whitney U test: p > 0.9999 (n = 5). G, Per nerve profile, the number of myelinated axons is similar in P60 WT and OE/+ nerves. Mann–Whitney U test: p = 0.8016 (n = 5). H, Per nerve profile, the number of axons in a 1:1 relationship and >1.5 μm in diameter but not myelinated is not significantly different between P60 WT and OE/+nerves. Mann–Whitney U test: p > 0.999 (n = 5). I, Myelin thickness measured by g-ratios is thinner in P60 OE/+ nerves compared with WT. The whiskers extend from the 5th to the 95th percentiles. Mann–Whitney U test: p = 0.0079 (n = 5). J, The percentage of axons >1.5 μm in diameter that remain unmyelinated and within Remak bundles is very low and similar in P60 WT and OE/+ nerves. Mann–Whitney U test: p = 0.1508 (n = 5). K, Electron micrographs showing that the overall structure of adult P300 nerves in WT and OE/+mice is similar. Scale bar, 5 μm. L, The area of transverse profiles of P300 WT (n = 4) and OE/+ (n = 5) nerves is not statistically different. Mann–Whitney U test: p = 0.2857. M, The number of Schwann cell nuclei per sciatic nerve profile is somewhat higher in P300 OE/+ (n = 5) nerves compared with WT (n = 4). Mann–Whitney U test: p = 0.0317. N, The total number of axons larger than 1.5 μm in diameter is similar in P300 WT (n = 4) and c-Jun OE/+ (n = 5) nerves. Mann–Whitney U test: p = 0.1905. O, The percentage of axons in a 1:1 relationship and >1.5 μm in diameter that are myelinated is similar in P300 WT (n = 4) and OE/+ (n = 5) nerves. Mann–Whitney U test: p = 0.4444. P, The numbers of myelinated axons per nerve profile is similar in P300 WT (n = 4) and OE/+ (n = 5) nerves. Mann–Whitney U test: p = 0.1905. Q, Per nerve profile, the number of axons that are >1.5 μm in diameter and in a 1:1 relationship but not myelinated is not significantly different between P300 WT (n = 4) and OE/+ (n = 5) nerves. Mann–Whitney U test: p = 0.4444. R, Measured by g-ratios, myelin is thinner in P300 OE/+ (n = 5) nerves than in WT (n = 4). The whiskers extend from the 5th to the 95th percentiles. Mann–Whitney U test: p = 0.0079. S, The percentage of unmyelinated axons >1.5 μm in diameter that remain in Remak bundles is similar in P300 WT (n = 4) and OE/+ (n = 5) nerves. Mann–Whitney U test: p > 0.9999.
Figure 5.
Figure 5.
High c-Jun levels in c-Jun OE/OE nerves result in hypomyelination. A, Electron micrographs showing lack of myelin and increased connective tissue spaces in P60 c-Jun OE/OE nerves compared with WT. B, The total number of axons larger than 1.5 μm in diameter is not significantly different in P60 WT (n = 5) and c-Jun OE/OE (n = 3) nerves. Mann–Whitney U test: p = 0.0714. C, The percentage of axons in a 1: 1 relationship and >1.5 μm in diameter that are myelinated is lower in c-Jun OE/OE mice than in WT (n = 5) and OE/OE (n = 3) nerves. Mann–Whitney U test: p = 0.0179. D, The number of myelinated axons per nerve profile is substantially reduced in c-Jun OE/OE (n = 3) nerves compared with WT (n = 5). Mann–Whitney U test: p = 0.0357. E, Per nerve profile, the number of axons in a 1:1 relationship and >1.5 μm in diameter but not myelinated is much higher in OE/OE (n = 3) nerves than in WT (n = 5). Mann–Whitney U test: p = 0.0179. F, Myelin, measured as g-ratios, is thinner in OE/OE (n = 3) mice compared with WT (n = 5). The whiskers extend from the 5th to the 95th percentiles. Mann–Whitney U test: p = 0.0357. G, The percentage of unmyelinated axons >1.5 μm in diameter that remain in Remak bundles is higher in OE/OE (n = 3) nerves than in WT (n = 5) nerves. Mann–Whitney U test: p = 0.0357. H, Nerves in c-Jun OE/OE mice (n = 3) contain more mast cells that nerves in WT mice (n = 5). Mann–Whitney U test: p = 0.0179. I, OE/OE (n = 3) nerves show more Schwann cell nuclei per nerve profile than WT (n = 5) nerves. Mann–Whitney U test: p = 0.0357. J, Western blot of sciatic nerve protein extracts from P60 mice. Note that levels of cyclin D1 (a marker of cell proliferation) are significantly higher in OE/OE nerves than in WT or OE/+ or nerves. The results are quantified in the graph. WT, n = 5; OE/+, n = 4; and OE/OE, n = 5. The quantifications are normalized to the levels in uninjured WT nerves, which are set as 1. One-way ANOVA with Tukey's comparison: *p < 0.05, **p < 0.01. K, Counts of Ki67-positive/Sox10-positive nuclei indicate a higher rate of Schwann cell proliferation in c-Jun OE/OE mice (n = 5) compared with WT (n = 3). Mann–Whitney U test: p = 0.0179. L, The area of transverse profiles of OE/OE (n = 3) nerves is larger than of WT nerves. Mann–Whitney U test: p = 0.0357 (n = 5). M, Tracing of cell profiles and extracellular space (ECM) in transverse nerve sections, followed by area measurements, shows a relative increase in extracellular space in OE/OE (n = 3) nerves compared with WT (n = 5). Mann–Whitney U test: p = 0.0357. N, Western blot of sciatic nerve protein extracts from P60 mice. Note increased expression of the tumor suppressor p19ARF. The results are quantified in the graph. The quantifications are normalized to the levels in uninjured WT nerves, which are set as 1. One-way ANOVA with Tukey's comparison: *p < 0.05 (n = 3).
Figure 6.
Figure 6.
Nerves of aged c-Jun OE/OE mice. A, The nerves of P300 c-Jun OE/OE mice and WT mice contain comparable numbers of axons. Mann–Whitney U test: p = 0.1143 (n = 4). B, In P300 c-Jun OE/OE mice, the percentage of axons in a 1: 1 relationship and >1.5 μm in diameter that are myelinated is lower than in WT mice. Mann–Whitney U test: p = 0.0286 (n = 4). C, In P300 c-Jun OE/OE mice, the number of myelinated axons per nerve profile is reduced compared with WT. Mann–Whitney U test: p = 0.0286 (n = 4). D, Per nerve profile, P300 c-Jun OE/OE mice have a much larger number of unmyelinated axons that are >1.5 μm in diameter and in a 1:1 relationship and compared with WT mice. Mann–Whitney U test: p = 0.0286 (n = 4). E, The percentage of unmyelinated axons >1.5 μm in diameter that are found within Remak bundles is higher in OE/OE nerves than in WT nerves. Mann–Whitney U test: p = 0.0286 (n = 4). F, Electron micrographs from nerves of P300 c-Jun OE/OE mice showing examples of onion bulbs. The central axon, which is sometimes myelinated (top), is surrounded by relatively few layers of flattened Schwann cells, suggesting an early stage of bulb formation. Scale bar, 1 μm. G, The number of onion bulbs in P300 OE/OE nerves is much higher than in WT nerves. Mann–Whitney U test: p = 0.0286 (n = 4). H, P300 OE/OE nerves contain a higher number of mast cells than WT nerves. Mann–Whitney U test: p = 0.0286 (n = 4). I, Nerves in P300 c-Jun OE/OE mice show more Schwann cell nuclei per nerve profile than nerves in WT mice. Mann–Whitney U test: p = 0.0286 (n = 4). J, The rate of Schwann cell proliferation is not significantly higher in P300 OE/OE nerves than in WT nerves, as shown by the counts of Ki67-positive/Sox10-positive nuclei. Mann–Whitney U test: p = 0.1000 (n = 3).
Figure 7.
Figure 7.
Developmental overexpression of c-Jun delays myelination in c-Jun OE/+ mice, but inhibits myelination in c-Jun OE/OE mice. A, Western blot of nerve extracts from P1 and P7 sciatic nerves. The results are quantified in the graphs. Data from P1 nerves are normalized to levels in P1 WT nerve, which are set as 1, whereas data from P7 nerves are normalized to levels in P7 WT nerve, which are set as 1. Note that, by P7, c-Jun is elevated in both OE/+ and OE/OE nerves, whereas Mpz is reduced in OE/OE nerves only. P1 WT, n = 3; OE/+, n = 3; P7 WT, n = 4; OE/+, n = 4; and OE/OE, n = 3. Statistical analysis for P1 is Student's t test: p = 0.0608 for c-Jun, p = 0.0174 for Mpz. Statistical analysis for P7 is one-way ANOVA with Tukey's comparison: *p < 0.05, **p < 0.01, ****p < 0.0001. B, Western blot of nerve extracts from P7 WT, OE/+, and OE/OE nerves. The results are quantified in the graph. Krox20 levels are similar in all genotypes. One-way ANOVA with Tukey's comparison: p = 0.2053 (n = 3). C, The percentage of Krox20/Sox10-positive Schwann cells in sections from WT (n = 8), OE/+ (n = 6), and OE/OE (n = 3) sciatic nerves at P7. Note a graded decrease in Krox20-positive cells as levels of c-Jun increase. One-way ANOVA with Tukey's comparison: *p < 0.05, ***p < 0.001. D, Representative electron micrographs from P1, P7, and P21 nerves of WT, c-Jun OE/+, and c-Jun OE/OE mice. Note hypomyelination in OE/OE nerve at P7 and P21 and transient hypomyelination in OE/+ nerves at P7. Scale bar, 5 μm. E, The nerve areas are similar in all three genotypes at all developmental stages. One-way ANOVA with Tukey's comparison: P1 WT (n = 5), OE/+ (n = 4), and OE/OE (n = 5), p = 0.1978; P7 WT (n = 5), OE/+ (n = 5), and OE/OE (n = 3), p = 0.2261; and P21 WT (n = 5), OE/+ (n = 4), and OE/OE (n = 4), p = 0.084. F, The number of Schwann cell nuclei per sciatic nerve profile at P1, P7, and P21 in nerves of WT, c-Jun OE/+, and c-Jun OE/OE mice. Note the transient difference between WT and OE/+ nerves at P7, whereas OE/OE nerves have more Schwann cells at P7 and P21. P1 WT, n = 5; OE/+, n = 4; and OE/OE, n = 5; P7 WT, n = 5; OE/+, n = 5; and OE/OE, n = 3; and P21 WT, n = 5; OE/+, n = 4; and OE/OE, n = 4. One-way ANOVA with Tukey's comparison: **p < 0.01, ***p < 0.001, ****p < 0.0001. G, The percentage of axons in a 1:1 relationship and >1.5 μm in diameter that are myelinated at P1, P7, and P21 in nerves of WT, c-Jun OE/+, and c-Jun OE/OE mice. Note reduced myelination in OE/OE mice at P7 and P21 and transient reduction in OE/+ mice at P7. P1 WT, n = 5; OE/+, n = 4; and OE/OE, n = 5; P7 WT, n = 5; OE/+, n = 5; and OE/OE, n = 3; and P21 WT, n = 5; OE/+, n = 4; and OE/OE, n = 4;. One-way ANOVA with Tukey's comparison: **p < 0.01 and ***p < 0.001. H, The number of myelinated axons per nerve profile at P1, P7, and P21 in nerves of WT, c-Jun OE/+, and c-Jun OE/OE mice. Note the substantial reduction in myelinated axons in OE/OE nerves at P7 and P21 and transient decrease in OE/+ mice at P7. P1 WT, n = 5; OE/+, n = 4; and OE/OE, n = 5; P7 WT, n = 5; OE/+, n = 5; and OE/OE, n = 3; and P21 WT, n = 5; OE/+, n = 4; and OE/OE, n = 4;. One-way ANOVA with Tukey's comparison: *p < 0.05, **p < 0.01, ***p < 0.001, ****p < 0.0001. I, The number of axons in a 1:1 relationship and >1.5 μm in diameter that remain unmyelinated at P1, P7, and P21 in nerves of WT, c-Jun OE/+, and c-Jun OE/OE mice. Note the increase in unmyelinated axons in OE/OE nerves at P7 and P21, but at P7 only in OE/+ mice. P1 WT, n = 5; OE/+, n = 4; and OE/OE, n = 5; P7 WT, n = 5; OE/+, n = 5; and OE/OE, n = 3; and P21 WT, n = 5; OE/+, n = 4; and OE/OE, n = 4. One-way ANOVA with Tukey's comparison: **p < 0.01, ***p < 0.001, ****p < 0.0001. J, Reduction in myelin thickness, measured as g-ratios, which is seen in the adults in both OE/+ and OE/OE nerves, is already present at P7 and P21. P7 WT, n = 5; OE/+, n = 5; and OE/OE, n = 3; and P21 WT, n = 5; OE/+, n = 4; and OE/OE, n = 4. The whiskers extend from the 5th to the 95th percentiles. One-way ANOVA with Tukey's comparison: *p < 0.05, **p < 0.01, ***p < 0.001. K, The percentage of unmyelinated axons that are >1.5 μm in diameter in Schwann cell families or Remak bundles at P1, P7, and P21 in nerves of WT, c-Jun OE/+, and c-Jun OE/OE mice. Abnormally high numbers are seen in OE/OE nerves only. P1 WT, n = 5; OE/+, n = 4; and OE/OE, n = 5; P7 WT, n = 5; OE/+, n = 5; and OE/OE, n = 3; and P21 WT, n = 5; OE/+, n = 4; and OE/OE, n = 4. One-way ANOVA with Tukey's comparison: *p < 0.05, **p < 0.01, ***p < 0.001. L, Western blot of nerve extracts from P7 WT (n = 3), OE/+ (n = 3), and OE/OE (n = 3) sciatic nerves showing cyclin D1, an indicator of cell proliferation. Quantification of the data are normalized to levels in P7 WT nerve, which are set as 1. Cyclin D1 levels are similar in all mouse lines. One-way ANOVA with Tukey's comparison: p = 0.3871. M, Counts of Ki67-positive/Sox10-positive nuclei in P7 in WT (n = 6), OE/+ (n = 6), and OE/OE (n = 3) nerves. OE/OE nerves show increased Schwann cell proliferation. One-way ANOVA with Tukey's comparisons: *p = 00121. In EK, p-values are calculated relative to WT at the same age.
Figure 8.
Figure 8.
Remyelination of OE/+ nerves is delayed. A, Western blot of c-Jun in nerve extracts from the distal stump of adult WT (n = 4) and OE/+ (n = 4) nerves 1 d, 7 d, and 2 weeks after crush. The graph shows quantification of the results normalized to levels in uninjured WT nerves, which are set as 1. Note significant elevation of c-Jun at all time points. Mann–Whitney U test: 1 d, p = 0.0006 (n = 4); 7 d, p = 0.0002 (n = 4); and 2 weeks, p = 0.0022 (n = 4). B, Western blot of nerve extracts from the distal stump of adult WT and OE/+ nerves 2 weeks after crush. The results are quantified in the graph and normalized to levels in 2 week crushed WT nerve, which are set as 1. Krox20 levels are reduced in OE/+ nerves. Mann–Whitney U test: p = 0.0286 (n = 4). C, Representative electron micrographs from the distal stump 4 d after sciatic nerve cut in WT and c-Jun OE/+ mice illustrating collapsed myelin sheaths. The graph shows that fewer intact myelin sheaths per nerve profile remain in OE/+ nerves than in WT. Mann–Whitney U test: p = 0.0286 (n = 4). D, Transected c-Jun OE/+ nerves clear myelin protein faster than WT nerves. The graph shows the reduction in MBP 4 d after transection expressed as a percentage of MBP in uninjured nerve. WT and c-Jun OE/+ nerves have cleared close to 40% and 60% of their MBP content, respectively. The data are obtained from quantitation of Western blots. WT, n = 4; OE/+, n = 8. Mann–Whitney U test: p = 0.0070. E, Representative electron micrographs from the distal stump of WT and OE/+ nerves 2, 4, and 10 weeks after crush. In OE/+ nerves, the number of myelinated axons, which is reduced at 2 and 4 weeks, has recovered at 10 weeks. Scale bar, 5 μm. F, The percentage of axons >1.5 μm in diameter and in a 1:1 ratio that are myelinated in the distal stump of WT and c-Jun OE/+ mice 2, 4, and 10 weeks after nerve crush. Note that myelination in OE/+ nerves, which is reduced at 2 weeks, has recovered substantially by 4 weeks and is normal at 10 weeks. Mann–Whitney U test: 2 weeks, p = 0.0286 (n = 4); 4 weeks, p = 0.0079 (n = 5); and 10 weeks, p = 0.0571 (n = 4). G, The number of myelinated axons per nerve profile of the distal stump of WT and c-Jun OE/+ mice 2, 4, and 10 weeks after nerve crush. In c-Jun OE/+ mice, few myelinated axons are present at 2 weeks, but normal numbers are seen at 10 weeks. Mann–Whitney U test: 2 weeks, p = 0.0286 (n = 4); 4 weeks, p = 0.0079 (n = 5); and 10 weeks, p = 0.0571 (n = 4). H, The number of unmyelinated axons >1.5 μm in diameter and in a 1:1 relationship that have not myelinated in the distal stump of WT and OE/+ nerves 2, 4, and 10 weeks after crush. Two and 4 week crushed OE/+ nerves contain elevated numbers of umyelinated axons, but their number has fallen to normal levels at 10 weeks. Mann–Whitney U test: 2 weeks, p = 0.0286 (n = 4); 4 weeks, p = 0.0079 (n = 5); and 10 weeks, p = 0.1143 (n = 4). I, Myelin thickness, measured as g-ratios, is reduced in the distal stump of OE/+ nerves at all time points after crush. The whiskers extend from the 5th to the 95th percentiles. Mann–Whitney U test: 2 weeks, p = 0.0286 (n = 4); 4 weeks, p = 0.0079 (n = 5); and 10 weeks, p = 0.0286 (n = 4). J, The area of transverse sections through the distal stump 2, 4, and 10 weeks after crush is similar in WT and OE/+ nerves. Mann–Whitney U test: 2 weeks, p = 0.6571 (n = 4); 4 weeks, p = 0.3095 (n = 5); and 10 weeks, p = 0.9004 (n = 4). In A and FJ, p-values are calculated relative to WT at the same time after injury.
Figure 9.
Figure 9.
Functional recovery is slightly delayed in c-Jun OE/+ mice. A, Toe pinch assay showing the percentage of mice that show a response to a pinch of toes 3, 4, and 5 at different times after sciatic nerve crush in WT and c-Jun OE/+ mice. In c-Jun OE/+ mice, all toes show a trend toward a delayed response. B, The average time in days after crush at which the first toe pinch response is seen in toes 3, 4, and 5. WT, n = 10; OE/+, n = 9. Mann–Whitney U test: p-values are calculated relative to WT for each toe. Toe 3, p = 0.0056; toe 4, p = 0.0043; toe 5, p = 0.0404. C, The toe spread reflex in WT (n = 10) and OE/+ (n = 9) mice after sciatic nerve crush. The reflex response is delayed at days 12, 14, and 15 in c-Jun OE/+ mice. Two-way ANOVA with Bonferroni's comparison: p = 0.0171. D, Representative digital footprints from WT and c-Jun OE/+ mice taken at 0, 7, 18, 21, 28, and 70 d after sciatic nerve crush used in sciatic functional index (SFI) analysis. E, SFI results from WT (n = 11) and c-Jun OE/+ (n = 8) mice at different times after sciatic nerve crush. There is no significant difference between WT and c-Jun OE/+ mice. Two-way ANOVA with Bonferroni's comparison: p = 0.5545.

Comment in

Similar articles

Cited by

References

    1. Ameyar-Zazoua M, Wisniewska MB, Bakiri L, Wagner EF, Yaniv M, Weitzman JB (2005) AP-1 dimers regulate transcription of the p14/p19ARF tumor suppressor gene. Oncogene 24:2298–2306. 10.1038/sj.onc.1208424 - DOI - PubMed
    1. Arthur-Farraj P, Wanek K, Hantke J, Davis CM, Jayakar A, Parkinson DB, Mirsky R, Jessen KR (2011) Mouse Schwann cells need both NRG1 and cyclic AMP to myelinate. Glia 59:720–733. 10.1002/glia.21144 - DOI - PMC - PubMed
    1. Arthur-Farraj PJ, Latouche M, Wilton DK, Quintes S, Chabrol E, Banerjee A, Woodhoo A, Jenkins B, Rahman M, Turmaine M, Wicher GK, Mitter R, Greensmith L, Behrens A, Raivich G, Mirsky R, Jessen KR (2012) c-Jun reprograms Schwann cells of injured nerves to generate a repair cell essential for regeneration. Neuron 75:633–647. 10.1016/j.neuron.2012.06.021 - DOI - PMC - PubMed
    1. Arthur-Farraj PJ, Morgan CC, Adamowicz M, Gomez-Sanchez JA, Fazal SV, Beucher A, Razzaghi B, Rhona Mirsky R, Jessen KR, Aitman TJ (2017) Changes in the coding and non-coding transcriptome and DNA methylome that define the Schwann cell repair phenotype after nerve injury. Cell Rep 20:2719–2734. 10.1016/j.celrep.2017.08.064 - DOI - PMC - PubMed
    1. Chen S, Rio C, Ji RR, Dikkes P, Coggeshall RE, Woolf CJ, Corfas G (2003) Disruption of ErbB receptor signaling in adult non-myelinating Schwann cells causes progressive sensory loss. Nat Neurosci 6:1186–1193. 10.1038/nn1139 - DOI - PubMed

Publication types

MeSH terms