. 2017 Nov 21;114(47):12596-12601.
doi: 10.1073/pnas.1712887114. Epub 2017 Nov 6.

Host-based lipid inflammation drives pathogenesis in Francisella infection

Affiliations

Host-based lipid inflammation drives pathogenesis in Francisella infection

Alison J Scott et al. Proc Natl Acad Sci U S A. .

Abstract

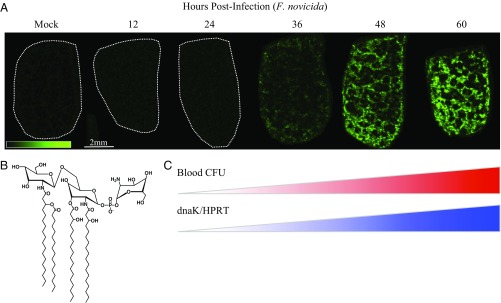
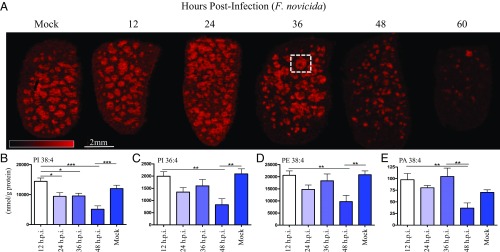
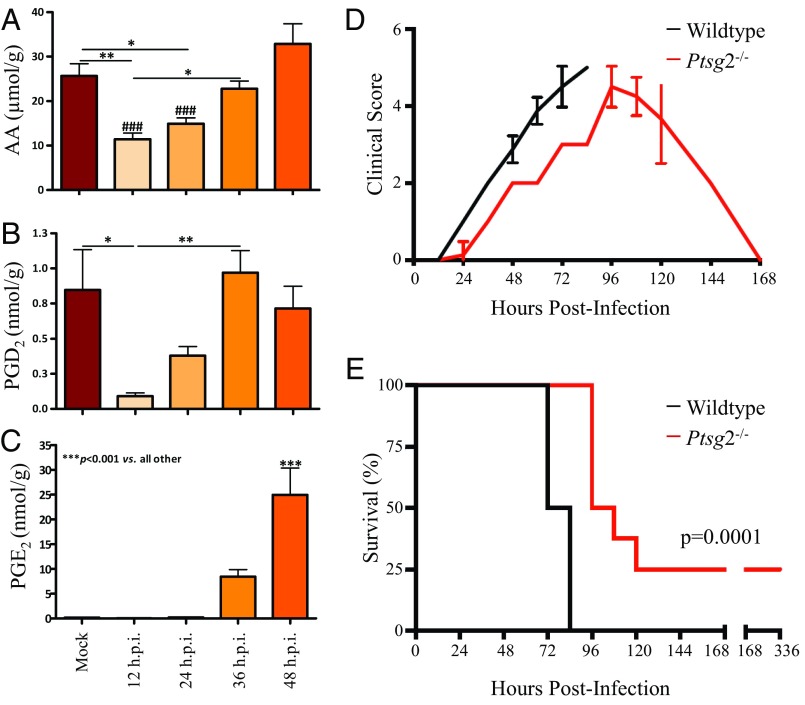
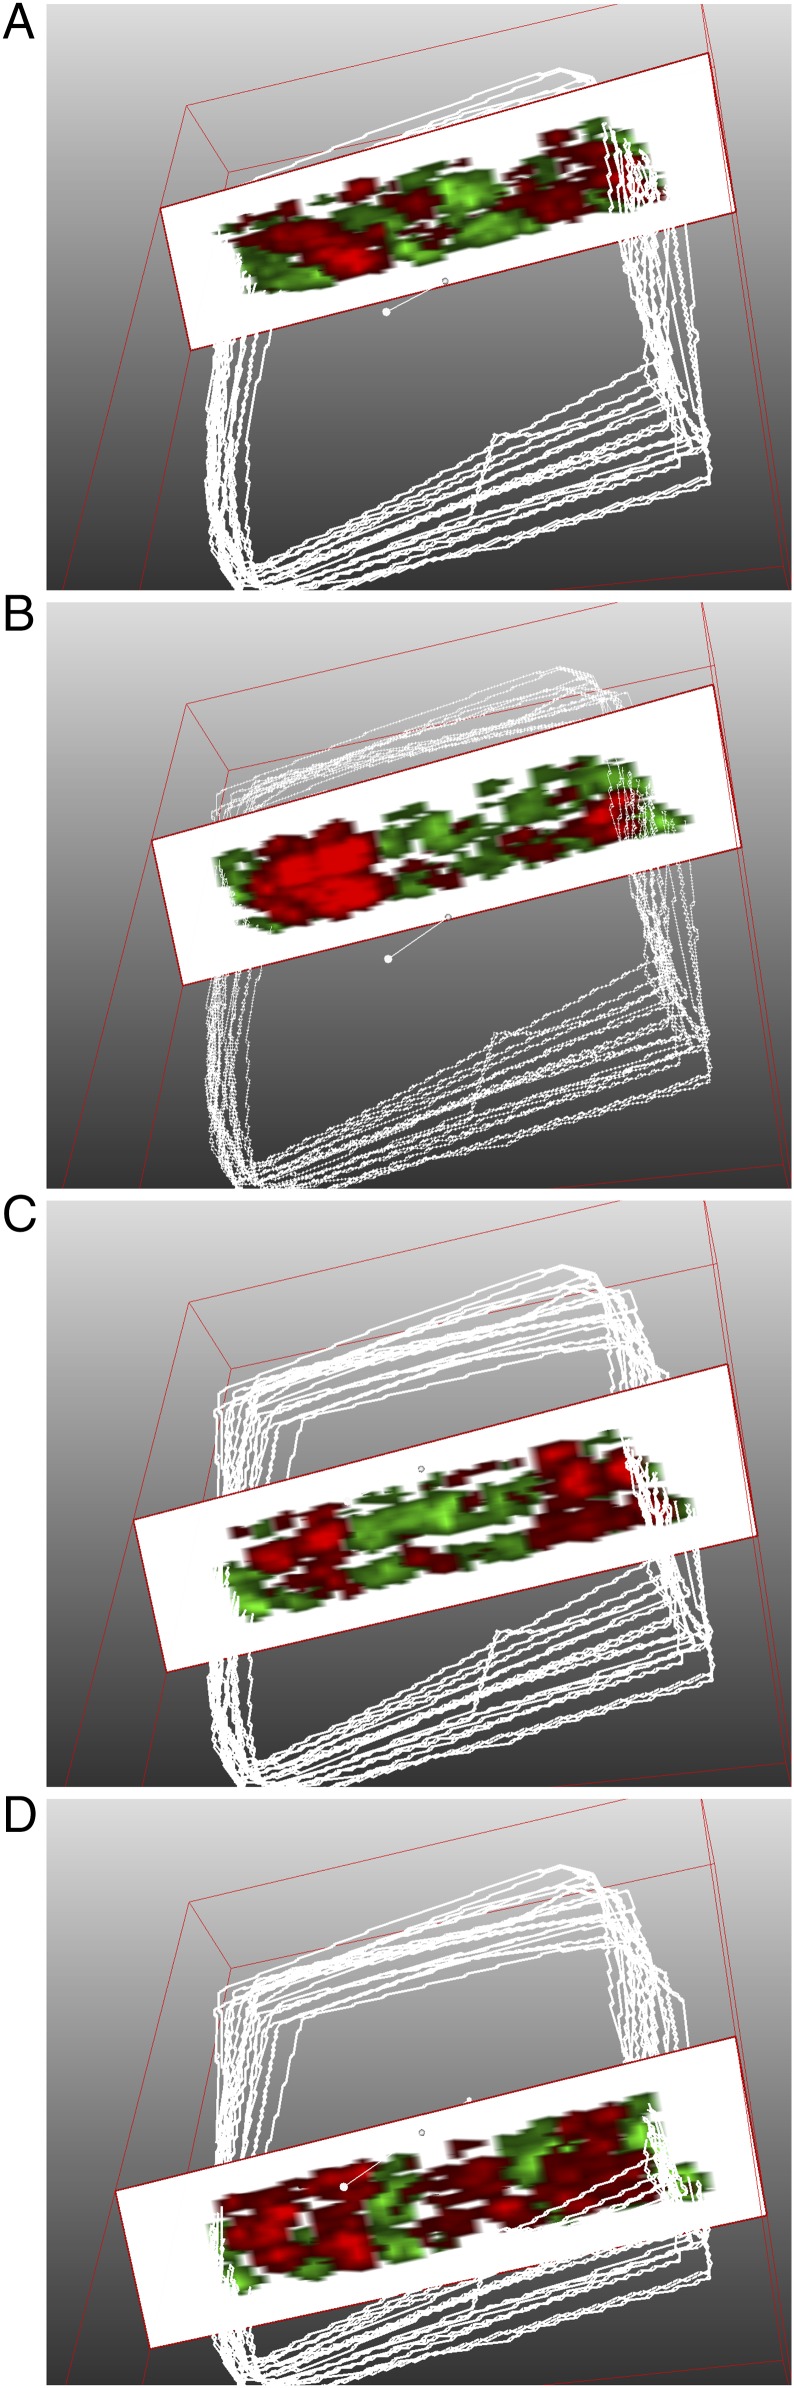
Mass spectrometry imaging (MSI) was used to elucidate host lipids involved in the inflammatory signaling pathway generated at the host-pathogen interface during a septic bacterial infection. Using Francisella novicida as a model organism, a bacterial lipid virulence factor (endotoxin) was imaged and identified along with host phospholipids involved in the splenic response in murine tissues. Here, we demonstrate detection and distribution of endotoxin in a lethal murine F. novicida infection model, in addition to determining the temporally and spatially resolved innate lipid inflammatory response in both 2D and 3D renderings using MSI. Further, we show that the cyclooxygenase-2-dependent lipid inflammatory pathway is responsible for lethality in F. novicida infection due to overproduction of proinflammatory effectors including prostaglandin E2. The results of this study emphasize that spatial determination of the host lipid components of the immune response is crucial to identifying novel strategies to effectively address highly pathogenic and lethal infections stemming from bacterial, fungal, and viral origins.

Keywords: cyclooxygenase pathway; host–pathogen interaction; lipid inflammation; mass spectrometry imaging; microbial pathogenesis.


Conflict of interest statement

The authors declare no conflict of interest.

Figures

Fig. 1.
Fig. 1.
Endotoxin mapping in splenic red pulp by mass spectrometry imaging (MSI) corresponds to septic transition in mouse infection with F. novicida. (A) Ion image of F. novicida lipid A in bisected mouse spleen sections, 10-μm thickness, bisection face oriented up, 75-μm spatial resolution by matrix-assisted laser desorption/ionization-time of flight (MALDI-TOF). False color ion intensity is given in green color scale, 0–45 arbitrary units (a.u.) normalized, total ion current (TIC). Dotted white outlines are given for negative tissues. Data are representative of three parallel replicates. (B) Predominant structure of F. novicida lipid A given as the negative ion [M-H] observed at m/z 1,665, supported by fragmentation (SI Appendix, Table S1). (C) Red heatbar: bacterial dissemination (F. novicida) to blood following subcutaneous infection (derived from SI Appendix, Fig. S3A), colony forming units (CFU) per milliliter (mL) cardiac blood, postmortem, n = 3 per time point. Blue heatbar: confirmation of bacterial transcript in the opposite halves of bisected spleens from A, qRT-PCR. F. novicida dnaK transcript is normalized to murine Hprt. n = 3 per time point (derived from SI Appendix, Fig. S3B).
Fig. 2.
Fig. 2.
Arachidonic acid (AA)-containing phospholipids of the splenic white pulp are depleted during F. novicida infection. (A) Image of m/z 885.6 ion channel identified at 1-stearoyl, 2-arachidonyl-phosphatidylinositol (SAPI), [M-H], 75-μm spatial resolution, MALDI-TOF. Serial sections of spleens are as in Fig. 1A. False color ion intensity is given in red color scale, 0–325 a.u., normalized (TIC). White box outlines white pulp nodule with an active germinal center (identified in black box, SI Appendix, Fig. S1). (BE) Quantitative LC/MS of parent phospholipid containing arachidonyl group normalized to total input splenic protein content (in grams) evaluated every 12 hours postinfection (h.p.i.), lethal dose F. novicida, SQ. (B) SAPI, m/z 885.6. (C) Palmitoyl, arachidonyl phosphatidylinositol (PI) 16:0/20:4 (PI 36:4), m/z 857.6. (D) Stearoyl, arachidonyl phosphatidylethanolamine (PE) 18:0/20:4 (PE 38:4), m/z 766.5. (E) Stearoyl, arachidonyl phosphatidic acid (PA) 18:0/20:4 (PA 38:4), m/z 723.5. Lipid levels were analyzed using one-way ANOVA for injection time points, *P < 0.05, **P < 0.01, ***P < 0.001 (n = 10). Error bars denote SEM.
Fig. 3.
Fig. 3.
Cyclooxygenase (COX)-2 inflammatory pathway contributes to rapid lethality in F. novicida infection. (AC) Quantitative LC/MS of substrate and metabolites of COX-2 enzyme normalized to total input splenic protein content (in grams) evaluated every 12 h.p.i., lethal dose F. novicida, SQ. (A) Free AA. (B) Prostaglandin D2 (PGD2). (C) Prostaglandin E2 (PGE2). Lipid levels were analyzed using one-way ANOVA for injection time points, *P < 0.05, **P < 0.01, ***P < 0.001 as given by bars, ###P < 0.001 versus 48 h.p.i. (n = 10). Error bars denote SEM. (D and E) Infection in wild-type versus COX-2 knockout (Ptgs2−/−) mice (n = 8) with F. novicida, SQ. (D) Clinical scores evaluated every 12 h.p.i. using a 5-point scale (SI Appendix, SI Methods). (E) Survival percentages, survival of COX-2 knockout mice evaluated using log-rank test, *P = 0.0001. Representative of two replicate survival studies, both significant at P < 0.05.
Fig. 4.
Fig. 4.
Three-dimensional molecular reconstruction of the host–pathogen lipid profile visualizes the lethal septic interface. (AD) Slice cutaway views of 3D volume reconstruction from two-channel image. MALDI-TOF, 20 μm xy spatial resolution, 12-μm section thickness, negative ion mode, formalin-fixed tissue (center third of F. novicida-infected spleen, 48 h.p.i.) prepared for endotoxin and host lipid simultaneous coimaging. White outlines are the tissue margins from MSI setup and define the outer scan area, not necessarily the tissue perimeter. Green: m/z 1,665, identified as lipid A (Fig. 1 and SI Appendix, Fig. S4). Red: m/z 885.6, identified as SAPI (Fig. 2 and SI Appendix, Fig. S6). Intensities are optimized for 3D view and for fidelity to 2D images (Movie S1).

References

    1. Raetz CRH. Biochemistry of endotoxins. Annu Rev Biochem. 1990;59:129–170. - PubMed
    1. Raetz CRH, Whitfield C. Lipopolysaccharide endotoxins. Annu Rev Biochem. 2002;71:635–700. - PMC - PubMed
    1. Poltorak A, et al. Defective LPS signaling in C3H/HeJ and C57BL/10ScCr mice: Mutations in Tlr4 gene. Science. 1998;282:2085–2088. - PubMed
    1. Beutler B, Rietschel ET. Innate immune sensing and its roots: The story of endotoxin. Nat Rev Immunol. 2003;3:169–176. - PubMed
    1. Trent MS, Stead CM, Tran AX, Hankins JV. Diversity of endotoxin and its impact on pathogenesis. J Endotoxin Res. 2006;12:205–223. - PubMed

Publication types

MeSH terms