. 2017 Nov 6;8(1):1334.
doi: 10.1038/s41467-017-01455-x.

Holocene sea ice variability driven by wind and polynya efficiency in the Ross Sea

Affiliations

Holocene sea ice variability driven by wind and polynya efficiency in the Ross Sea

K Mezgec et al. Nat Commun. .

Abstract

The causes of the recent increase in Antarctic sea ice extent, characterised by large regional contrasts and decadal variations, remain unclear. In the Ross Sea, where such a sea ice increase is reported, 50% of the sea ice is produced within wind-sustained latent-heat polynyas. Combining information from marine diatom records and sea salt sodium and water isotope ice core records, we here document contrasting patterns in sea ice variations between coastal and open sea areas in Western Ross Sea over the current interglacial period. Since about 3600 years before present, an increase in the efficiency of regional latent-heat polynyas resulted in more coastal sea ice, while sea ice extent decreased overall. These past changes coincide with remarkable optima or minima in the abundances of penguins, silverfish and seal remains, confirming the high sensitivity of marine ecosystems to environmental and especially coastal sea ice conditions.


Conflict of interest statement

The authors declare no competing financial interests.

Figures

Fig. 1
Fig. 1
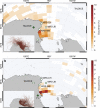
Location of the studied marine and ice core sites in the WRS area. The TALDICE and Taylor Dome (TY) ice cores and the Joides Basin (WRS_JB), Cape Hallett (WRS_CH) and Wood Bay (WRS_WB) sediment cores are indicated in the map. The Ross Sea and Terra Nova Bay (TNB) latent-heat polynyas (from cyan to blue, % of open water from May to November) and present day landfast ice extension area (brown) are schematically represented. The inset shows a map of Antarctica with the location of the other marine cores cited in the text and retrieved in the Adélie Land (AL) and Prydz Bay (PB). East Antarctica ice sheet (EAIS), West Antarctica ice sheet (WAIS) and the maximum Antarctic winter sea ice extent is depicted
Fig. 2
Fig. 2
Holocene diatom records. a Diatom relative abundances of Fragilariopsis curta (dark blue line) and the F. curta + F. cylindrus gp (light blue line), Thalassiosira antarctica resting spores (brown line) and Chaetoceros Hyalochaete resting spores (purple line) in core WRS_WB (BAY05-43c) from Wood Bay. b Similar to a but in core WRS_CH (BAY05-20c) from Cape Hallett. c Similar to a but in core WRS_JB (ANTA99-cJ5) from Joides Basin, with the addition of F. kerguelensis relative abundances (red line). Stars represent the calibrated 14C ages for each marine core
Fig. 3
Fig. 3
Holocene ice core records. a sea salt sodium concentration in part per billion (dark brown line), deuterium excess in ‰ vs. V-SMOW (orange line) and δ18O in ‰ vs. V-SMOW (dark red line) in Taylor Dome ice core. b sea salt sodium concentration in part per billion (brown line), deuterium excess in ‰ vs. V-SMOW (yellow line) and δ18O in ‰ vs. V-SMOW (red line) in TALDICE ice core. All ice core records were resampled on a 50-year time step
Fig. 4
Fig. 4
Sea salt aerosol source regions and paths from sea ice area toward ice core using model air mass trajectories. a, b occurrence (%) of loading condition for selected back trajectories. Back trajectories can be considered loaded above the sea ice if they flow above an area with sea ice values between 15 and 75% and wind speed >3 m s−1. The occurrence of events is spatially cumulated for a regular grid of 5°×1° of longitude and latitude (the number of occurrences for each site is in percentage in respect to the total number of occurrences for the entire domain. The entire domain is defined as: 80°S<latitude<50°S; 0°<longitude<180°E−180°W. a, b Insets: 3 days back trajectories ending at 1000 m over TALDICE (a inset) and TY (b inset) and spending more than 10% of their path over the sea and <40% over the continent (red lines). Only trajectories related to March, April, May, June, July, August, September, October and November for the period 1979–2012 are considered. Among the selected trajectories, only those with a permanence of at least three consecutive hours over sea ice concentration>15% are considered. The green open diamond represents the location of TALDICE (a) and TY (b), whereas open circles indicate the location of the three marine cores (Cape Hallett WRS_CH; Wood Bay WRS_WB and Joides Basin WRS_JB) and the other ice core
Fig. 5
Fig. 5
Empirical orthogonal function analysis of ice and marine records. Least square empirical orthogonal function analysis applied to a covariance matrix based on standardized values of δ18O (filled square), deuterium excess (d-excess, filled rectangle) and sea salt sodium (ssNa, filled triangle), obtained from TALDICE and Taylor Dome (TY) ice core data, and, F. curta (filled star) obtained from Cape Hallett (WRS_CH), Joides Basin (WRS_JB) and Wood Bay (WRS_WB) marine core data. The colour code shows the strength of the component values of EOF1 and EOF2 (a and b, respectively) for each proxy data used in the calculation. The numbers in brackets represent the percentages of variance explained by EOF1 and EOF2 (43% and 28% of the total variance, respectively)
Fig. 6
Fig. 6
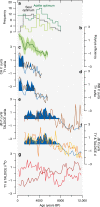
Holocene WRS sea ice variability in the CSIZ and OSIZ along with polynya efficiency and faunal remains. a Frequency of 14C-dated faunal remains: Adélie penguins (dark green line), Antarctic silverfish (light green line) and elephant seals (black dashed line). b Polynya efficiency, with standard deviation values, obtained from a stacked record of CSIZ F. curta and TY ssNa records. c Fragilariopsis curta relative abundances in WRS_CH (blue line), with blue shading representing heavier CSIZ conditions, compared to TY ssNa (dark brown line) as a coastal sea ice proxy. The correlation coefficient (r) between the two records is 0.67. d Similar to c but for WRS_WB with r equal to 0.71. e F. curta relative abundances in WRS_JB (blue line), with blue shading representing heavier, more extended OSIZ conditions, compared with TALDICE ssNa (light brown line) as a proxy for pack ice extent; r is 0.49. f F. curta relative abundances in WRS_JB (blue line and blue shading) compared with TY (orange line) and TALDICE (yellow line) deuterium excess (d) records as proxies of evaporative conditions at moisture source regions and related to pack ice extent; r between JB and TY is 0.57 while r between JB and TALDICE is 0.77. g TY (dark red line) and TALDICE (light red line) δ18O records as proxies of local site temperature variability. All data were resampled on a 200-yr time step and standardized for the considered periods
Fig. 7
Fig. 7
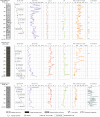
Marine core lithology and chronology. From top to bottom: description of cores WRS_CH, WRS_WB and WRS_JB showing from left to right, lithology, ages of radiocarbon-dated levels and sedimentation rates, magnetic susceptibility (MS), organic C content (Corg %), organic C/total N molar ratio (C/N), absolute diatom abundance (ADA) expressed in number of valves per gram of dry weight (v/gdw), and percentage of reworked diatoms (% rew diatoms). The ADA has been calculated excluding the Chaetoceros resting spore (CRS)

References

    1. Thomas, D. N. & Dieckmann, G. S. Sea Ice: an Introduction to its Physics, Chemistry, Biology and Geology (Blackwell Science Ltd, Oxford, 2003).
    1. Parkinson CL, Cavalieri DJ. Antarctic sea ice variability and trends, 1979–2010. Cryosphere. 2012;6:871–880. doi: 10.5194/tc-6-871-2012. - DOI
    1. de la Mare WK. Changes in Antarctic sea ice extent from direct historical observations and whaling records. Clim. Change. 2009;92:461–493. doi: 10.1007/s10584-008-9473-2. - DOI
    1. IPCC Climate ChangeThe Physical Science Basis. Contribution of Working Group I to the Fifth Assessment Report of the Intergovernmental Panel on Climate Change (eds Stocker, T. F., et al.) (Cambridge University Press, Cambridge, 2013).
    1. Polvani LM, Smith KL. Can natural variability explain observed sea ice trends? New modeling evidence from CMIP5. Geophys. Res. Lett. 2013;40:3195–3199. doi: 10.1002/grl.50578. - DOI

Publication types

LinkOut - more resources