. 2017 Nov 6;8(1):1327.
doi: 10.1038/s41467-017-01084-4.

Electricity generation from digitally printed cyanobacteria

Affiliations

Electricity generation from digitally printed cyanobacteria

Marin Sawa et al. Nat Commun. .

Abstract

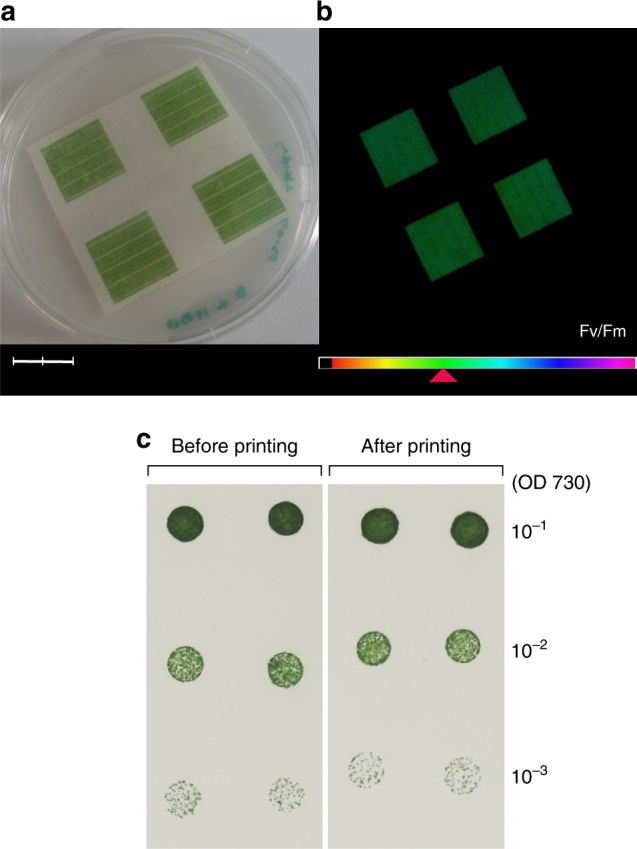
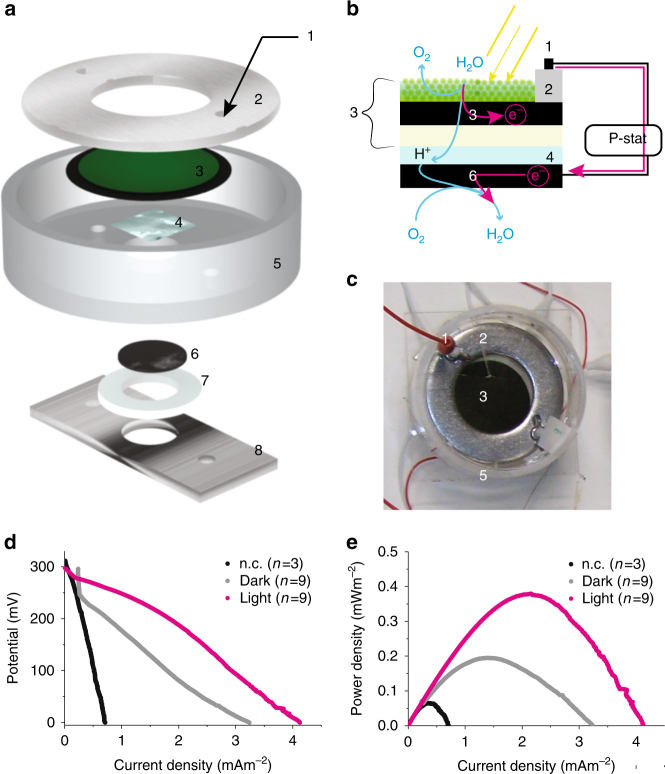
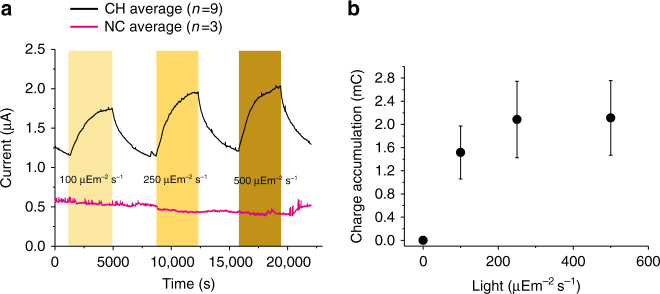
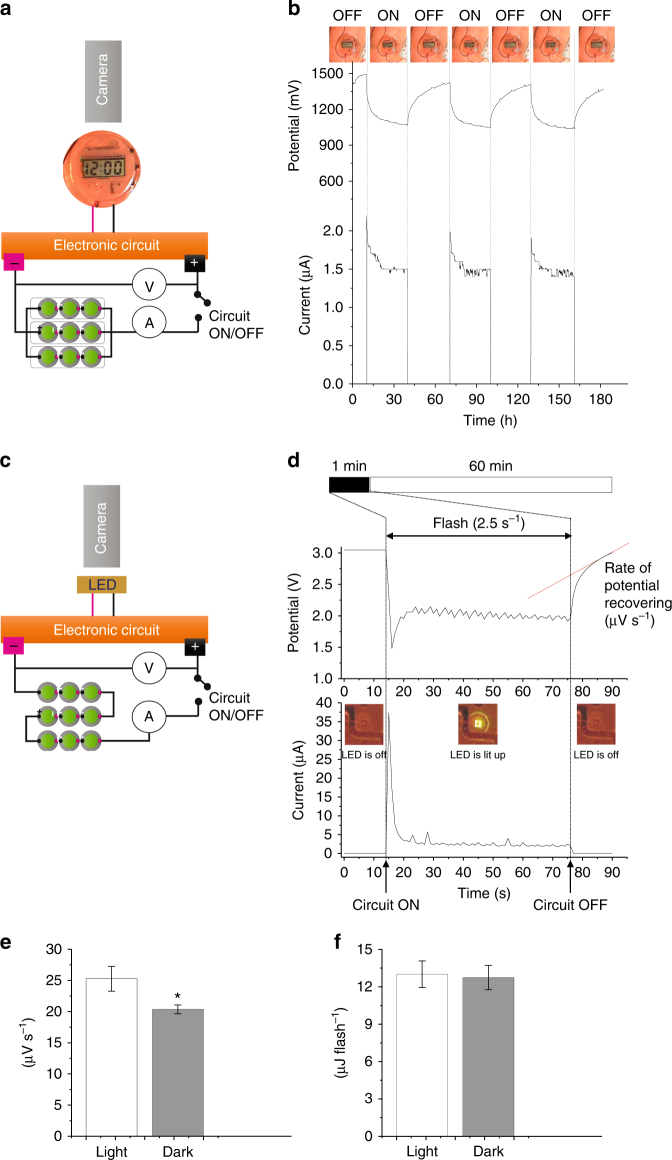
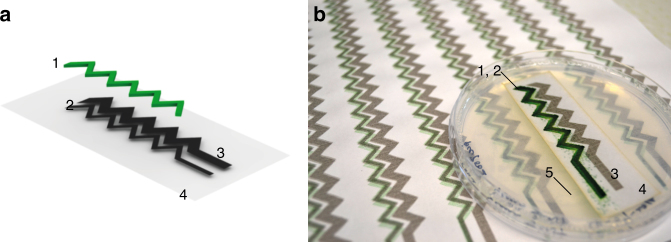
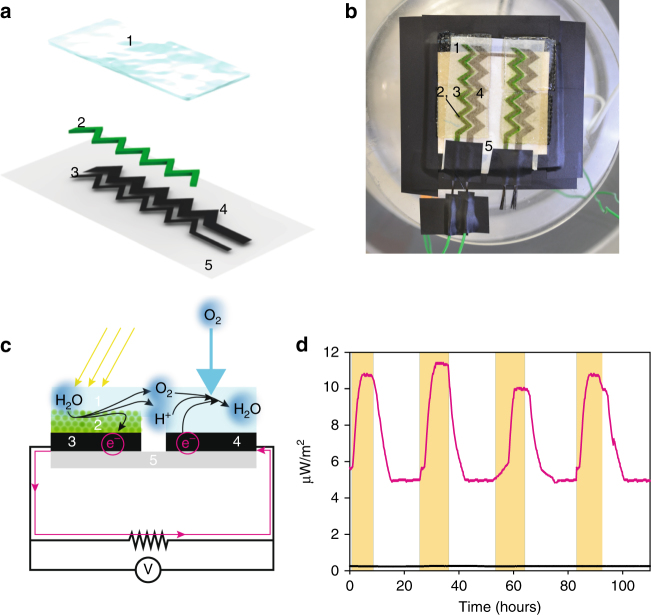
Microbial biophotovoltaic cells exploit the ability of cyanobacteria and microalgae to convert light energy into electrical current using water as the source of electrons. Such bioelectrochemical systems have a clear advantage over more conventional microbial fuel cells which require the input of organic carbon for microbial growth. However, innovative approaches are needed to address scale-up issues associated with the fabrication of the inorganic (electrodes) and biological (microbe) parts of the biophotovoltaic device. Here we demonstrate the feasibility of using a simple commercial inkjet printer to fabricate a thin-film paper-based biophotovoltaic cell consisting of a layer of cyanobacterial cells on top of a carbon nanotube conducting surface. We show that these printed cyanobacteria are capable of generating a sustained electrical current both in the dark (as a 'solar bio-battery') and in response to light (as a 'bio-solar-panel') with potential applications in low-power devices.


Conflict of interest statement

The authors declare no competing financial interests.

Figures

Fig. 1
Fig. 1
Cell viability and photosynthetic capabilities of digitally printed cyanobacteria. a Photograph of inkjet-printed Synechocystis cells after 3 days of incubation. Scale bar measures 2 cm. b Chlorophyll fluorescence image of the sample a by imaging PAM, showing maximum quantum efficiency of PSII (Fv/Fm) at the values of about 0.4 according to colour gradient in the legend bar. c The panel compares the growth of Synechocystis colonies before and after the inkjet printing process, following 5 days of incubation on a BG-11 agar plate. A 3 µl aliquot of cells from a dilution series representing 10−1, 10−2 and 10−3 of the original suspension was spotted. For the most dilute cell suspension taken after printing, 90.5 ± 10.6 colonies were counted, whereas 87.5 ± 12.0 colonies were counted before printing. The difference between these values was found to be not statistically significant (one-way ANOVA: p = 0.815) (Supplementary Table 1)
Fig. 2
Fig. 2
Electrochemical characterisation of a digitally printed bioanode in a hybrid BPV system. a Schematic representation (semi-exploded view) of the BPV unit with printed paper-based anode. Clamping screws (component 1); marine grade stainless steel ring for contacting the CNT anode (component 2); printed CNT anode in black (Ø 60 mm) with printed photosynthetic organisms in green (Ø 40 mm) with a total area of ~ 28.4 cm2 (component 3); hydrogel (component 4); Plexiglas vessel (component 5); carbon paper-Pt, with a total area of ~ 3.5 cm2 was used as cathode (component 6); silicon O-ring (component 7); stainless steel plate used to clamp all the component together (component 8). ~ 60 ml of BG-11 medium was placed above the printed cells in the chamber formed by the top plate. b Schematic representation of the BPV unit cross-section where electrons, protons and oxygen flow are also shown. Numbering as in a. c Photograph of the experimental setup (excluding the potentiostat and the wiring). Numbering as in a. d Polarization and e power curves for the printed anode in the BPV unit. Printed Synechocystis (incubated for 5 days after printing) on printed CNT anode exposed to light (magenta symbols) and in the dark (grey symbol) was compared with a bare printed anode (black trace). Number of repeats is indicated in parenthesis
Fig. 3
Fig. 3
Effect of light intensity on anodic photocurrent produced by the hybrid BPV system. a Current output measured over 6 h with three periods of light and darkness (1 h each). Light periods indicated by the yellow bars. Black trace for inkjet-printed Synechocystis on printed CNT anode and magenta trace for control experiments without the printed cells. Number of repeats is indicated in parenthesis. b Saturation curve for the current outputs as presented in the a. For each period of light (100, 250 and 500 µE m−2 s−1), the current was integrated over time. The charge attributable to dark current over the same time was subtracted from the total charge during the light periods and plotted vs. the photon flux. Each data point is the result of 9 replicates and the standard error is shown as error bars
Fig. 4
Fig. 4
Powering a clock and a LED-flash with an array of Hybrid BPV units. a Schematic representation of the experimental setup for the powering of a digital clock. An array consisting of 9 Hybrid BPV cells were organised in 3 clusters connected in parallel. Each cluster had 3 units connected in series. b Chronovoltammetric and chronoamperometric traces recorded during the experiment where the circuit (i.e., the digital clock) was either on (i.e., clock activated) or off (i.e., clock deactivated) for periods of approximately 30 min. c Schematic representation of the experimental setup for the powering of a LED. The array was organised all in series. d Chronovoltammetric and chronoamperometric traces recorded during the experiment where the circuit with its integrated LED was either on (i.e., pulsing every 2.5 s to activate the LED) for periods of approximately 60 s or off (i.e., LED deactivated) for periods of approximately 1 h. Rate of voltage recovery was estimated by fitting the last 7 s of data with a linear regression line (in red); e kinetics of recovering to the original voltage following LED pulse when the BPV array was kept in the dark and when it was exposed to light; f average energy consumed for each LED pulse
Fig. 5
Fig. 5
Design of a fully printed BPV system. a Schematic representation (semi-exploded view) of the digitally printed bioelectrode module. 1: Printed photosynthetic organisms in green; 2: Printed CNT anode; 3: Printed CNT cathode; 4: Paper substrate. The one module consists of one zigzag anode and one zigzag cathode with surface areas 1.36 cm2 and 2.73 cm2, respectively. b Photograph of A4-size arrays with freshly printed Synechococcus cells, compared to the incubated module grown on an agar plate for 3 days. (Note the enhanced green colour of the growing cyanobacteria.) 1–4 are the same as a and 5 is the solid medium
Fig. 6
Fig. 6
Testing the performance of the fully printed BPV device. a Schematic representation (semi-exploded view) of the printed paper-based BPV cell. Paper support in light grey (component 5); Printed CNT anode (component 3) and CNT cathode (component 4) in black; Printed Synechocystis in green (component 2); Bridging hydrogel in pale blue (component 1). b Photograph of the experimental setup (excluding the potentiostat), showing a pair of BPV modules printed in series. c Schematic representation of the BPV cross-section where electron, proton and oxygen flows are also shown. d Power output measured over 4 days with periods of light and darkness. Light periods indicated by the yellow bars. Magenta trace for inkjet-printed Synechocystis on printed CNT anode and black trace for control experiments without the cells

References

    1. Ren H, Lee H-S, Chae J. Miniaturizing microbial fuel cells for potential portable power sources: promises and challenges. Microfluid. Nanofluidics. 2012;13:353–381. doi: 10.1007/s10404-012-0986-7. - DOI
    1. Irimia-Vladu M. ‘Green’ electronics: biodegradable and biocompatible materials and devices for sustainable future. Chem. Soc. Rev. 2014;43:588–610. doi: 10.1039/C3CS60235D. - DOI - PubMed
    1. Choi S. Microscale microbial fuel cells: advances and challenges. Biosens. Bioelectron. 2015;69:8–25. doi: 10.1016/j.bios.2015.02.021. - DOI - PubMed
    1. Logan BE, Rabaey K. Microbial conversion of wastes into bioelectricity and chemicals by using microbial electrochemical technologies. Science. 2012;337:686–690. doi: 10.1126/science.1217412. - DOI - PubMed
    1. Logan BE, et al. Assessment of microbial fuel cell configurations and power densities. Environ. Sci. Technol. Lett. 2015;2:206–214. doi: 10.1021/acs.estlett.5b00180. - DOI

Publication types

Substances