. 2017 Nov 6;7(1):14567.
doi: 10.1038/s41598-017-15231-w.

Chemical Similarity Enrichment Analysis (ChemRICH) as alternative to biochemical pathway mapping for metabolomic datasets

Affiliations

Chemical Similarity Enrichment Analysis (ChemRICH) as alternative to biochemical pathway mapping for metabolomic datasets

Dinesh Kumar Barupal et al. Sci Rep. .

Abstract

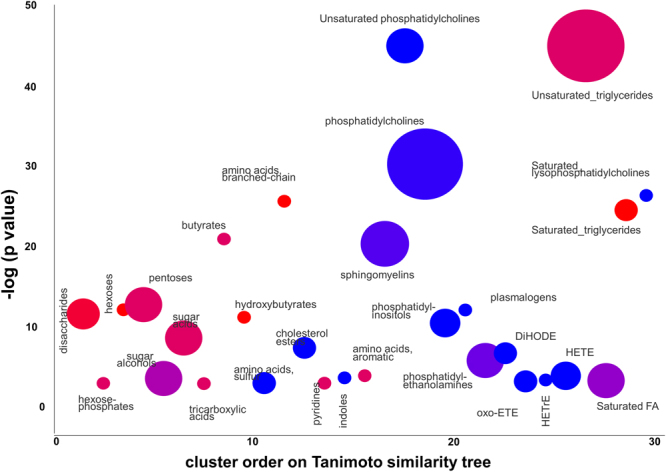
Metabolomics answers a fundamental question in biology: How does metabolism respond to genetic, environmental or phenotypic perturbations? Combining several metabolomics assays can yield datasets for more than 800 structurally identified metabolites. However, biological interpretations of metabolic regulation in these datasets are hindered by inherent limits of pathway enrichment statistics. We have developed ChemRICH, a statistical enrichment approach that is based on chemical similarity rather than sparse biochemical knowledge annotations. ChemRICH utilizes structure similarity and chemical ontologies to map all known metabolites and name metabolic modules. Unlike pathway mapping, this strategy yields study-specific, non-overlapping sets of all identified metabolites. Subsequent enrichment statistics is superior to pathway enrichments because ChemRICH sets have a self-contained size where p-values do not rely on the size of a background database. We demonstrate ChemRICH's efficiency on a public metabolomics data set discerning the development of type 1 diabetes in a non-obese diabetic mouse model. ChemRICH is available at www.chemrich.fiehnlab.ucdavis.edu.


Conflict of interest statement

The authors declare that they have no competing interests.

Figures

Figure 1
Figure 1
Metabolic dysregulations and its mapping against pathway and ontology databases. Left: Volcano plot showing the metabolic dys-regulation in NOD diabetic mice, detailing which of the most significantly altered metabolites were not mapped to metabolic pathways. Right: overlap of all detected metabolites in pathway and chemical ontology databases.
Figure 2
Figure 2
Static and dynamic component of ChemRICH approach. The left panel shows the steps to generate the ChemRICH database using MeSH and PubChem databases and the rCDK package in R. The right panels show the steps in ChemRICH enrichment analysis. It includes finding non-overlapping chemical sets for a list of metabolites from a metabolomics study and then calculating the set level significance using the KS test. Abbreviations: MeSH - Medical Subject Headings, CID - PubChem compound identifiers, SMILES - Simplified molecular-input line-entry system, FA - Fatty acids, NC - New clusters, HC – Hierarchical clustering, STR – string search, CDK - Chemistry Development Kit, KS Test- Kolmogorov–Smirnov test.
Figure 3
Figure 3
Flowchart of steps in the ChemRICH approach. Number in parentheses are for the test study. Abbreviations: FA – fatty acids, HCL – hierarchical clustering, TM – Tanimoto.
Figure 4
Figure 4
Tanimoto chemical similarity mapping of all identified metabolites in the non-obese diabetic mouse dataset. Clusters are defined by comparing within- versus between group similarities, forming a clustered chemical similarity tree. Dark black lines indicate boundaries of clusters that are significantly different in diabetic versus non-diabetic NOD mice (p < 0.05). Cluster letter labels are detailed in Supplement Table S1. Increased metabolites levels in diabetic mice are labeled as red nodes, decreased levels are marked in blue.
Figure 5
Figure 5
ChemRICH set enrichment statistics plot. Each node reflects a significantly altered cluster of metabolites. Enrichment p-values are given by the Kolmogorov–Smirnov-test. Node sizes represent the total number of metabolites in each cluster set. The node color scale shows the proportion of increased (red) or decreased (blue) compounds in diabetic NOD mice compared to control mice. Purple-color nodes have both increased and decreased metabolites.

References

    1. Showalter MR, Cajka T, Fiehn O. Epimetabolites: discovering metabolism beyond building and burning. Curr Opin Chem Biol. 2017;36:70–76. doi: 10.1016/j.cbpa.2017.01.012. - DOI - PMC - PubMed
    1. Khersonsky O, Tawfik DS. Enzyme promiscuity: a mechanistic and evolutionary perspective. Annu Rev Biochem. 2010;79:471–505. doi: 10.1146/annurev-biochem-030409-143718. - DOI - PubMed
    1. Fiehn O, Barupal DK, Kind T. Extending biochemical databases by metabolomic surveys. The Journal of biological chemistry. 2011;286:23637–23643. doi: 10.1074/jbc.R110.173617. - DOI - PMC - PubMed
    1. Lerma-Ortiz C, et al. ‘Nothing of chemistry disappears in biology’: the Top 30 damage-prone endogenous metabolites. Biochem Soc Trans. 2016;44:961–971. doi: 10.1042/BST20160073. - DOI - PubMed
    1. Wang H, et al. The metabolic function of cyclin D3-CDK6 kinase in cancer cell survival. Nature. 2017;546:426–430. doi: 10.1038/nature22797. - DOI - PMC - PubMed

Publication types

LinkOut - more resources