. 2017 Nov 6;8(1):1326.
doi: 10.1038/s41467-017-01343-4.

Mapping and phasing of structural variation in patient genomes using nanopore sequencing

Affiliations

Mapping and phasing of structural variation in patient genomes using nanopore sequencing

Mircea Cretu Stancu et al. Nat Commun. .

Abstract

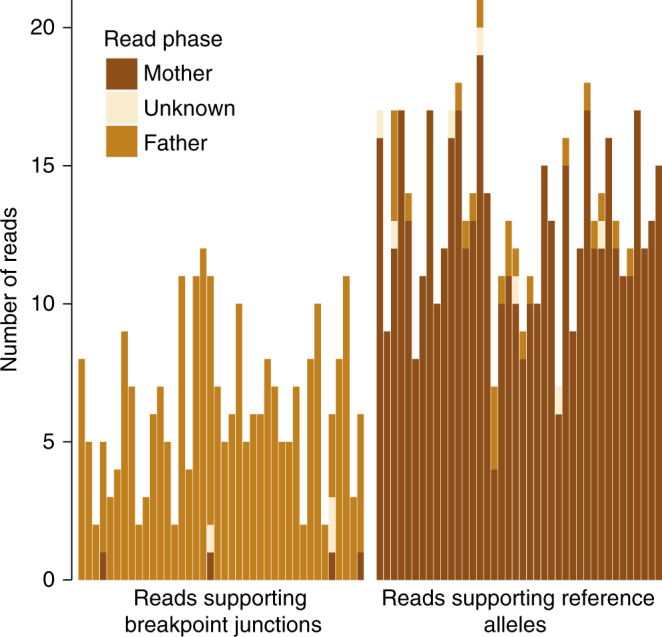
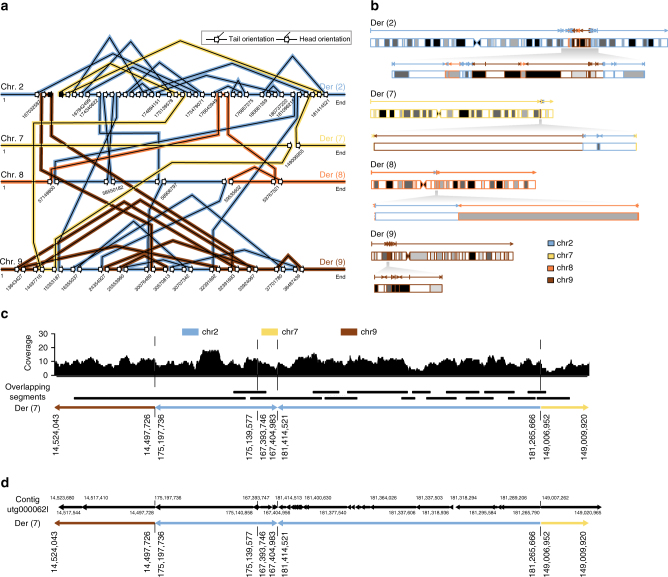
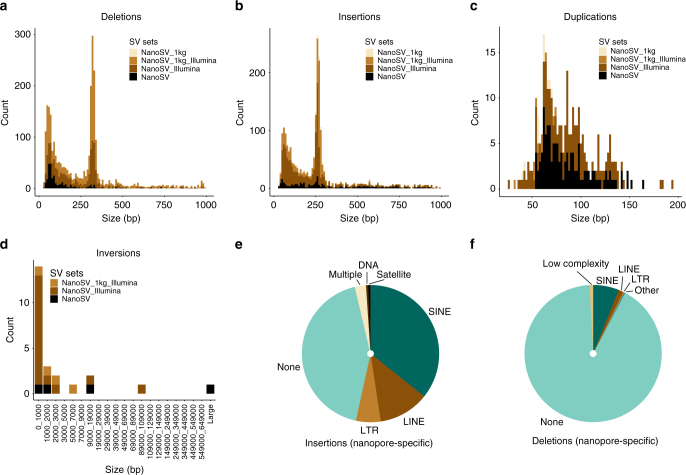
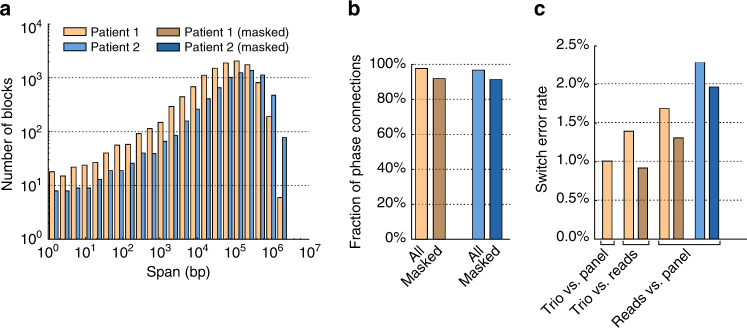
Despite improvements in genomics technology, the detection of structural variants (SVs) from short-read sequencing still poses challenges, particularly for complex variation. Here we analyse the genomes of two patients with congenital abnormalities using the MinION nanopore sequencer and a novel computational pipeline-NanoSV. We demonstrate that nanopore long reads are superior to short reads with regard to detection of de novo chromothripsis rearrangements. The long reads also enable efficient phasing of genetic variations, which we leveraged to determine the parental origin of all de novo chromothripsis breakpoints and to resolve the structure of these complex rearrangements. Additionally, genome-wide surveillance of inherited SVs reveals novel variants, missed in short-read data sets, a large proportion of which are retrotransposon insertions. We provide a first exploration of patient genome sequencing with a nanopore sequencer and demonstrate the value of long-read sequencing in mapping and phasing of SVs for both clinical and research applications.


Conflict of interest statement

W.P.K. and J.d.R. have received financial compensation for travel and accommodation expenses to speak at an Oxford Nanopore Technologies-organized meeting. The remaining authors declare no competing financial interests.

Figures

Fig. 1
Fig. 1
Chromothriptic de novo breakpoint junctions of Patient 1 and Patient 2. a Circos plots for Patient 1 and Patient 2, respectively. For Patient 1, we took the set of 40 validated de novo breakpoint junctions obtained by Illumina whole-genome sequencing of the patient and its parents. For Patient 2, we depicted the breakpoint junctions as published recently. The outer ring of the circos plot shows the chromosomes and the inner ring shows the copy number changes as revealed by FREEC analysis of Illumina whole-genome sequencing data for both patients. Colored lines (arcs) indicate breakpoint junctions. b SV genotyping comparison across the chromothriptic breakpoint junctions, between Illumina Hiseq data and MinION data, using various tools tested. The x-axis represents different breakpoint junctions and the y-axis shows different SV calling methods and data sets. The individual breakpoint junctions are indicated by colors specifying the type of breakpoint junction
Fig. 2
Fig. 2
Phasing of chromothripsis breakpoint junctions. Phasing of MinION reads overlapping 40 chromothripsis breakpoint junctions in Patient 1. The x-axis displays each of 40 chromothripsis breakpoint junctions identified in Patient 1, stratified by allele (alternative and reference). On the left side only reads supporting the alternative allele are depicted and on the right side reads supporting the reference allele are shown. The y-axis indicates the number of reads supporting each allele, for each of the 40 breakpoint junctions. Legend colors indicate whether the assigned read phase was paternal, maternal, or unknown
Fig. 3
Fig. 3
Unraveling long-range chromothripsis structure from the nanopore data. a Schematic diagram showing the patterns of breakpoint junctions in Patient 1. The human reference genomic regions that are involved in the chromothriptic event are depicted horizontally for each affected chromosome. The slanted lines connecting various reference segments represent breakpoint junctions. The orientations of breakpoint junctions are indicated by arrows as shown in the legend. Black (instead of open) arrows indicate the boundaries of a chromosomal deletion resulting from the chromothripsis, whereas open arrows indicate double-stranded DNA breaks. b Structure of the chromothriptic derivative chromosomes in Patient 1, as inferred from the orientations and order of breakpoint junctions shown in a. c Reconstruction of a chromothriptic subregion of chromosome 7, involving five chromosomal segments. Overlapping aligned reads originating from Patient 1’s paternal haplotype were used. Nanopore reads that are instrumental for segment connectivity are indicated by black bars. The coverage track has been generated from all paternal reads mapping to the respective chromosomal segments. The underlying derived chromosome’s structure is illustrated on the bottom. d Haploid assembly results of the chromothriptic region of Patient 1. A 469 kb contiguous assembled sequence (utg000062l) spans, through 54 segments that align back to the reference genome, the same chromothripsis subregion illustrated in c. The assembled contig is fragmented into many (54) aligned segments, as Miniasm does not compute a consensus sequence
Fig. 4
Fig. 4
Genome-wide detection of SVs using nanopore sequencing data. ad The total amount of high-confidence NanoSV calls for Patient 1 and Patient 2 jointly, across different SV size bins and stratified by SV type as follows: a deletions, b insertions, c duplications, and d inversions. The NanoSV calls were intersected with SV calls from other data sources (Illumina data of Patient 1 and Patient 2 and 1KG phase 3 sites). For a, b, the x-axis was trimmed to 1000 bp for visibility and a small number of variants beyond this size are not displayed in the figure. Similarly, for c, the x-axis was limited to 200 bp. e The repeat content of nanopore-specific insertions. f The repeat content of nanopore-specific deletions. Repeat annotation was obtained from the UCSC repeat masker table (GRCh37)
Fig. 5
Fig. 5
Performance of SNV phasing using nanopore reads. a Distribution of phased block lengths resulting from read-based phasing by WhatsHap. Patient 1 and Patient 2 are shown in brown and blue, respectively. b Fraction of phase connections (i.e., pairs of consecutive SNVs phased with respect to each other) established in the two patients and with/without masking repeats (light/dark colors). c For Patient 1, switch error rates of all pairs of trio-based (PBT), population-based (ShapeIt), and read-based (WhatsHap) phasing are shown. For Patient 2, where no family data is available, read-based phasing is compared to population-based phasing

References

    1. Gilissen C, Hoischen A, Brunner HG, Veltman JA. Unlocking Mendelian disease using exome sequencing. Genome Biol. 2011;12:228. doi: 10.1186/gb-2011-12-9-228. - DOI - PMC - PubMed
    1. Ashley EA. Towards precision medicine. Nat. Rev. Genet. 2016;17:507–522. doi: 10.1038/nrg.2016.86. - DOI - PubMed
    1. Ng SB, et al. Targeted capture and massively parallel sequencing of 12 human exomes. Nature. 2009;461:272–276. doi: 10.1038/nature08250. - DOI - PMC - PubMed
    1. Ashley EA, et al. Clinical assessment incorporating a personal genome. Lancet. 2010;375:1525–1535. doi: 10.1016/S0140-6736(10)60452-7. - DOI - PMC - PubMed
    1. Conrad DF, et al. Origins and functional impact of copy number variation in the human genome. Nature. 2010;464:704–712. doi: 10.1038/nature08516. - DOI - PMC - PubMed

Publication types

MeSH terms