. 2018 Jun;31(3):415-424.
doi: 10.1007/s10334-017-0659-3. Epub 2017 Nov 6.

T 2 mapping of cerebrospinal fluid: 3 T versus 7 T

Affiliations

T 2 mapping of cerebrospinal fluid: 3 T versus 7 T

Jolanda M Spijkerman et al. MAGMA. 2018 Jun.

Abstract

Object: Cerebrospinal fluid (CSF) T 2 mapping can potentially be used to investigate CSF composition. A previously proposed CSF T 2-mapping method reported a T 2 difference between peripheral and ventricular CSF, and suggested that this reflected different CSF compositions. We studied the performance of this method at 7 T and evaluated the influence of partial volume and B 1 and B 0 inhomogeneity.

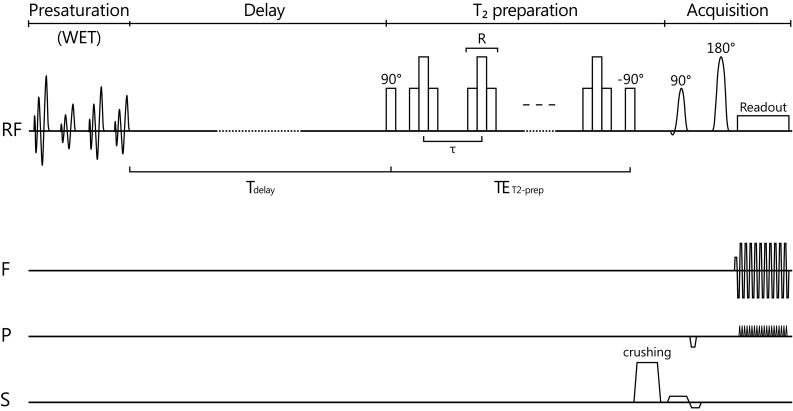
Materials and methods: T 2-preparation-based CSF T 2-mapping was performed in seven healthy volunteers at 7 and 3 T, and was compared with a single echo spin-echo sequence with various echo times. The influence of partial volume was assessed by our analyzing the longest echo times only. B 1 and B 0 maps were acquired. B 1 and B 0 dependency of the sequences was tested with a phantom.

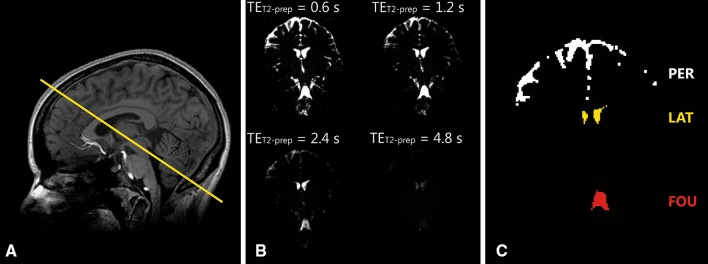
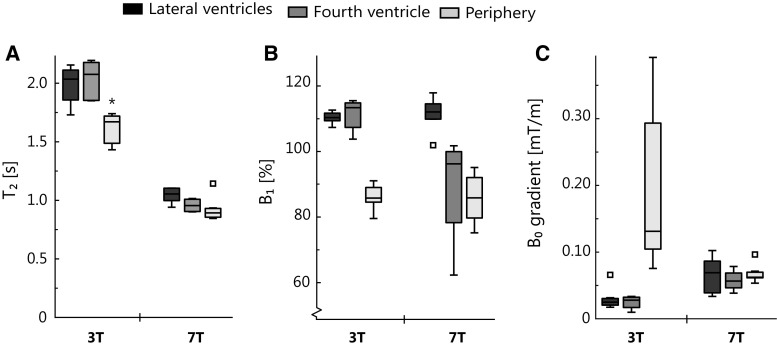
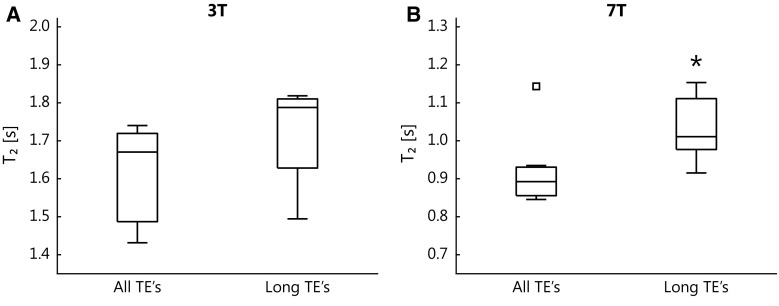
Results: T 2,CSF was shorter at 7 T compared with 3 T. At 3 T, but not at 7 T, peripheral T 2,CSF was significantly shorter than ventricular T 2,CSF. Partial volume contributed to this T 2 difference, but could not fully explain it. B 1 and B 0 inhomogeneity had only a very limited effect. T 2,CSF did not depend on the voxel size, probably because of the used method to select of the regions of interest.

Conclusion: CSF T 2 mapping is feasible at 7 T. The shorter peripheral T 2,CSF is likely a combined effect of partial volume and CSF composition.

Keywords: 3 T; 7 T; Cerebrospinal fluid; MRI; T2 relaxation.


Conflict of interest statement

Conflict of interest

The authors declare that they have no competing interests.

Ethical approval

All procedures performed in studies involving human participants were in accordance with the ethical standards of the institutional and/or national research committee and with the 1964 Helsinki declaration and its later amendments or comparable ethical standards.

Informed consent

Informed consent was obtained from all individual participants included in the study.

Figures

Fig. 1
Fig. 1
Cerebrospinal fluid T 2 mapping pulse sequence. The sequence consists of four parts: water suppression enhanced through T1 effects (WET) presaturation, a fixed delay with duration T delay, a T 2 preparation module with Malcolm Levitt (MLEV) phase cycling, and a spin echo echo planar imaging (SE-EPI) image acquisition. T2 relaxation occurs during TET2-prep. To perform T 2 mapping the sequence was repeated, while the number of refocusing pulses (and therefore TET2-prep) was increased for a fixed interpulse delay τ. The applied RF pulses are shown on the RF axis, and the applied gradients are shown on the frequency (F), phase (P), and slice (S) encoding axes
Fig. 2
Fig. 2
a Planning of the cerebrospinal fluid (CSF) T 2 mapping scans, through the lateral ventricles and the fourth ventricle. b CSF T 2 mapping scans at 7 T for increasing echo times (TET2-prep) (0.6, 1.2, 2.4, and 4.8 s), shown with equal intensity scaling. c The region of interest masks used: the periphery (PER; white), the lateral ventricles (LAT; yellow), and the fourth ventricle (FOU; red)
Fig. 3
Fig. 3
Results of the phantom measurements for the B 1 (a) and B 0 gradient dependency (b) showing the fitted T 2 for different B 1 values and through-plane B 0 gradient strengths, respectively. The error bars show the 95% confidence interval of the fitted T 2. The cerebrospinal fluid T 2 mapping sequence shows only minor sensitivity to B 1 and to the through-plane B 0 gradient (and thus to diffusion). The effect of the B 0 gradient was most apparent for the highest B 0 gradient. The B 1 dependency was determined with a B 0 gradient strength of 0.5 mT/m to avoid free induction decay (FID) artifacts in regions with B 1 deviating from 100%. For a B 0 gradient of 0.2 mT/m, the confidence interval was greater because of FID artifacts
Fig. 4
Fig. 4
In vivo results: T 2 (a), B 1 (b), and B 0 gradient (c) for the three different regions of interest. Outliers are represented by a square. Significant differences in measured T 2 were found between the periphery and the lateral and fourth ventricles at 3 T (indicated by an asterisk)
Fig. 5
Fig. 5
T 2 values of peripheral cerebrospinal fluid resulting from the use of only the longest echo times (TEs) compared with the original analysis. Outliers are represented by a square. At both 3 and 7 T an increase in T 2 can be observed. The asterisk indicates a significant difference with the original analysis (including all TEs)
Fig. 6
Fig. 6
T 2 values of the phantom, resulting from the use of only the longest echo times (TEs; orange) compared with the original analysis (blue). Both analyses result in similar T 2 values

References

    1. Qin Q. A simple approach for three-dimensional mapping of baseline cerebrospinal fluid volume fraction. Magn Reson Med. 2011;65:385–391. doi: 10.1002/mrm.22705. - DOI - PubMed
    1. Iliff JJ, Wang M, Liao Y, Plogg BA, Peng W, Gundersen GA, Benveniste H, Vates GE, Deane R, Goldman SA, Nagelhus EA, Nedergaard M. A paravascular pathway facilitates CSF flow through the brain parenchyma and the clearance of interstitial solutes, including amyloid β. Sci Transl Med. 2012;4:147ra111. doi: 10.1126/scitranslmed.3003748. - DOI - PMC - PubMed
    1. Iliff JJ, Nedergaard M. Is there a cerebral lymphatic system? Stroke. 2013;44:2013–2016. doi: 10.1161/STROKEAHA.112.678698. - DOI - PMC - PubMed
    1. Xie L, Kang H, Xu Q, Chen MJ, Liao Y, Thiyagarajan M, O’Donnell J, Christensen DJ, Nicholson C, Iliff JJ, Takano T, Deane R, Nedergaard M. Sleep drives metabolite clearance from the adult brain. Science. 2013;342:373–377. doi: 10.1126/science.1241224. - DOI - PMC - PubMed
    1. Spector R, Robert Snodgrass S, Johanson CE. A balanced view of the cerebrospinal fluid composition and functions: focus on adult humans. Exp Neurol. 2015;273:57–68. doi: 10.1016/j.expneurol.2015.07.027. - DOI - PubMed

LinkOut - more resources