. 2018 Jan 15;433(2):461-472.
doi: 10.1016/j.ydbio.2017.07.010. Epub 2017 Oct 31.

Systemic cell cycle activation is induced following complex tissue injury in axolotl

Affiliations

Systemic cell cycle activation is induced following complex tissue injury in axolotl

Kimberly Johnson et al. Dev Biol. .

Abstract

Activation of progenitor cells is crucial to promote tissue repair following injury in adult animals. In the context of successful limb regeneration following amputation, progenitor cells residing within the stump must re-enter the cell cycle to promote regrowth of the missing limb. We demonstrate that in axolotls, amputation is sufficient to induce cell-cycle activation in both the amputated limb and the intact, uninjured contralateral limb. Activated cells were found throughout all major tissue populations of the intact contralateral limb, with internal cellular populations (bone and soft tissue) the most affected. Further, activated cells were additionally found within the heart, liver, and spinal cord, suggesting that amputation induces a common global activation signal throughout the body. Among two other injury models, limb crush and skin excisional wound, only limb crush injuries were capable of inducing cellular responses in contralateral uninjured limbs but did not achieve activation levels seen following limb loss. We found this systemic activation response to injury is independent of formation of a wound epidermis over the amputation plane, suggesting that injury-induced signals alone can promote cellular activation. In mammals, mTOR signaling has been shown to promote activation of quiescent cells following injury, and we confirmed a subset of activated contralateral cells is positive for mTOR signaling within axolotl limbs. These findings suggest that conservation of an early systemic response to injury exists between mammals and axolotls, and propose that a distinguishing feature in species capable of full regeneration is converting this initial activation into sustained and productive growth at the site of regeneration.

Keywords: Axolotl; Cell cycle; Limb regeneration; MTOR; Systemic.


Figures

Figure 1
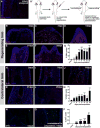
Figure 1. Cell cycle re-entry occurs within limbs contralateral to regenerating limbs
(A) Baseline EdU staining was performed on intact, unamputated limbs. Tissue sections were counterstained with DAPI. (A’) Experimental design for assaying cell cycle re-entry in limbs contralateral to regenerating limbs. (B–G) Cell-cycle re-entry in the internal (non-epidermal) cells of the amputated and regenerating limb measured just proximal to the wound epidermis. (B–F) Representative tissue sections stained with EdU and DAPI. (G) Quantification. (H–M) Cell-cycle re-entry in the internal cells of the contralateral limbs at various time points post-amputation of the limb on the other side. (H–L) EdU and DAPI. (M) Quantification. (N–P) Anti-phospho-Histone-H3 stained tissue sections counterstained with DAPI. (N) Representative tissue section from an intact, unamputated limb. (O) Representative tissue section from a limb contralateral to a regenerating limb at 14 days post-amputation. (P) Quantification of the fraction of DAPI+ cell nuclei which are also positive for phosphorylated Histone H3 in limbs contralateral to a regenerating limb at various time points post-amputation. * denotes p<0.05; ** denotes p<0.01, *** denotes p<0.001, **** denotes p<0.0001, n.s., not significant. Scale bar in A is 100 microns and applies to all.
Figure 2
Figure 2. A subset of activated cells persists in all major tissue types in contralateral limbs
(A–C’) Tissue sections processed for EdU and counterstained with DAPI from limbs contralateral to a regenerating limb at several time points during regeneration. (A’–C’) Magnified view of insets depicted in (A–C). (A–A’) Representative tissue section from a limb contralateral to a regenerating limb at 3 days post-amputation. (B–B’) Representative tissue section from a limb contralateral to a regenerating limb at 9 days post-amputation. (C–C’) Representative tissue section from a limb contralateral to a regenerating limb at 14 days post-amputation. Arrowheads in C’ refer to glands. (D) Quantification of epidermis. (E) Quantification of skeletal elements (bone and cartilage). (F) Quantification of other internal tissues (including muscle, nerve, vasculature, joint, perichondrial, dermis). (G–J) Representative tissue sections processed for EdU and counterstained with Pax7 from limbs contralateral to regenerating limbs at several time points during regeneration. Arrowheads denote double positive nuclei. * denotes p<0.05; ** denotes p<0.01, *** denotes p<0.001. Scale bar is 100 microns and applies to all.
Figure 3
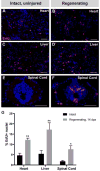
Figure 3. Cell cycle re-entry is promoted in organs of animals with regenerating limbs
(A–F) Representative tissue sections from internal organs harvested from intact, uninjured controls (A,C,E) or from axolotls with a regenerating limb at 14 dpa (B,D,F) stained with EdU and counterstained with DAPI. (A,B) Representative tissue sections from the heart. (C,D) Representative tissue sections from the liver. (E,F) Representative tissue sections from the spinal cord. (G) Quantification. * denotes p<0.05; ** denotes p<0.01, *** denotes p<0.001. Scale bar is 500 microns and applies to all.
Figure 4
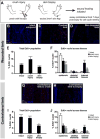
Figure 4. Nonregenerative injuries vary in activation response in contralateral limbs
(A) Schematic of experiment. (B–F) EdU and DAPI stain on representative tissue sections from intact control limbs (B) and wounded limbs (C,D). (E) Quantification of (B–D). (F) Quantification of tissues. (G–J) EdU and DAPI stain on representative tissue sections from limbs contralateral to crushed (G) or limbs with excisional skin wounds (H) at 7 days post injury. (I) Quantification of (B,G,H). (J) Quantification of activated cells in distinct tissues of the limb. * denotes p<0.05; ** denotes p<0.01, *** denotes p<0.001; n.s. = not significant. Scale bar is 100 microns and applies to all.
Figure 5
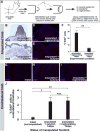
Figure 5. Cell cycle re-entry in contralateral limbs is independent of wound epidermis on the regenerating limb
(A) Schematic of experiment. (B–F) Response on the amputated limb in the unmanipulated, regenerating context versus the sutured context. (B–C) Hematoxylin and eosin stain on tissue sections from regenerating (B) and sutured (C) limbs at 14 days post-amputation. (D–E) EdU and DAPI stain on tissue sections from regenerating (D) and sutured (E) limbs at 14 days post-amputation. (F) Percentage of DAPI+ cell nuclei that are also EdU+ in regenerating limbs versus sutured limbs at 14 days post-amputation. (G–I) Representative tissue sections of intact control limbs versus limbs contralateral to regenerating or sutured limbs at various time points post-amputation. (J) Quantification of (G–I). * denotes p<0.05; ** denotes p<0.01; n.s. = not significant. Scale bar in (B) is 500 microns and applies to (B–C). Scale bar in (D) is 100 microns and applies to (D–E, G–I).
Figure 6
Figure 6. mTOR activity is differentially regulated following amputation in injured versus intact tissues
(A–T’) Tissue sections processed with DAPI, EdU, and stained with anti-pS6 in intact, uninjured control limbs (A–C’) versus those contralateral to a regenerating limb at various time points post-amputation. (D–I’) Representative tissue section from a regenerating stump at 3 dpa (D–F’) and its contralateral intact limb (G–I’). (J–O’) Representative tissue section from a regenerating limb at 7 dpa (J–L’) and its contralateral intact limb (M–O’). (P–U’) Representative tissue section from a regenerate limb at 9 dpa at early blastema stage (P–R’) and its contralateral intact limb (S–U’). (V) Quantification of total EdU+ population expressing pS6. (W) Quantification of total DAPI+ population coexpressing EdU and pS6. * denotes p<0.05; ** denotes p<0.01, *** denotes p<0.001, **** denoted p<0.0001. Scale bar is 100 microns and applies to all.

References

    1. Foex BA. Systemic responses to trauma. Br Med Bull. 1999;55(4):726–43. - PubMed
    1. Brochner AC, Toft P. Pathophysiology of the systemic inflammatory response after major accidental trauma. Scand J Trauma Resusc Emerg Med. 2009;17:43. - PMC - PubMed
    1. Cordeiro JV, Jacinto A. The role of transcription-independent damage signals in the initiation of epithelial wound healing. Nat Rev Mol Cell Biol. 2013;14(4):249–62. - PubMed
    1. Anthony DC, Couch Y. The systemic response to CNS injury. Exp Neurol. 2014;258:105–11. - PubMed
    1. Hirsiger S, et al. Danger signals activating the immune response after trauma. Mediators Inflamm. 2012;2012:315941. - PMC - PubMed

Publication types

MeSH terms

Substances

LinkOut - more resources