. 2017 Dec:192:61-71.
doi: 10.1016/j.imlet.2017.10.005. Epub 2017 Oct 31.

Density dependent re-tuning of autoreactive T cells alleviates their pathogenicity in a lymphopenic environment

Affiliations

Density dependent re-tuning of autoreactive T cells alleviates their pathogenicity in a lymphopenic environment

Eleanore Chuang et al. Immunol Lett. 2017 Dec.

Abstract

Peripheral T cell tolerance is challenging to induce in partially lymphopenic hosts and this is relevant for clinical situations involving transplant tolerance. While the shortage of regulatory cells is thought to be one reason for this, T cell-intrinsic tolerance processes such as anergy are also poorly triggered in such hosts. In order to understand the latter, we used a T cell deficient mouse model system where adoptively transferred autoreactive T cells are significantly tolerized in a cell intrinsic fashion, without differentiation to regulatory T cells. Intriguingly these T cells often retain sufficient effector functions to trigger autoimmune pathology. Here we find that the high population density of the autoreactive T cells that accumulated in such a host limits the progression of the cell-intrinsic tolerance process in T cells. Accordingly, reducing the cell density during a second transfer allowed T cells to further tune down their responsiveness to antigenic stimulation. The retuning of T cells was reflected by a loss of the T cell's abilities to proliferate, produces cytokines or help B cells. We further suggest, based on altering the levels of chronic antigen using miniosmotic pumps, that the effects of cell-density on T cell re-tuning may reflect the effective changes in the antigen dose perceived by individual T cells. This could proportionally elicit more negative feedback downstream of the TCR. Consistent with this, the retuned T cells showed signaling defects both proximal and distal to the TCR. Therefore, similar to the immunogenic activation of T cells, cell-intrinsic T cell tolerance may also involve a quantitative and progressive process of tuning down its antigen-responsiveness. The progress of such tuning seems to be stabilized at multiple intermediate stages by factors such as cell density, rather than just absolute antigen levels.


Figures

Figure 1
Figure 1. A re-tuning of auto-reactive T cells eliminates immunopathology
a. Hind limbs of PCC+,CD3ε-mice 64 days after receiving naïve 5C.C7 T cells (1R, top panels) or a re-transfer of 1R T cells (2R, bottom panels). b. Secondary transfers of T cells abrogate pathology. The clinical scores of mice that received naïve 5C.C7 T cells (called the 1R host), or mice that received 5C.C7 T cells that were re-purified from a 1R animal (the recipient now called a 2R host) or mice that received cells re-purified from a 2R animal (the recipient now called a 3R host). Scoring was done on examination of mice 8 weeks after each T cell transfer. The differences between the 1R hosts with either the 2R (P=0.003 in a Two-tailed t Test) or 3R (P=0.0033) hosts are highly significant while the scores of the 2R and 3R hosts are not significantly different between themselves (P=0.76 in a two-tailed T test). c. Total IgG1, IgG2a and IgG2a levels in serum of the recipients of each successive transfer (as in 1b) measured 8 weeks after T cell infusion, using isotype specific ELISA. The levels of each immunoglobulin isotype in the 1R group was significantly (P<0.01 in multiple 1way ANOVA comparisons) different from those in the 2R and 3R sera samples. However, neither 2R nor 3R sera samples were significantly different from each other (P=0.625 in a Two-tailed non parametric t test with Mann-Whitney correction). d. The number of 5C.C7 T cells recovered at various days after transfer in the case of 1R hosts (open red squares), 2R hosts (open blue squares) and 3R hosts (open black squares). It should be noted that this is essentially measuring the behavior of naive T cells (upon their first transfer into the 1R host), 1R T cells (as they enter a fresh PCC+, CD3ε-host to become a 2R host) and 2R T cells (as they proliferate in a new PCC+, CD3ε-host to become a 3R host. Data shown are from three independent mice for each group, i.e. n=3 per time point. The average cell recovery and standard deviations are plotted at each time point e. CFSE dilution profiles from a representative experiment at 1 day (black), 4 days (red) and 7 days (blue) after transfers in the 1R (top panel), 2R (middle panel) or 3R (bottom panel) are shown. While the black peak indicates the position of undivided T cells on Day 1, it should be noted that passive loss of CFSE alters the location of the undivided peak in successive days. For instance, the bulk of the 3R cells remain undivided over the experiment, although a shift in the actual intensity of the CFSE-highest T cell population can be observed over the 3 time points f. Data from five independent mice (n=5) at the day 4 time point as in (g) are quantitated. The numbers of T cells that remain undivided are calculated by multiplying the fraction of cells in the CFSE-highest peak with the actual number of T cells recovered from each mice. Importantly, no undivided T cells were detected in the 1R host at this time point. There were significantly more undivided T cells in the 3R host compared to the 1R (P=0.0004 in a two-tailed t test) or 2R (P=0.0007). Given that the 1R hosts did not tend to have undivided T cells, the undivided cells the 2R hosts were significantly different as well (P=0.0094). g. In order to estimate the survival of the transferred T cells between days 1 and 4, we plotted the recovery of cells on day 1 (left box-and-whisker plots in each of the column-pairs) when the transferred cells were all undivided (CFSE-high). We then back-calculated the effective precursor frequency of the cells on day 4 (as described in methods) to estimate what the effective cell number would be if no division had occurred. The lack of any significant difference between the day 1 and day 4 plots suggests that there was no differential cell death in these groups up to this time point. h. IL-2 secretion over 48 hours of in vitro stimulation is progressively lost in successive transfers to PCC+,CD3ε-hosts (1R, 2R and 3R) while successive transfer and acute re-challenge of primed T cells in PCC-ve,CD3ε-hosts (1M, 2M and 3M) retains responsiveness. i. Expression of activation markers (CD44 and CD62L) shows the progressive differentiation of 5C.C7 T cells from naive (no transfer yet; left panel) to 1R (cells recovered 7 days after transfer from 1st host; middle panel) and 2R (cells recovered 7 days after transfer from 2nd host; right panel) stages. Plots are gated on TCR-Vβ3+, CD4+, 7AAD-ve cells and representative of three mice in each group. j. Neither the T cells from a 1R host (left plot), nor 2R (right plot) T cells show significant expression of Treg markers. Plots are gated on TCR-Vβ3+, CD4+, 7AAD-ve cells and representative of three independent experiments at days 4, 7 and 65 after transfer.
Figure 2
Figure 2. Role of T cell activation state on the re-tuning of tolerant T cells
a. T cells in a stable plateau phase of a 1R host challenged on Day 28 with PCC acutely (blue lines) showed a transient expansion while unchallenged 1R T cells maintained a stable plateau (red lines). Data are from n=3 to 4 mice per time point for each group over the time course shown. b. T cells isolated from 1R hosts, various days after acute challenge (now called 1Rp cells - blue lines with blue open squares; n=3 mice per time point) produced similar amounts of IL-2 upon in vitro re-stimulation, as those from unchallenged 1R (red lines with red open squares; n=3 mice per time point). Both were ~90% lower than naïve T cell secretion (black line, with black closed square). The IL-2 production from naïve T cells (black line) is provided here for comparison. Note that each naïve 5C.C7 T cell data point is from cells freshly isolated from a 5C.C7 TCR transgenic mouse and stimulated ex vivo in similar conditions as the 1R and 1Rp cells at each time point –before the supernatants were used for IL-2 ELISA. c. In vivo proliferation of Naïve 5CC7 T cells (N, top panel), T cells recovered from an 1R host with no additional peptide challenge (1R, middle panel) or T cells recovered from an 1R host that was acutely challenged 14 days ago with an additional bolus of peptide (1Rp, bottom panel). In order to assess their proliferation, a million of each of these cells were CFSE labelled and transferred to fresh PCC+,CD3ε-hosts. Cells were recovered from these hosts 1 day (Black lines in each plot) or 4 days (blue lines) after this transfer. Plots are representative of 5 mice each from two separate experiments. Preliminary analysis of CFSE dilution as discussed in methods do not reveal any differences between 1R and 1Rp cells in this assay (data not shown). d. In order to evaluate the density dependent effect on T cell retuning, different numbers of naive T cells were transferred to new PCC+,CD3ε-hosts – effectively recreating a 1R host but with different levels of input naïve T cells which would have to proliferate differentially to reach a similar plateau. The proliferative expansion of 50 million Naive T cells (open red triangles; note that the size of each triangle symbol on this graph matches with the dilution of the input cells), 5 million Naive T cells (open blue triangles), 0.5 million Naive T cells (open brown triangles), 0.05 million Naive T cells (open orange triangles) or 0.005 million Naive T cells (gray closed triangles) in a fresh PCC+,CD3ε-host. Given the scope and time point of these experiments, the data in each group represents cells recovered from one mouse per time point per group. Repeats of this experiment with different combinations of the above are shown in supplementary figure 1. e. The IL-2 production from the T cells recovered from (d) at each time point (now equivalent to 1R state T cells) upon stimulation with fresh splenocytes presenting 10uM peptide, is compared to that of naïve T cells (black squares) stimulated under similar conditions for 48 hours (n values same as d). f. The in vivo proliferative potential of the cells recovered 22 days after transfer as in (d) was examined by injecting them into fresh PCC+,CD3ε-hosts. Typically a million cells are injected – and the recovery of T cells 60 hours (2.5 days) and 84 hours (3.5 days) after transfer was enumerated. The data is presented as a fold expansion relative to the recovery on day 1. Each datapoint is an average of recovery from two mice (n=2 per time point, per group); however repeat experiments are presented in Supplementary figure 1a. g. Expansion of naïve 5C.C7 T cells (open black squares; setting up a 1R host), previously primed (open red triangles; essentially setting up a 1R host – but with previously activated T cells as the input – referred to as PR hosts hitherto) or 1R T cells (closed blue triangles; setting up a 2R host as in Figure 1, in fresh PCC+,CD3e- hosts. (n=3 mice per time point per group) h. T cells recovered from 4–5 mice per groups (at 14 or 38 days) were independently stimulated ex vivo with fresh splenocytes and 10uM cognate peptide. The production of IL-2 (h) was measured in the culture supernatants from the cells that were either naïve (N), Primed (P) or recovered from 1R, 2R or PR hosts i. IFN-γ production measured in the same cultures as in (h).
Figure 3
Figure 3. Density dependent re-tuning of tolerant T cells
a. The ability of T cells recovered 39 days after transfer from a 1R host (open red squares) to make IL-2 after ex vivo stimulation with APCs and cognate peptide is compared to that of naïve 5C.C7 T cells (closed black squares) and cells from a standard 2R host (made by transferring in 1 million 1R T cells to a PCC+,CD3e- host, open green inverted triangles) at the same time. In order to evaluate the role of cell density in the re-tuning to a 2R state, 125 million cells from a 1R host were transferred to a fresh PCC+,CD3e- hosts (blue squares) in parallel. It was necessary to purify 1R T cells from about 15 mice to generate a sufficient cell number for the last time point. Representative data from one animal each (as recipient) is shown; replicates are in (b) and (c). b. Similar to (a), IL-2 production (at the 10uM dose) from T cells recovered 28 or 40 days later from 2R hosts that were created with different numbers of input 1R cells are shown (closed blue symbols and blue line; n=3–5 mice per point combining 2 separate experiments). The IL-2 is plotted as a percentage of that made by naïve T cells (i.e. relative to the black line in (a) for example)). Also plotted is the relative IL-2 made by 1R T cells (open red square; n=4 mice) generated by transferring naïve T cells to PCC+,CD3e- hosts. c. The IFN-γ production from the same culture supernatants as in b – normalized to the relative amounts made by 1R T cells (since naïve CD4 T cells do not typically secrete significant levels of this cytokine) d. IL-2 production during the in vitro re-stimulation of Naïve (N), 1R or 2R T cells are compared those from 1R hosts with a mini-osmotic pump constantly outputting PCC peptide for 14 days (1R+P). n= 4 mice per point as shown.
Figure 4
Figure 4. Molecular alterations underlying the 2R state
a. T cells from 1R and 2R cells were stimulated ex vivo with antibodies to CD3 and the levels of TCR signals transduced mesasured by intracellular staining for the tyrosine phosphorylation of Zap70 at the Y292 position by flow cytometry. Levels of intracellular pZap70-Y292 at baseline – i.e. zero minutes (orange histogram), 0.5 minute (green), 1 minute (blue) and 5 minutes (red) after stimulation of Naïve, Primed, T cells from 1R or 2R indicated hosts are shown. The plots are a representative histogram for replicates summarized in (b). b. The ratio of peak vs baseline intensities of pZap70-Y292 staining calculated from a Mean Fluorescence Intensity measurement using FlowJo software from multiple experiments as in (a) c. In order to evaluate if a TCR proximal signaling deficit is involved, T cells were stimulated via TCR (using APCs pulsed with cognate peptide – left 3 columns) or using a drug cocktail that bypasses some of the proximal mediators of TCR signaling (right 3 columns). IL-2 secretion after in vitro stimulation of indicated T cell states measures by ELISA are shown. d. The relative expression levels (normalized to a common RNA reference in the microarray experiment) of key negative regulators of T cell activation are shown from comparing T cells from the 1R and 2R group. The microarray analysis does not identify a significant relationship between usual suspects and the re-tuning process, although this requires future analysis.
Figure 5
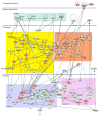
Figure 5. A birds-eye view of the gene expression changes in the 2R state
A connectivity map of genes enriched in the microarray comparison between FACS sorted 1R and 2R T cells. The top four networks inferred using the Ingenuity platform were merged, orphans deleted and the topology reformatted to show predicted cellular localization of the proteins. Genes in red are upregulated in 2R and those in green are downregulated. The mean ratios are also shown below each gene symbol. In addition, the network also shows additional proteins (not directly detected as different in the arrays) which have experimentally demonstrated interactions to those elements found in the analysis (not colored) as well as protein families that are involved in the pathways shown in the analysis (double ring circles). The arrows show the interactions and experimentally observed directionalities; however the distance and weight are only scaled for clear representation and not to any biologically relevant criteria.

Similar articles

Cited by

References

    1. Kronenberg M, Rudensky A. Regulation of immunity by self-reactive T cells. Nature. 2005;435(7042):598–604. - PubMed
    1. Singh NJ, Schwartz RH. Primer: mechanisms of immunologic tolerance. Nature Clinical Practice Rheumatology. 2006;2(1):44–52. - PubMed
    1. Zheng Y, Rudensky AY. Foxp3 in control of the regulatory T cell lineage. Nat Immunol. 2007;8(5):457–462. - PubMed
    1. Kirk AD, Harlan DM, Armstrong NN, Davis TA, Dong Y, Gray GS, Hong X, Thomas D, Fechner JH, Jr, Knechtle SJ. CTLA4-Ig and anti-CD40 ligand prevent renal allograft rejection in primates. Proceedings of the National Academy of Sciences of the United States of America. 1997;94(16):8789–94. - PMC - PubMed
    1. Fehr T, Sykes M. Tolerance induction in clinical transplantation. Transplant immunology. 2004;13(2):117–30. - PubMed

Publication types