

Models for Unsymmetrical Active Sites in Metalloproteins: Structural, Redox, and Magnetic Properties of Bimetallic Complexes with MII-(μ-OH)-FeIII Cores
- PMID: 29112385
- PMCID: PMC5696092
- DOI: 10.1021/acs.inorgchem.7b02230
Models for Unsymmetrical Active Sites in Metalloproteins: Structural, Redox, and Magnetic Properties of Bimetallic Complexes with MII-(μ-OH)-FeIII Cores
Abstract
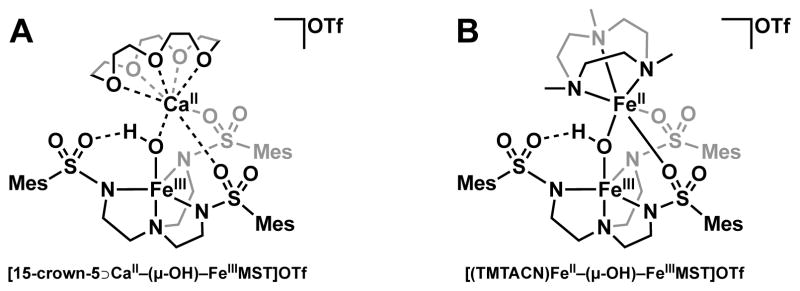
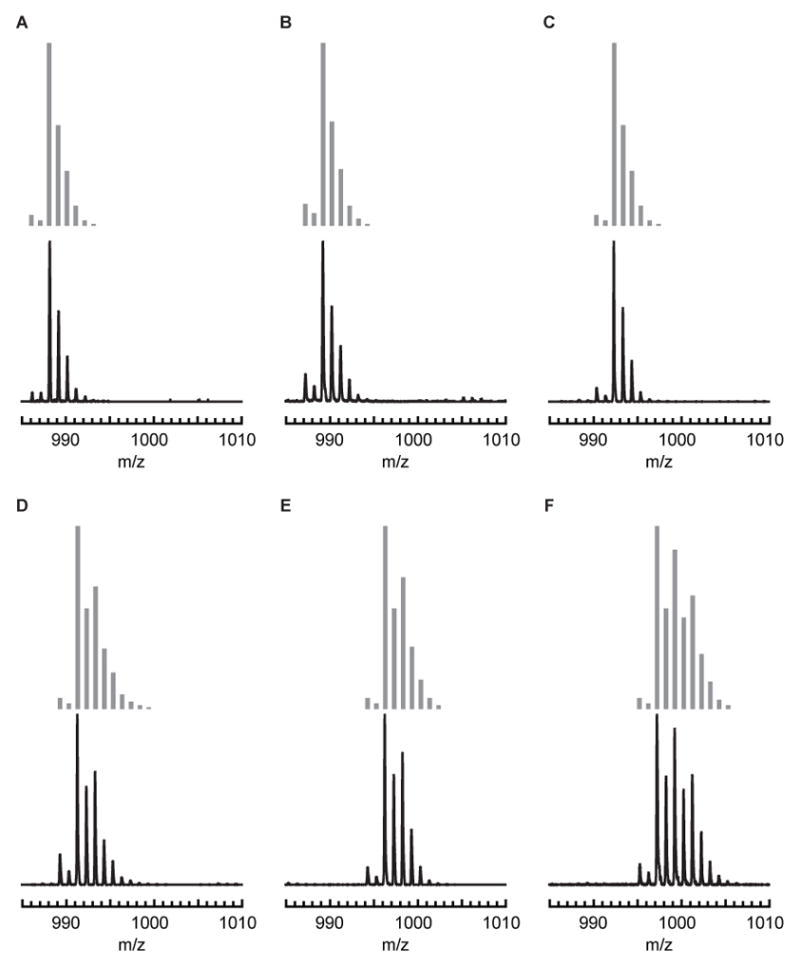
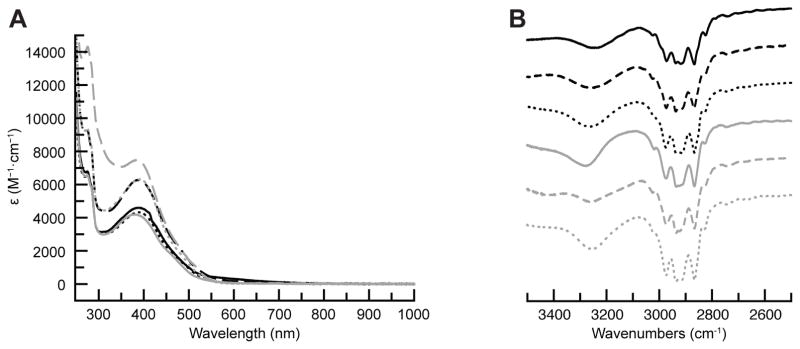
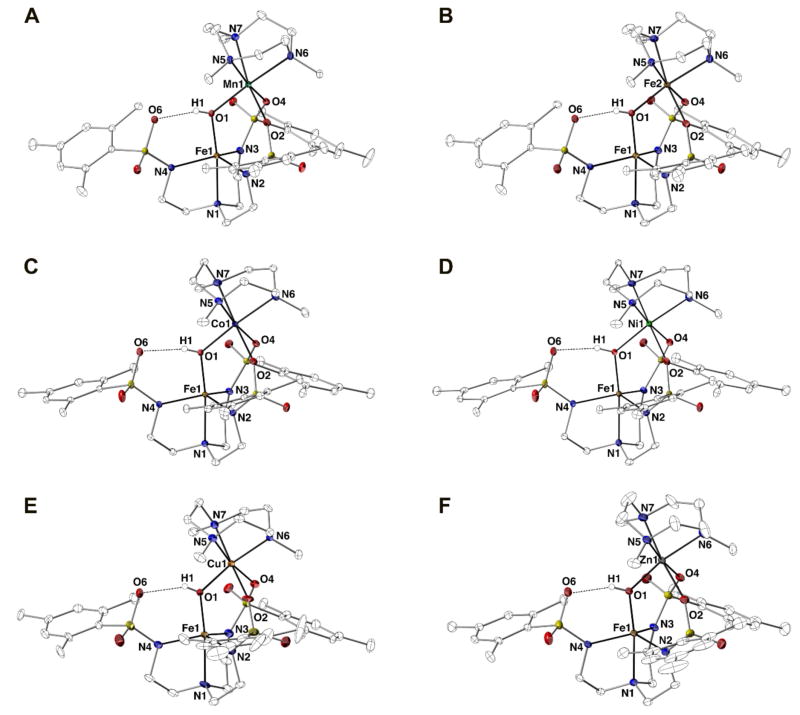
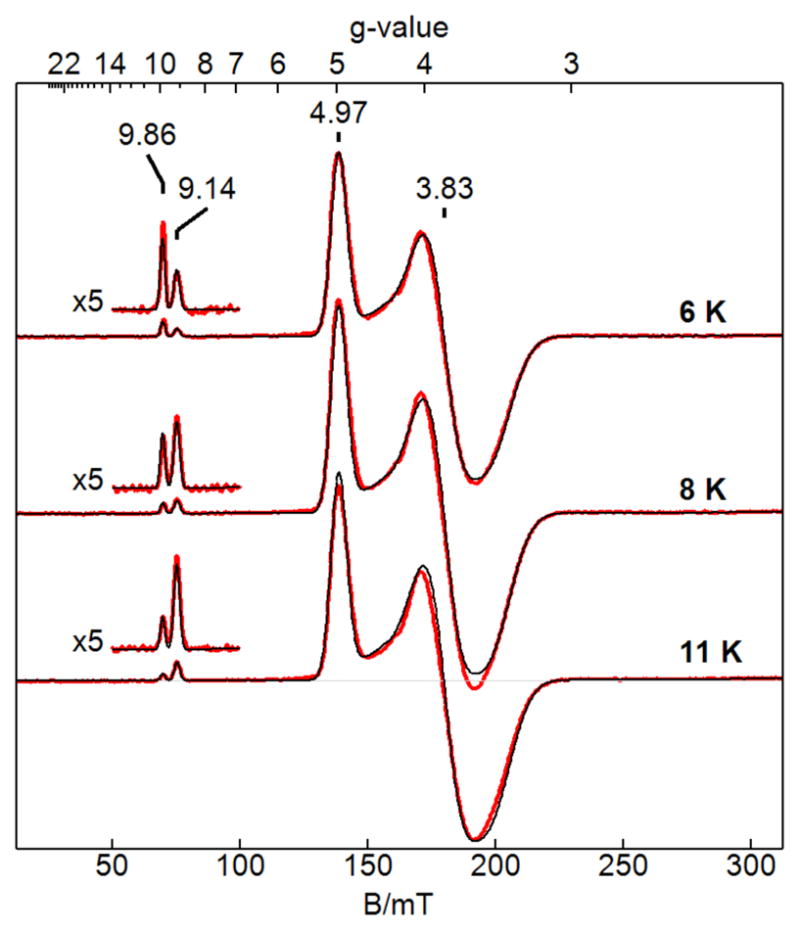
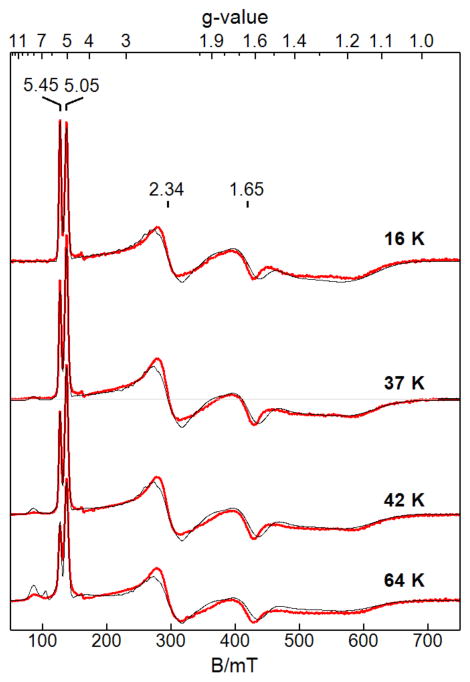
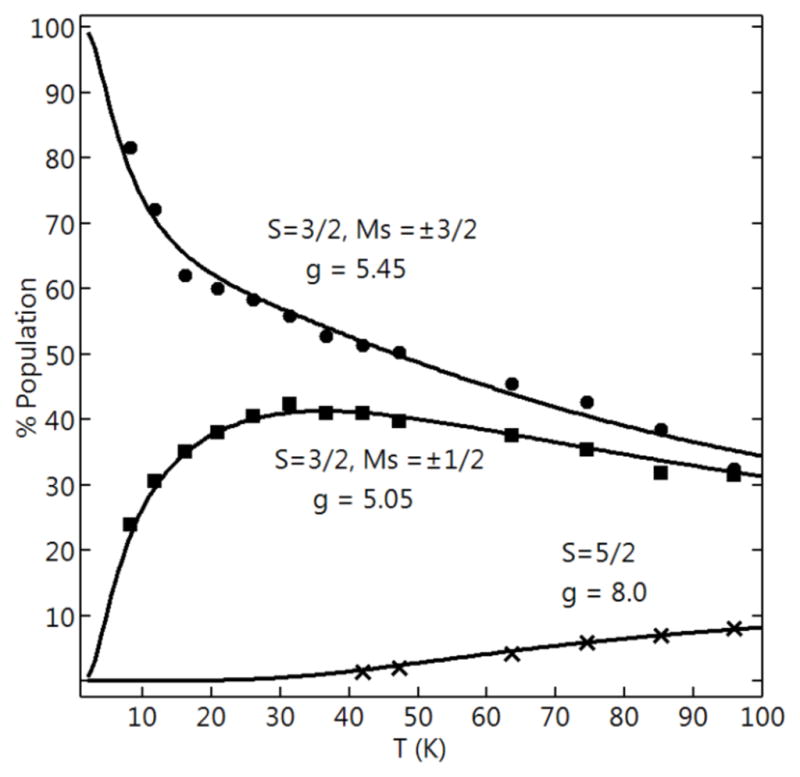
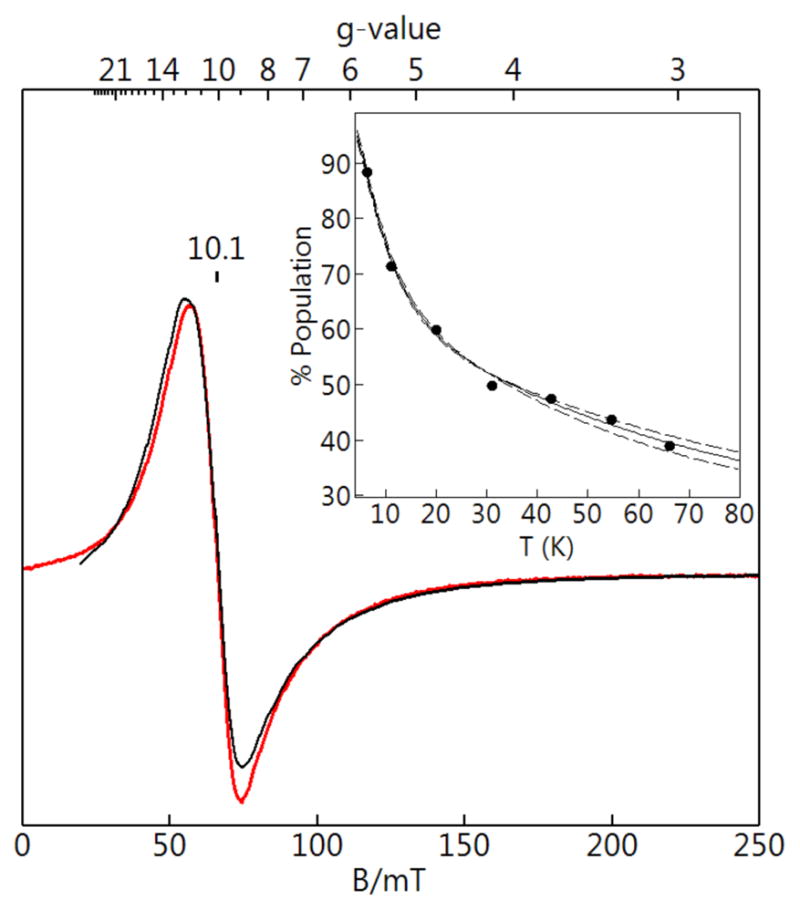
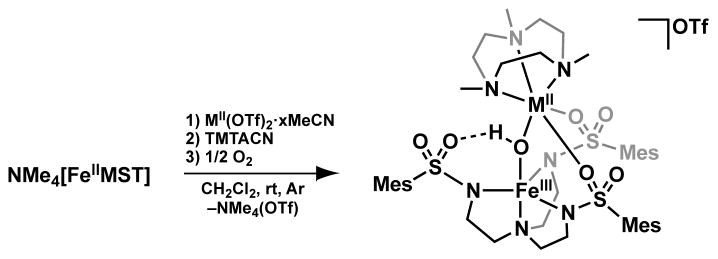
Bimetallic complexes are important sites in metalloproteins but are often difficult to prepare synthetically. We have previously introduced an approach to form discrete bimetallic complexes with MII-(μ-OH)-FeIII (MII = Mn, Fe) cores using the tripodal ligand N,N',N″-[2,2',2″-nitrilotris(ethane-2,1-diyl)]tris(2,4,6-trimethylbenzenesulfonamido) ([MST]3-). This series is extended to include the rest of the late 3d transition metal ions (MII = Co, Ni, Cu, Zn). All of the bimetallic complexes have similar spectroscopic and structural properties that reflect little change despite varying the MII centers. Magnetic studies performed on the complexes in solution using electron paramagnetic resonance spectroscopy showed that the observed spin states varied incrementally from S = 0 through S = 5/2; these results are consistent with antiferromagnetic coupling between the high-spin MII and FeIII centers. However, the difference in the MII ion occupancy yielded only slight changes in the magnetic exchange coupling strength, and all complexes had J values ranging from +26(4) to +35(3) cm-1.
Conflict of interest statement
The authors declare no competing financial interest.
Figures
Similar articles
-
Modular bimetallic complexes with a sulfonamido-based ligand.Dalton Trans. 2018 Sep 11;47(35):12362-12372. doi: 10.1039/c8dt02455c. Dalton Trans. 2018. PMID: 30118133 Free PMC article.
-
Unsymmetrical bimetallic complexes with M(II)-(μ-OH)-M(III) cores (M(II)M(III) = Fe(II)Fe(III), Mn(II)Fe(III), Mn(II)Mn(III)): structural, magnetic, and redox properties.Inorg Chem. 2013 Sep 16;52(18):10229-31. doi: 10.1021/ic401561k. Epub 2013 Aug 30. Inorg Chem. 2013. PMID: 23992041 Free PMC article.
-
Synthesis, crystal structures, and magnetic properties of a new family of heterometallic cyanide-bridged Fe(III)2M(II)2 (M=Mn, Ni, and Co) square complexes.Inorg Chem. 2011 Jul 4;50(13):6250-62. doi: 10.1021/ic200616p. Epub 2011 Jun 1. Inorg Chem. 2011. PMID: 21630643
-
Metal-complexes as ligands to generate asymmetric homo- and heterodinuclear M(A)(III)M(B)(II) species: a magneto-structural and spectroscopic comparison of imidazole-N versus pyridine-N.Inorg Chem. 2010 Jan 18;49(2):626-41. doi: 10.1021/ic9018426. Inorg Chem. 2010. PMID: 20000374
-
Unsymmetrical Fe(III)Co(II) and Ga(III)Co(II) complexes as chemical hydrolases: biomimetic models for purple acid phosphatases (PAPs).Inorg Chem. 2009 Aug 17;48(16):7905-21. doi: 10.1021/ic900831q. Inorg Chem. 2009. PMID: 19603814
Cited by
-
Accessing a synthetic FeIIIMnIV core to model biological heterobimetallic active sites.Chem Sci. 2023 Dec 27;15(8):2817-2826. doi: 10.1039/d3sc04900k. eCollection 2024 Feb 22. Chem Sci. 2023. PMID: 38404374 Free PMC article.
-
Modular bimetallic complexes with a sulfonamido-based ligand.Dalton Trans. 2018 Sep 11;47(35):12362-12372. doi: 10.1039/c8dt02455c. Dalton Trans. 2018. PMID: 30118133 Free PMC article.
-
Stepwise assembly of heterobimetallic complexes: synthesis, structure, and physical properties.Dalton Trans. 2021 Jun 15;50(23):8111-8119. doi: 10.1039/d1dt01021b. Dalton Trans. 2021. PMID: 34019606 Free PMC article.
-
Structures, Spectroscopic Properties, and Dioxygen Reactivity of 5- and 6-Coordinate Nonheme Iron(II) Complexes: A Combined Enzyme/Model Study of Thiol Dioxygenases.J Am Chem Soc. 2018 Nov 7;140(44):14807-14822. doi: 10.1021/jacs.8b08349. Epub 2018 Oct 22. J Am Chem Soc. 2018. PMID: 30346746 Free PMC article.
-
Synthesis of FeIII and FeIV Cyanide Complexes Using Hypervalent Iodine Reagents as Cyano-Transfer One-Electron Oxidants.Angew Chem Int Ed Engl. 2022 May 23;61(22):e202201699. doi: 10.1002/anie.202201699. Epub 2022 Mar 29. Angew Chem Int Ed Engl. 2022. PMID: 35285116 Free PMC article.
References
-
- Jiang W, Yun D, Saleh L, Barr E, Xing G, Hoffart LM, Maslak MA, Krebs C, Bollinger JM., Jr A manganese (IV)/iron (III) cofactor in Chlamydia trachomatis ribonucleotide reductase. Science. 2007;316:1188–1191. - PubMed
-
- Kurtz DM. Comprehensive Coordination Chemistry II. Elsevier; 2003. Dioxygen-binding Proteins; pp. 229–260.
-
- Fontecilla-Camps JC, Volbeda A. Encyclopedia of Metalloproteins. Springer; New York: 2013. pp. 1535–1544.
-
- Schenk G, Mitić N, Gahan LR, Ollis DL, McGeary RP, Guddat LW. Binuclear Metallohydrolases: Complex Mechanistic Strategies for a Simple Chemical Reaction. Acc Chem Res. 2012;45:1593–1603. - PubMed
-
- Diril H, Chang HR, Zhang X, Larsen SK, Potenza JA, Pierpont CG, Schugar HJ, Isied SS, Hendrickson DN. Binuclear Mixed-Valence MnIIMnIII Complexes: Insight About the Resolution of Hyperfine Structure in the EPR Spectrum. J Am Chem Soc. 1987;109:6207–6208.
Grants and funding
LinkOut - more resources
Full Text Sources
Other Literature Sources
Research Materials
