. 2018 Jan 1;27(1):160-177.
doi: 10.1093/hmg/ddx397.

In vitro and in vivo studies of the ALS-FTLD protein CHCHD10 reveal novel mitochondrial topology and protein interactions

Affiliations

In vitro and in vivo studies of the ALS-FTLD protein CHCHD10 reveal novel mitochondrial topology and protein interactions

S R Burstein et al. Hum Mol Genet. .

Abstract

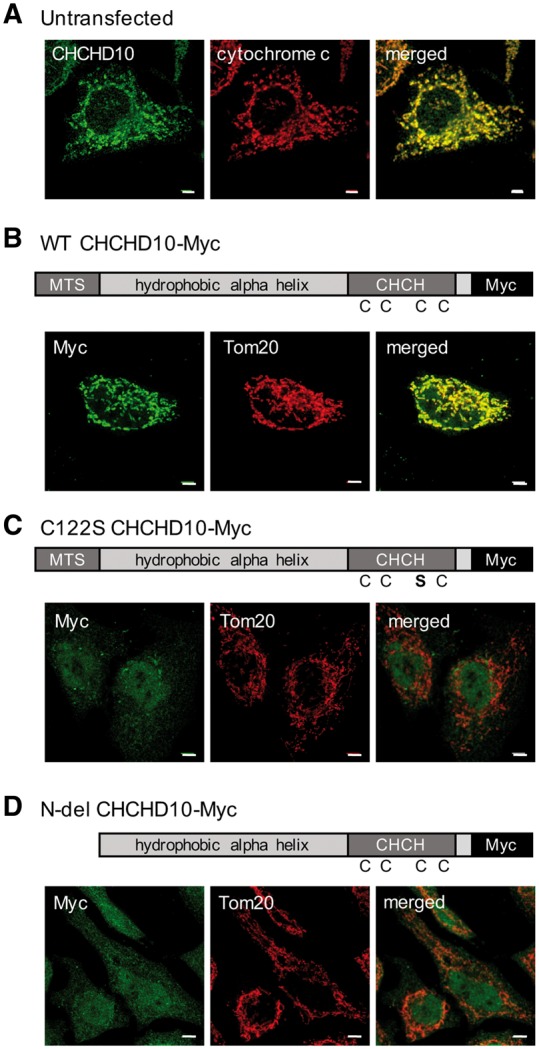
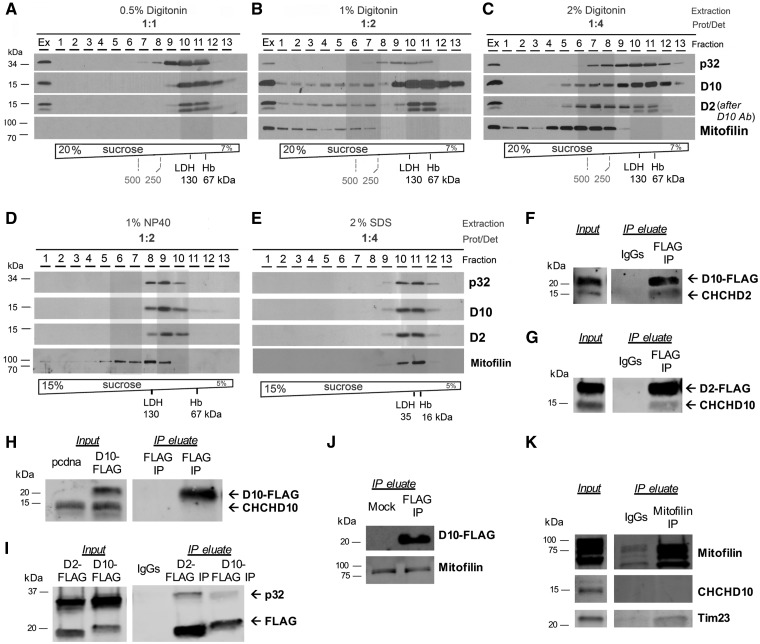
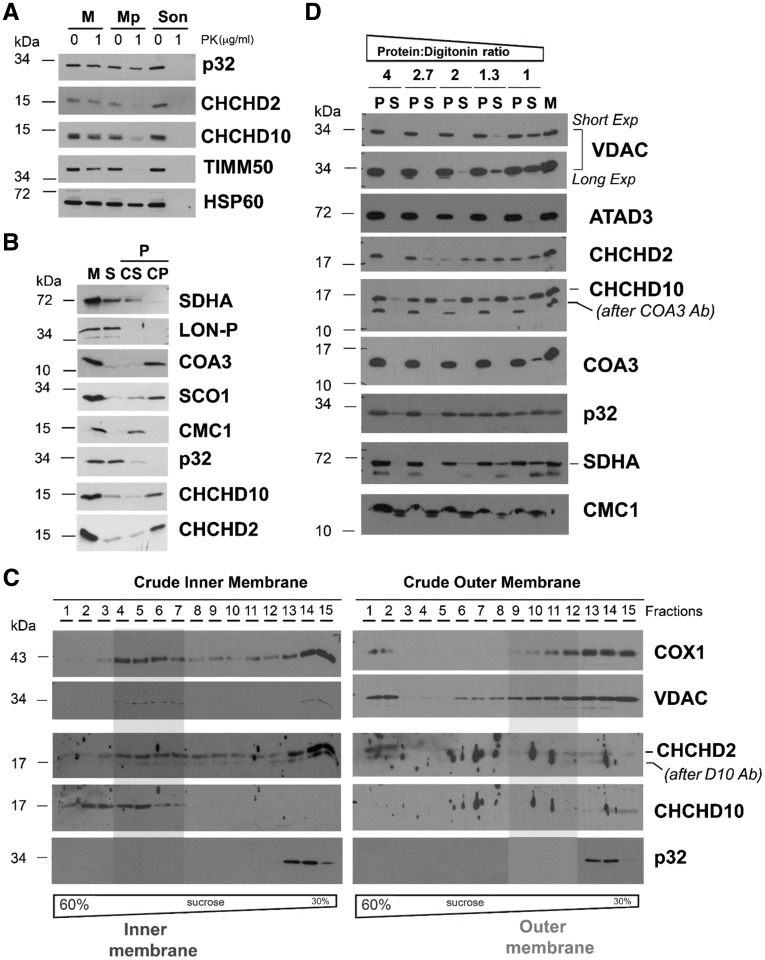
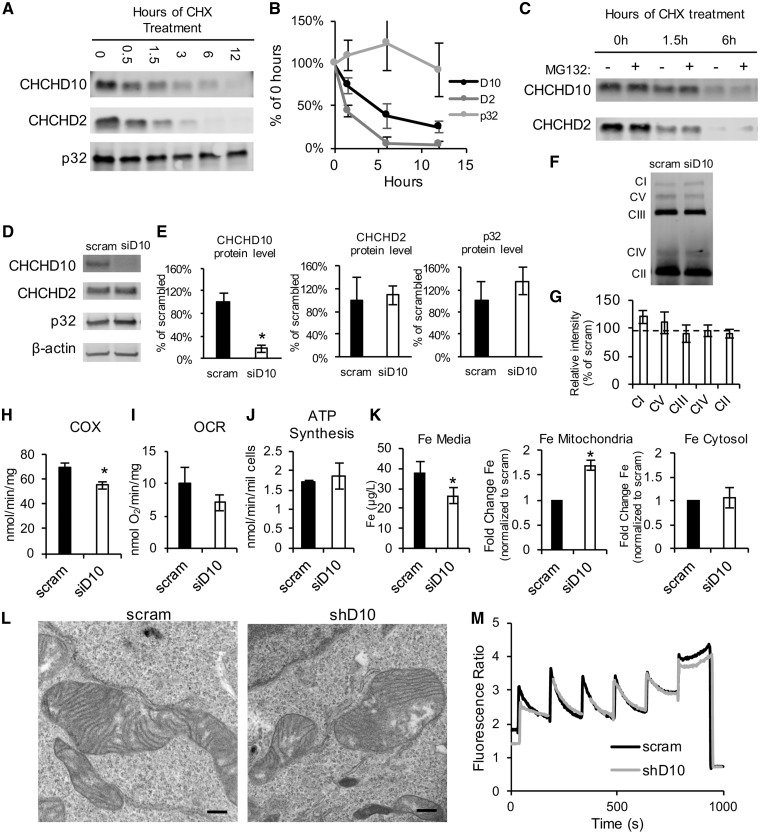
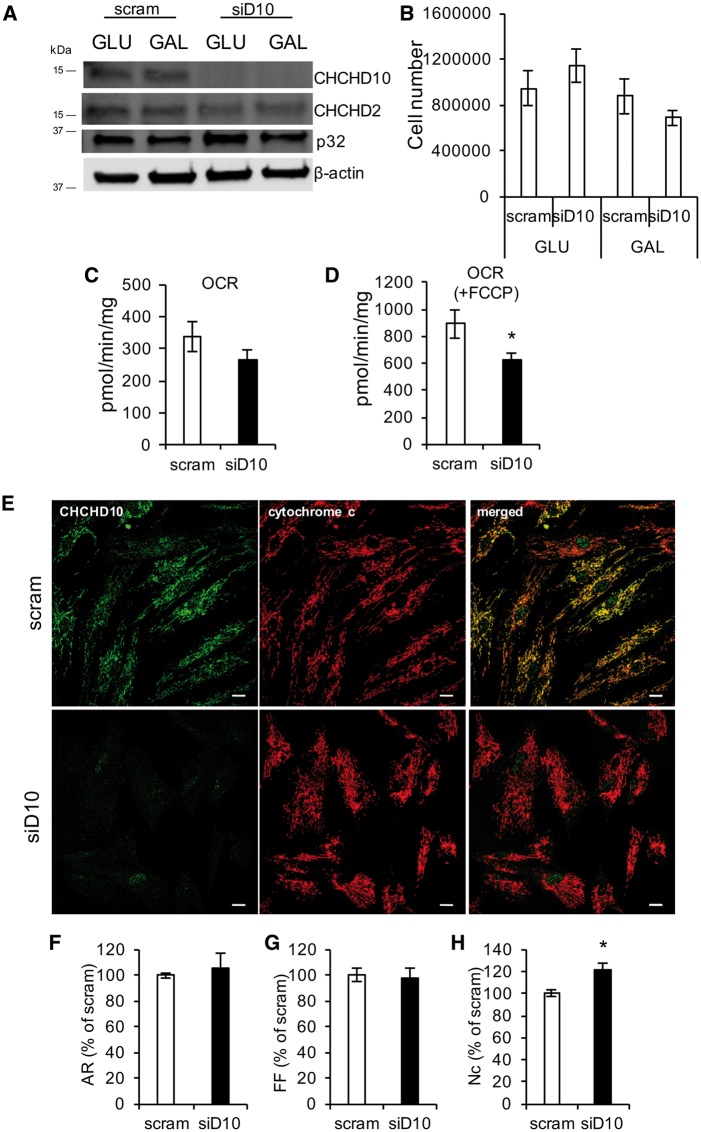
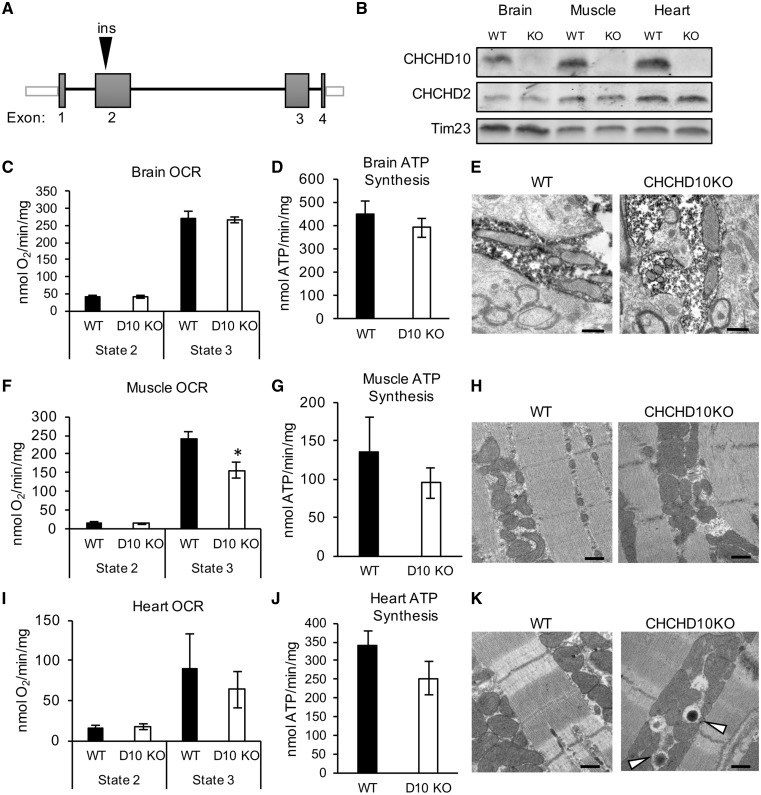
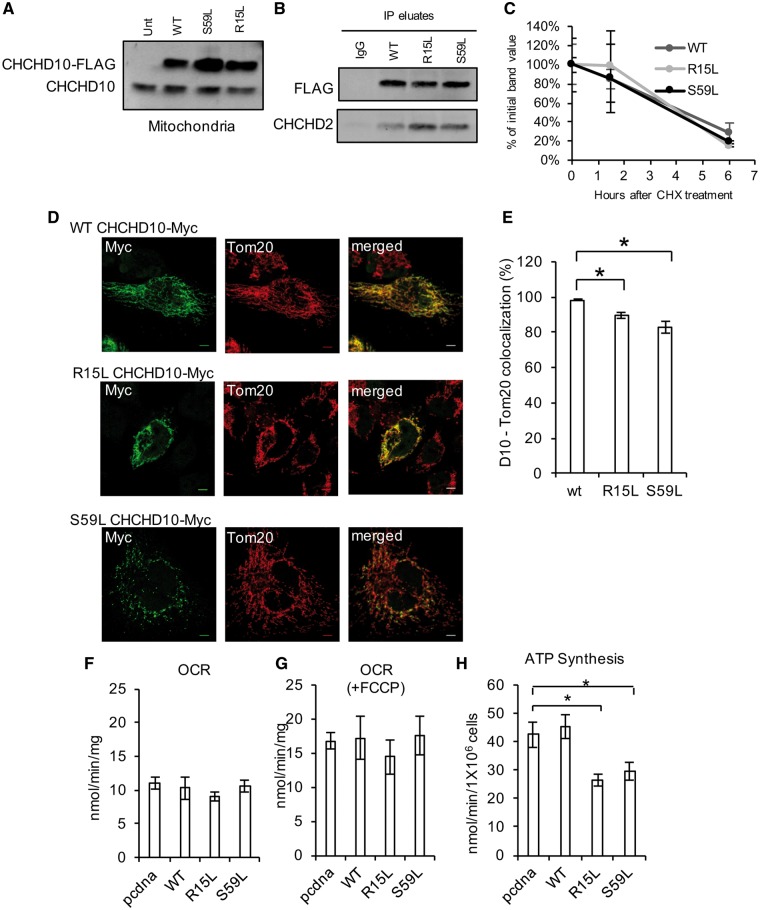
Mutations in coiled-coil-helix-coiled-coil-helix-domain containing 10 (CHCHD10), a mitochondrial twin CX9C protein whose function is still unknown, cause myopathy, motor neuron disease, frontotemporal dementia, and Parkinson's disease. Here, we investigate CHCHD10 topology and its protein interactome, as well as the effects of CHCHD10 depletion or expression of disease-associated mutations in wild-type cells. We find that CHCHD10 associates with membranes in the mitochondrial intermembrane space, where it interacts with a closely related protein, CHCHD2. Furthermore, both CHCHD10 and CHCHD2 interact with p32/GC1QR, a protein with various intra and extra-mitochondrial functions. CHCHD10 and CHCHD2 have short half-lives, suggesting regulatory rather than structural functions. Cell lines with CHCHD10 knockdown do not display bioenergetic defects, but, unexpectedly, accumulate excessive intramitochondrial iron. In mice, CHCHD10 is expressed in many tissues, most abundantly in heart, skeletal muscle, liver, and in specific CNS regions, notably the dopaminergic neurons of the substantia nigra and spinal cord neurons, which is consistent with the pathology associated with CHCHD10 mutations. Homozygote CHCHD10 knockout mice are viable, have no gross phenotypes, no bioenergetic defects or ultrastructural mitochondrial abnormalities in brain, heart or skeletal muscle, indicating that functional redundancy or compensatory mechanisms for CHCHD10 loss occur in vivo. Instead, cells expressing S59L or R15L mutant versions of CHCHD10, but not WT, have impaired mitochondrial energy metabolism. Taken together, the evidence obtained from our in vitro and in vivo studies suggest that CHCHD10 mutants cause disease through a gain of toxic function mechanism, rather than a loss of function.


Figures

Figure 1.
Figure 1.
CHCHD10 requires the twin CX9C domain and MTS to localize to mitochondria. (A) Immunocytochemistry of HeLa cells for CHCHD10 (green) and cytochrome c (red). (B) Immunocytochemistry of HeLa cells transfected with WT CHCHD10-Myc and immunostained for Myc (green) and Tom20 (red). (C) C122S CHCHD10-Myc transfected HeLa cells immunostained for Myc (green) and Tom20 (red) (D) N-del CHCHD10-Myc transfected HeLa cells immunostained for Myc (green) and Tom20 (red). Bar = 5 μm.
Figure 2.
Figure 2.
CHCHD10 interacts with CHCHD2 and p32. (A-E) Sucrose gradient sedimentation analyses of CHCHD10, CHCHD2, mitofilin and p32 in linear sucrose gradients, extracted from HEK293 mitochondria using the indicated extraction conditions. Hemoglobin (Hb) and lactate dehydrogenase (LDH) were used to calibrate the gradients. M, mitochondria; Ex, total mitochondrial extract. (F) FLAG Co-IP in mitochondria from CHCHD10-FLAG transfected cells. Immunoblot: FLAG and CHCHD2. (G) FLAG Co-IP in mitochondria from CHCHD2-FLAG transfected cells. Immunoblot: FLAG and CHCHD10. (H) FLAG Co-IP in mitochondria from mock (pcdna) or CHCHD10-FLAG transfected cells. Immunoblot: CHCHD10. (I) FLAG Co-IP using CHCHD2-FLAG or CHCHD10-FLAG transfected cells. Immunoblot: FLAG and p32. (J) FLAG Co-IP using CHCHD10-FLAG transfected cells. Immunoblot: FLAG, mitofilin. (K) Mitofilin Co-IP. Immunoblot: mitofilin, CHCHD10, Tim23.
Figure 3.
Figure 3.
Submitochondrial topology of CHCHD2 and CHCHD10. (A) Proteinase K protection assay in mitochondria (M) and mitoplasts (Mp) prepared by hypotonic swelling of mitochondria. As a control, a mitochondrial sample was sonicated (Son) to give full access to the protease. In this assay, the controls used were TIMM50 (inner transmembrane protein facing the intermembrane space) and HSP60 (matrix protein). (B) CHCHD2 (D2) and CHCHD10 (D10) solubilization by sonication and alkaline carbonate (pH 11.5) extraction. Mitochondria (M) isolated from HEK293 cells were sonicated, and the soluble (S), and membrane-bound fractions were separated by centrifugation. The pellet was subsequently extracted with alkaline sodium carbonate and fractionated into supernatant (CS) and pellet (CP). The different fractions were analysed by immunoblotting using antibodies that recognize CHCHD2, CHCHD10, p32, and the controls COA3 and SCO1 (membrane proteins), SDHA and CMC1 (loosely bound to IM), and LON-P (soluble protein) (C) Isolated mitochondria were fractionated into inner and outer membranes by sonication and centrifugation. The crude membrane fractions were analysed by sucrose gradient sedimentation in a linear 30–60% sucrose gradient. In each case, following ultracentrifugation, 15 gradient fractions were collected, separated by SDS-PAGE and analysed by immunoblotting using antibodies against VDAC (OM marker), COX1 (IM marker), CHCHD2 and CHCHD10. (D) Digitonin solubilization of mitochondria using increasing detergent: protein ratios. Following solubilization, soluble (S) and insoluble material (P) were separated by centrifugation and analysed by immunoblotting using the indicated antibodies.
Figure 4.
Figure 4.
CHCHD10 and CHCHD2 turnover rates and silencing. (A) Western blot using antibodies against CHCHD10, CHCHD2, p32 in homogenates from cells treated with cycloheximide (CHX) for the indicated number of hours. (B) Quantification of band intensity following CHX treatment. Data are expressed as percentage of the band intensity at 0 h for each protein. n = 3. (C) Western blot for CHX-treated cells for the indicated number of hours, with or without MG132 treatment. (DE) Western blot of cell homogenates following 48 h of treatment with scrambled (scram) siRNA or CHCHD10 siRNA. n = 5 *P < 0.05. (F-G) Representative blue native gel and quantification of OXPHOS complexes, in HEK293 cells after 72 h of treatment with scram or siD10 siRNA. The following antibodies were used to detect the OXPHOS complexes: Complex I-39 kDa, Complex V- subunit α, Complex III-core2, Complex IV-2, Complex II, 70 kDa. Data are represented as percentage of scram. n = 3. (H) Intact cell respiration in HEK293 cells treated with scram or CHCHD10 siRNA. n = 6. (I) COX activity in HEK293 cells treated with scram or CHCHD10 siRNA. n = 3. (J) ATP synthesis measured in HEK293 cells treated with scram or CHCHD10 siRNA. n = 3. (K) Iron levels measured by graphite furnace atomic absorption spectrometry in medium (n = 5) and mitochondrial or cytosolic fractions. In mitochondrial and cytosolic fractions (n = 4) iron levels are expressed as fold change relative to scram. (L) Representative electron micrographs of mitochondria from stable CHCHD10 knockdown or scram shRNA control HEK293 cell lines. Bar = 500 nm. (M) Traces of mitochondrial calcium uptake measurements using Fura-FF in HEK293 CHCHD10 knockdown or scram shRNA controls.
Figure 5.
Figure 5.
CHCHD10 silencing in human skin fibroblasts. (A) Western blot of human skin fibroblasts treated with scram or CHCHD10 siRNA and cultured in GLU or GAL-containing medium for 5 days. (B) Cell number after 5 days in GLU or GAL medium. n = 3. (C) Intact cell oxygen consumption rate (OCR). n = 6. (D) Uncoupled OCR following FCCP (1 μM) addition. n = 6; *P < 0.05. (E) Representative images of scram and siD10 human skin fibroblasts immunostained for CHCHD10 (green) and cytochrome c (red). Bar = 50 μm (FH). Aspect ratio (AR), form factor (FF), number of mitochondria per cell (Nc), expressed as percentage of scram. n = 30 cells for scrambled an n = 28 cells for CHCHD10 siRNA; *P < 0.05.
Figure 6.
Figure 6.
CHCHD10 expression in mouse tissues. (A) Representative Western blot using antibodies against CHCHD10, CHCHD2, and Tim23 (as mitochondrial loading control), in crude mitochondrial extracts prepared from WT mouse tissues. 50 μg of protein was loaded per sample. SC = spinal cord. (B) Input, flow through, and eluate fractions from CHCHD10, CHCHD2, and IgG control Co-IP in heart mitochondria. Immunoblot: CHCHD10, CHCHD2, p32, mitofilin. (C) CHCHD10 immunoreactivity in brain section containing substantia nigra (SN) region from WT mouse. PAG = periaqueductal gray, IPN = interpeduncular nucleus. Left panel: bar = 50 μm. Right panel: bar = 10 μm. (DE) Immunohistochemistry of brain sections stained with CHCHD10 and TH antibodies. Bar = 100 µm in D, bar = 10 µm in E. (FG). Immunohistochemistry of spinal cord sections stained with CHCHD10 and ChAT antibodies. Ba r = 100 µm in F, bar = 30 µm in G.
Figure 7.
Figure 7.
Brain, skeletal muscle and heart mitochondrial bioenergetics and ultrastructure in CHCHD10KO mice. (A) Schematic representation of the strategy utilized to knock down CHCHD10 expression in the CHCHD10KO mouse. (B) Representative Western blot of brain, skeletal muscle (gastrocnemius) and heart homogenates from WT and CHCHD10KO (KO) mice at 100 days of age. 100 μg protein was loaded per lane and the membrane was probed with antibodies against CHCHD10, CHCHD2 and Tim23 (mitochondrial loading control). (C) Oxygen consumption rates in WT and CHCHD10KO brain mitochondria before (State 2) and after (State 3) ADP stimulation. n = 3. (D) ATP synthesis rate in WT and CHCDH10KO brain mitochondria. n = 3. (E) Representative electron micrographs of WT and CHCHD10KO substantia nigra. Peroxidase labeling indicates TH-immunoreactive dendrites. Bar = 500 nm. (F) Oxygen consumption rate of WT and CHCHD10KO in skeletal muscle mitochondria. n = 7; *P < 0.05, (G) ATP synthesis rate in WT and CHCDH10KO skeletal muscle mitochondria. n = 7. (H) Representative electron micrograph of WT and CHCHD10KO skeletal muscle (soleus). (I) Oxygen consumption rate in WT and CHCHD10KO heart mitochondria. n = 4. (J) ATP synthesis rate in WT and CHCDH10KO heart mitochondria. n = 4. (K) Representative electron micrograph of WT and CHCHD10KO heart right ventricle wall. Arrowheads indicate electron-dense structures present in CHCHD10KO but not in WT. m = mitochondria. Bar = 500 nm.
Figure 8.
Figure 8.
Mutant CHCHD10 overexpression in HEK293 cells. (A) Western blot of crude mitochondrial fractions from control HEK293 cells and cells transfected with WT CHCHD10-FLAG, R15L CHCHD10-FLAG or S59L CHCHD10-FLAG. (B) Co-IP of WT, R15L or S59L CHCHD10-FLAG with FLAG antibody or IgG control. Immunoblot: FLAG, CHCHD2. (C) Quantification of Western blot band intensity following CHX treatment. Data are expressed as percentage of the FLAG intensity at 0 h. n = 4. (D) Representative images of HeLa cells transfected with WT CHCHD10-Myc, R15L CHCHD10-Myc or S59L CHCHD10-Myc and immunostained for Myc (green) or Tom20 (red). Bar = 5 μm. (E) CHCHD10 and Tom20 percentage of colocalization n = 15 cells for WT CHCHD10-Myc, n = 22 cells for R15L CHCHD10-Myc, n = 25 cells for S59L CHCHD10-Myc. (F–G) Oxygen consumption rate (OCR) in cells transfected with empty vector (pcdna) or CHCHD10-FLAG, before or after FCCP treatment (1 μM). n = 3. (H) ATP synthesis in cells transfected with empty vector (pcdna) or CHCHD10-FLAG. n = 3 to 5.
Figure 9.
Figure 9.
Proposed models of protein-protein interactions in the mitochondrial IM. (A) Kyte and Doolitle hydrophobicity plot of D2 and D10 obtained with the ProtScale server (58). (B) Structure of D2 and D10 modeled with RaptorX structure prediction server (59). The putative transmembrane helices were predicted using the TMPred server (60). The cysteine residues forming the twin CX9C motifs in CHCHD2 and CHCHD10 are indicated. (C) Hypothetical models of the interaction of CHCHD2 and CHCHD10 with the IM. The schematic incorporates a simulation of the interaction between D2 (green) and D10 (blue) obtained with GRAMMX (Vakser.compbio.ku.edu) and the structure of p32 (PDB # 1P32) from Jiang et al. (40).

References

    1. Bannwarth S., Ait-El-Mkadem S., Chaussenot A., Genin E.C., Lacas-Gervais S., Fragaki K., Berg-Alonso L., Kageyama Y., Serre V., Moore D.G. (2014) A mitochondrial origin for frontotemporal dementia and amyotrophic lateral sclerosis through CHCHD10 involvement. Brain, 137, 2329–2345. - PMC - PubMed
    1. Johnson J.O., Glynn S.M., Gibbs J.R., Nalls M.A., Sabatelli M., Restagno G., Drory V.E., Chio A., Rogaeva E., Traynor B.J. (2014) Mutations in the CHCHD10 gene are a common cause of familial amyotrophic lateral sclerosis. Brain, 137, e311.. - PMC - PubMed
    1. Perrone F., Nguyen H.P., Van Mossevelde S., Moisse M., Sieben A., Santens P., De Bleecker J., Vandenbulcke M., Engelborghs S., Baets J.. et al. (2017) Investigating the role of ALS genes CHCHD10 and TUBA4A in Belgian FTD-ALS spectrum patients. Neurobiol. Aging, 51, 177 e179–177 e116. - PubMed
    1. Dols-Icardo O., Nebot I., Gorostidi A., Ortega-Cubero S., Hernandez I., Rojas-Garcia R., Garcia-Redondo A., Povedano M., Llado A., Alvarez V.. et al. (2015) Analysis of the CHCHD10 gene in patients with frontotemporal dementia and amyotrophic lateral sclerosis from Spain. Brain, 138, e400.. - PubMed
    1. Zhang M., Xi Z., Zinman L., Bruni A.C., Maletta R.G., Curcio S.A., Rainero I., Rubino E., Pinessi L., Nacmias B.. et al. (2015) Mutation analysis of CHCHD10 in different neurodegenerative diseases. Brain, 138, e380.. - PMC - PubMed

Publication types

MeSH terms