. 2018 Jan 4;217(2):245-256.
doi: 10.1093/infdis/jix571.

Severe Influenza Is Characterized by Prolonged Immune Activation: Results From the SHIVERS Cohort Study

Collaborators, Affiliations

Severe Influenza Is Characterized by Prolonged Immune Activation: Results From the SHIVERS Cohort Study

Sook-San Wong et al. J Infect Dis. .

Abstract

Background: The immunologic factors underlying severe influenza are poorly understood. To address this, we compared the immune responses of influenza-confirmed hospitalized individuals with severe acute respiratory illness (SARI) to those of nonhospitalized individuals with influenza-like illness (ILI).

Methods: Peripheral blood lymphocytes were collected from 27 patients with ILI and 27 with SARI, at time of enrollment and then 2 weeks later. Innate and adaptive cellular immune responses were assessed by flow cytometry, and serum cytokine levels were assessed by a bead-based assay.

Results: During the acute phase, SARI was associated with significantly reduced numbers of circulating myeloid dendritic cells, CD192+ monocytes, and influenza virus-specific CD8+ and CD4+ T cells as compared to ILI. By the convalescent phase, however, most SARI cases displayed continued immune activation characterized by increased numbers of CD16+ monocytes and proliferating, and influenza virus-specific, CD8+ T cells as compared to ILI cases. SARI was also associated with reduced amounts of cytokines that regulate T-cell responses (ie, interleukin 4, interleukin 13, interleukin 12, interleukin 10, and tumor necrosis factor β) and hematopoiesis (interleukin 3 and granulocyte-macrophage colony-stimulating factor) but increased amounts of a proinflammatory cytokine (tumor necrosis factor α), chemotactic cytokines (MDC, MCP-1, GRO, and fractalkine), and growth-promoting cytokines (PDGFBB/AA, VEGF, and EGF) as compared to ILI.

Conclusions: Severe influenza cases showed a delay in the peripheral immune activation that likely led prolonged inflammation, compared with mild influenza cases.

Keywords: Influenza; cellular immunity; cytokine; disease severity; infection.


Conflict of interest statement

Potential conflicts of interest. All authors: No reported conflicts of interest. All authors have submitted the ICMJE Form for Disclosure of Potential Conflicts of Interest. Conflicts that the editors consider relevant to the content of the manuscript have been disclosed.

Figures

Figure 1.
Figure 1.
Differences in the myeloid dendritic cell (mDC) (CD14CD11+) population in ILI (black) and severe acute respiratory illness (SARI; red) influenza cases during the acute and convalescent phase. Percentages and absolute cell counts of mDCs in patients with ILI and SARI during the acute (A and B) and convalescent (C and D) phases of disease. *P < .05.
Figure 2.
Figure 2.
Differences in the monocyte subpopulations in influenza-like illness (ILI; black) and severe acute respiratory illness (SARI; red) influenza cases during the acute and convalescent phases of disease. Monocyte populations are identified on the basis of the relative expression level of the markers CD14 and CD16 as CD14++/CD16 (classical), CD14++/CD16+ (inflammatory), and CD14lo/CD16+ (patrolling) monocytes. A, Percentages of each monocyte subpopulation (per the total monocyte population) during the acute and convalescent phases. B, Percentages of CD192+ cells in the total monocyte population during the acute and convalescent phases. C, Percentages of CD192+ cells per monocyte subpopulation in ILI and SARI during the acute and convalescent phases. Lines represent medians, and error bars represent interquartile ranges. D, Change in percentages of CD192+ monocytes in each subpopulation between acute and convalescent samples. Values were obtained by subtracting acute values from the convalescent value. *P < .05; NS, not statistically significant.
Figure 3.
Figure 3.
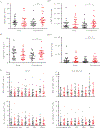
Differences in the adaptive immunity in influenza-like illness (ILI; black) and severe acute respiratory illness (SARI; red) influenza cases. A and B, Percentages and absolute cell counts of CD3+CD8+ (A) and CD3+CD4+ (B) T cells during the acute and convalescent phases. C and D, Interferon γ (IFN-γ)–expressing CD8+ (C) and CD4+ (D) T cells, expressed as percentage of gated lymphocytes, and absolute cell counts detected in each stimulation condition (unstimulated, matrix 1 protein [M1], nucleoprotein [NP], polymerase basic 1 protein [PB1], and phytohemagglutinin [PHA]; without baseline subtracted). E and F, Total influenza virus–specific IFN-γ–expressing CD8+ (E) and CD4+ (F) T-cell responses after peptide (M1, NP, and PB1) stimulation (with the baseline value subtracted). Data are expressed as medians, and error bars represent interquartile ranges. *P < .05, **P < .01.
Figure 3.
Figure 3.
Differences in the adaptive immunity in influenza-like illness (ILI; black) and severe acute respiratory illness (SARI; red) influenza cases. A and B, Percentages and absolute cell counts of CD3+CD8+ (A) and CD3+CD4+ (B) T cells during the acute and convalescent phases. C and D, Interferon γ (IFN-γ)–expressing CD8+ (C) and CD4+ (D) T cells, expressed as percentage of gated lymphocytes, and absolute cell counts detected in each stimulation condition (unstimulated, matrix 1 protein [M1], nucleoprotein [NP], polymerase basic 1 protein [PB1], and phytohemagglutinin [PHA]; without baseline subtracted). E and F, Total influenza virus–specific IFN-γ–expressing CD8+ (E) and CD4+ (F) T-cell responses after peptide (M1, NP, and PB1) stimulation (with the baseline value subtracted). Data are expressed as medians, and error bars represent interquartile ranges. *P < .05, **P < .01.
Figure 4.
Figure 4.
Differences in the proliferating and activated, effector T cells and in influenza-like illness (ILI; black) and severe acute respiratory illness (SARI; red) influenza cases. A, Representative flow plots depicting the gating strategy for identification of Ki67+Bcl2 proliferating (top left) and CD38+ activated, effector (top right) populations. B and C, Percentages of proliferating (Ki67+Bcl2) CD4+ or CD8+ T cells (B) and percentages of effector (CD38+) CD4+ or CD8+ T cells (C) during the acute and convalescent phases of disease. Lines represent medians, and error bars represent interquartile ranges. *P < .05.

References

    1. Thompson WW, Shay DK, Weintraub E, et al. Influenza-associated hospitalizations in the United States. JAMA 2004; 292:1333–40. - PubMed
    1. Valkenburg SA, Josephs TM, Clemens EB, et al. Molecular basis for universal HLA-A*0201-restricted CD8+ T-cell immunity against influenza viruses. Proc Natl Acad Sci U S A 2016; 113:4440–5. - PMC - PubMed
    1. Chiu C, Openshaw PJ. Antiviral B cell and T cell immunity in the lungs. Nat Immunol 2015; 16:18–26. - PMC - PubMed
    1. Fox A, Le NM, Horby P, et al. Severe pandemic H1N1 2009 infection is associated with transient NK and T deficiency and aberrant CD8 responses. PLoS One 2012; 7:e31535. - PMC - PubMed
    1. Wilk E, Pandey AK, Leist SR, et al. RNAseq expression analysis of resistant and susceptible mice after influenza A virus infection identifies novel genes associated with virus replication and important for host resistance to infection. BMC Genomics 2015; 16:655. - PMC - PubMed

Publication types