

Biomechanical changes during abdominal aortic aneurysm growth
- PMID: 29112945
- PMCID: PMC5675455
- DOI: 10.1371/journal.pone.0187421
Biomechanical changes during abdominal aortic aneurysm growth
Abstract
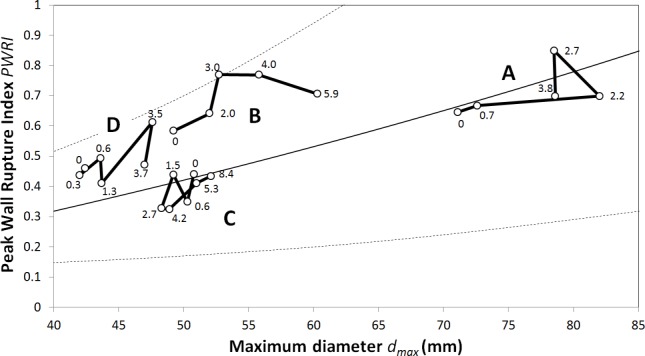
The biomechanics-based Abdominal Aortic Aneurysm (AAA) rupture risk assessment has gained considerable scientific and clinical momentum. However, such studies have mainly focused on information at a single time point, and little is known about how AAA properties change over time. Consequently, the present study explored how geometry, wall stress-related and blood flow-related biomechanical properties change during AAA expansion. Four patients with a total of 23 Computed Tomography-Angiography (CT-A) scans at different time points were analyzed. At each time point, patient-specific properties were extracted from (i) the reconstructed geometry, (ii) the computed wall stress at Mean Arterial Pressure (MAP), and (iii) the computed blood flow velocity at standardized inflow and outflow conditions. Testing correlations between these parameters identified several nonintuitive dependencies. Most interestingly, the Peak Wall Rupture Index (PWRI) and the maximum Wall Shear Stress (WSS) independently predicted AAA volume growth. Similarly, Intra-luminal Thrombus (ILT) volume growth depended on both the maximum WSS and the ILT volume itself. In addition, ILT volume, ILT volume growth, and maximum ILT layer thickness correlated with PWRI as well as AAA volume growth. Consequently, a large ILT volume as well as fast increase of ILT volume over time may be a risk factor for AAA rupture. However, tailored clinical studies would be required to test this hypothesis and to clarify whether monitoring ILT development has any clinical benefit.
Conflict of interest statement
Figures


References
-
- Choke E, Cockerill G, Wilson WRW, Sayed S, Dawson J, Loftus I, et al. A review of biological factors implicated in abdominal aortic aneurysm rupture. Eur J Vasc Endovasc Surg. 2005;30: 227–244. doi: 10.1016/j.ejvs.2005.03.009 - DOI - PubMed
-
- UK Small Aneurysm Trial Participants. Mortality results for randomised controlled trial of early elective surgery or ultrasonographic surveillance for small abdominal aortic aneurysms. Lancet. 1998;352: 1649–55. doi: 10.1016/S0140-6736(98)10137-X - DOI - PubMed
-
- Greenhalgh Roger M., Powell Janet T. Endovascular repair of abdominal aortic aneurysm. N Engl J Med. 2010;363: 1480–1482. doi: 10.1002/14651858.CD004178.pub2 - DOI - PubMed
-
- Wanhainen A, Mani K, Golledge J. Surrogate Markers of Abdominal Aortic Aneurysm Progression. Arter Thromb Vasc Biol. 2016;36: 236–244. doi: 10.1161/ATVBAHA.115.306538 - DOI - PubMed
-
- Brown LC, Powell JT. Risk factors for aneurysm rupture in patients kept under ultrasound surveillance. UK Small Aneurysm Trial Participants. Ann Surg. 1999;230: 287–289. doi: 10.1097/00000658-199909000-00002 - DOI - PMC - PubMed
MeSH terms
LinkOut - more resources
Full Text Sources
Other Literature Sources
Research Materials
