. 2017 Nov 6;9(11):1220.
doi: 10.3390/nu9111220.

Nonalcoholic Fatty Liver Disease Is Exacerbated in High-Fat Diet-Fed Gnotobiotic Mice by Colonization with the Gut Microbiota from Patients with Nonalcoholic Steatohepatitis

Affiliations

Nonalcoholic Fatty Liver Disease Is Exacerbated in High-Fat Diet-Fed Gnotobiotic Mice by Colonization with the Gut Microbiota from Patients with Nonalcoholic Steatohepatitis

Chien-Chao Chiu et al. Nutrients. .

Abstract

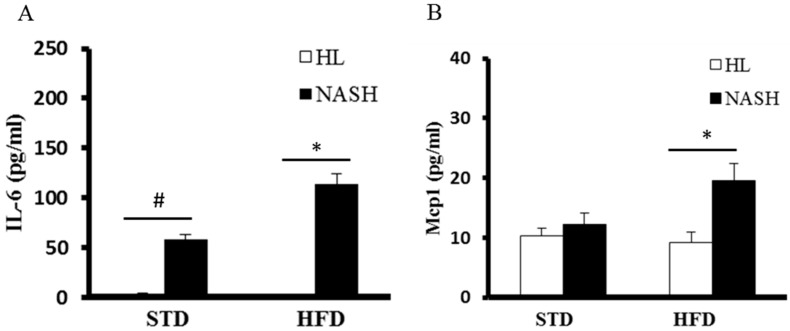
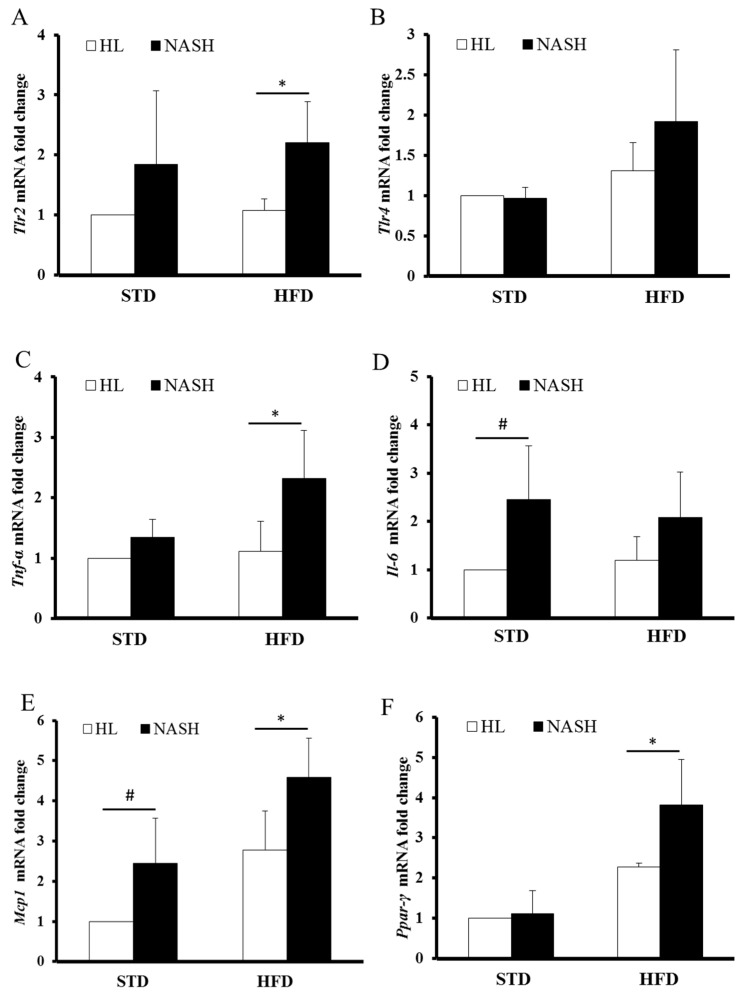
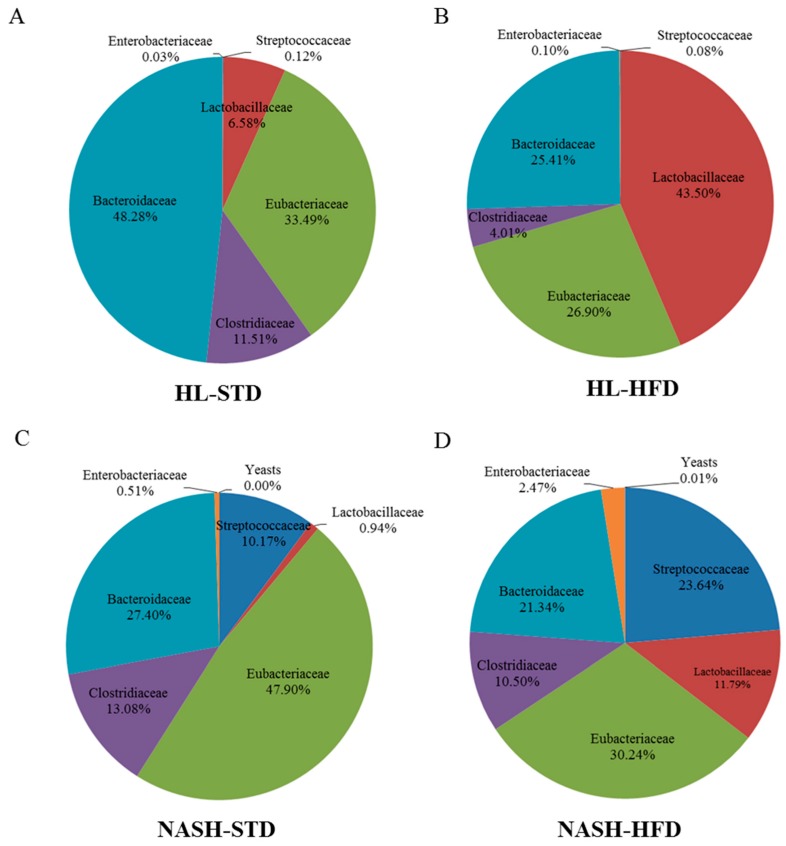
Nonalcoholic fatty liver disease (NAFLD) is a serious liver disorder associated with the accumulation of fat and inflammation. The objective of this study was to determine the gut microbiota composition that might influence the progression of NAFLD. Germ-free mice were inoculated with feces from patients with nonalcoholic steatohepatitis (NASH) or from healthy persons (HL) and then fed a standard diet (STD) or high-fat diet (HFD). We found that the epididymal fat weight, hepatic steatosis, multifocal necrosis, and inflammatory cell infiltration significantly increased in the NASH-HFD group. These findings were consistent with markedly elevated serum levels of alanine transaminase, aspartate transaminase, endotoxin, interleukin 6 (IL-6), monocyte chemotactic protein 1 (Mcp1), and hepatic triglycerides. In addition, the mRNA expression levels of Toll-like receptor 2 (Tlr2), Toll-like receptor 4 (Tlr4), tumor necrosis factor alpha (Tnf-α), Mcp1, and peroxisome proliferator-activated receptor gamma (Ppar-γ) significantly increased. Only abundant lipid accumulation and a few inflammatory reactions were observed in group HL-HFD. Relative abundance of Bacteroidetes and Firmicutes shifted in the HFD-fed mice. Furthermore, the relative abundance of Streptococcaceae was the highest in group NASH-HFD. Nevertheless, obesity-related Lactobacillaceae were significantly upregulated in HL-HFD mice. Our results revealed that the gut microbiota from NASH Patients aggravated hepatic steatosis and inflammation. These findings might partially explain the NAFLD progress distinctly was related to different compositions of gut microbiota.

Keywords: gut microbiota; high-fat diet; humanized gnotobiotic mice; nonalcoholic fatty liver disease.


Conflict of interest statement

The authors declare that they have no conflicts of interest.

Figures

Figure 1
Figure 1
Concentration of hepatic triglycerides (TGs) in different groups. The hepatic TG level of the “inoculation with bacteria from nonalcoholic steatohepatitis patients and standard diet” (NASH-STD) group was 4.6-fold higher than that of the “inoculation with bacteria from healthy humans and standard diet” HL-STD group; hepatic TG levels in the NASH-high fat diet (HFD) group were 1.5-fold higher than those of the HL-HFD group. Data are presented as mean ± SD. HL: healthy humans; NASH: NASH patients; STD: standard diet; HFD: high-fat diet; TG: triglycerides; # p < 0.05 compared with STD-fed HL group; * p < 0.05 compared with HFD-fed HL group.
Figure 2
Figure 2
Histological evaluation of hepatic steatosis and necrosis and effects of the gut microbiota on hepatic lipid accumulation: (A) no significant alteration of the liver was seen in the HL-STD group; (B) only mild steatosis and moderate necrosis were observed in the NASH-STD group; (C) mild to moderate steatosis was seen in the HL-HFD group; (D) severe steatosis and multifocal necrosis were detected in the NASH-HFD group; (E) very few lipid droplets in the HL-STD group; (F) the modest amounts of lipid droplets in the NASH-STD group; (G) the mild to moderate amounts of lipid droplets in the HL-HFD group; (H) the abundant lipid droplets in the NASH-HFD group; (I) determination of histological steatosis scores; and (J) determination of histological necrosis scores. HL: healthy humans; NASH: NASH patients; STD: standard diet; HFD: high-fat diet. Hematoxylin and eosin (H&E) and Oil Red O staining (200×); # p < 0.05 compared with the STD-fed HL group; * p < 0.05 compared with the HFD-fed HL group.
Figure 3
Figure 3
Serum concentrations of IL-6 and Mcp1 in HL and NASH groups of mice fed STD or HFD for 16 weeks: (A) serum IL-6 level; and (B) serum Mcp1 level. Data are presented as mean ± standard deviation (SD). HL: healthy humans; NASH: NASH patients; STD: standard diet; HFD: high-fat diet; IL-6: interleukin-6; Mcp1: monocyte chemoattractant protein 1; # p < 0.05 compared with the STD-fed HL group; * p < 0.05 compared with the HFD-fed HL group.
Figure 4
Figure 4
Serum concentrations of endotoxin in HL and NASH mice fed STD or HFD for 16 weeks. Data are presented as mean ± standard deviation (SD). HL: healthy humans; NASH: NASH patients; STD: standard diet; HFD: high-fat diet. # p < 0.05 compared with the STD-fed HL group; * p < 0.05 compared with the HFD-fed HL group.
Figure 5
Figure 5
The gene expression levels of liver tissue in the HL and NASH mice fed STD or HFD; (A) Tlr2 gene expression; (B) Tlr4 gene expression; (C) Tnf-α gene expression; (D) IL-6 gene expression; (E) Mcp1 gene expression; and (F) Ppar-γ gene expression. Data are presented as mean ± standard deviation (SD). HL: healthy humans; NASH: NASH patients; STD: standard diet; HFD: high-fat diet; Tlr2: Toll-like receptor 2; Tlr4: Toll-like receptor 4; Tnf-α: tumor necrosis factor α; Mcp1: monocyte chemoattractant protein 1; Ppar-γ: peroxisome proliferator-activated receptor-γ. # p < 0.05 compared with the STD-fed HL group; * p < 0.05 compared with the HFD-fed HL group.
Figure 6
Figure 6
Family distribution of the gut microbiota of HL and NASH mice fed STD or HFD: (A) HL-STD, mice fed STD for 16 weeks; (B) HL-HFD, mice fed HFD for 16 weeks (C) NASH-STD, mice fed STD for 16 weeks; and (D) NASH-HFD, mice fed HFD for 16 weeks, (n = 3, respectively). HL: healthy humans; NASH: NASH patients; STD: standard diet; HFD: high-fat diet.

References

    1. Adams L.A., Lymp J.F., St. Sauver J., Sanderson S.O., Lindor K.D., Feldstein A., Angulo P. The natural history of nonalcoholic fatty liver disease: A population-based cohort study. Gastroenterology. 2005;129:113–121. - PubMed
    1. Henao-Mejia J., Elinav E., Jin C., Hao L., Mehal W.Z., Strowig T., Thaiss C.A., Kau A.L., Eisenbarth S.C., Jurczak M.J., et al. Inflammasome-mediated dysbiosis regulates progression of NAFLD and obesity. Nature. 2012;482:179–185. doi: 10.1038/nature10809. - DOI - PMC - PubMed
    1. Toshikuni N., Tsutsumi M., Arisawa T. Clinical differences between alcoholic liver disease and nonalcoholic fatty liver disease. World J. Gastroenterol. 2014;20:8393–8406. - PMC - PubMed
    1. Liang W., Menke A.L., Driessen A., Koek G.H., Lindeman J.H., Stoop R., Havekes L.M., Kleemann R., van den Hoek A.M. Establishment of a general NAFLD scoring system for rodent models and comparison to human liver pathology. PLoS ONE. 2014;9:e115922. doi: 10.1371/journal.pone.0115922. - DOI - PMC - PubMed
    1. Ganz M., Bukong T.N., Csak T., Saha B., Park J.K., Ambade A., Kodys K., Szabo G. Progression of non-alcoholic steatosis to steatohepatitis and fibrosis parallels cumulative accumulation of danger signals that promote inflammation and liver tumors in a high fat-cholesterol-sugar diet model in mice. J. Transl. Med. 2015;13:193. doi: 10.1186/s12967-015-0552-7. - DOI - PMC - PubMed