

Inference of time-delayed gene regulatory networks based on dynamic Bayesian network hybrid learning method
- PMID: 29113310
- PMCID: PMC5655205
- DOI: 10.18632/oncotarget.21268
Inference of time-delayed gene regulatory networks based on dynamic Bayesian network hybrid learning method
Abstract
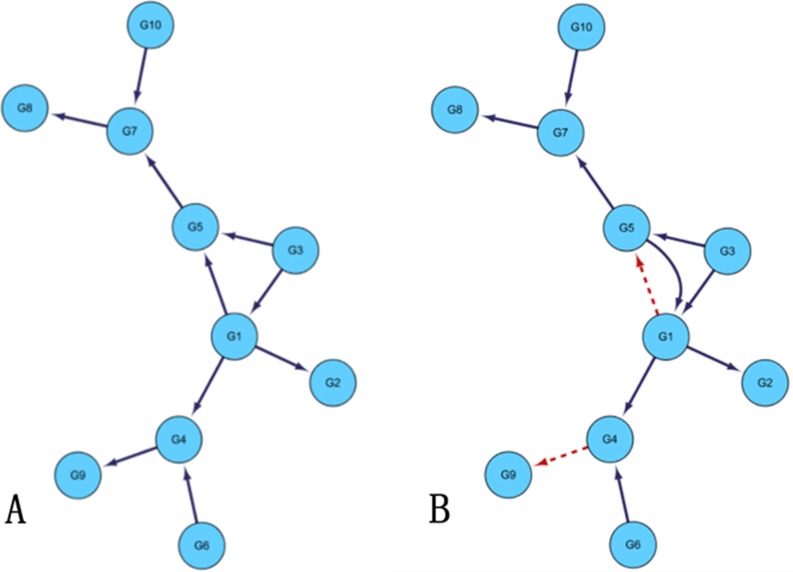
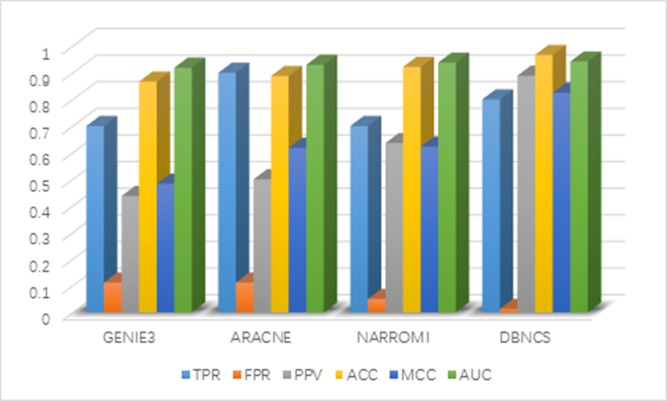
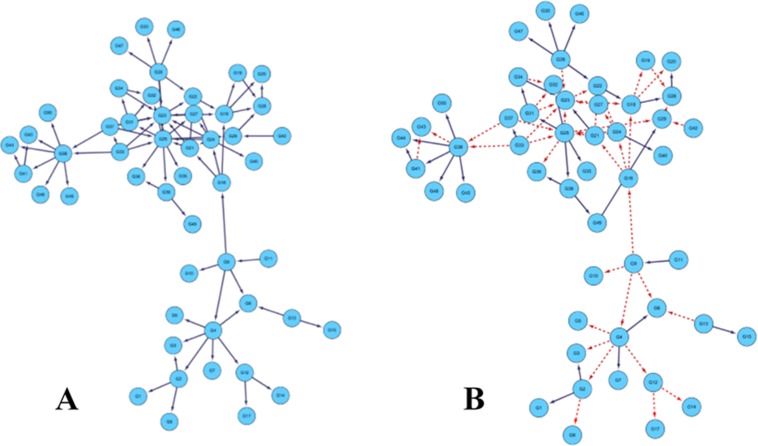
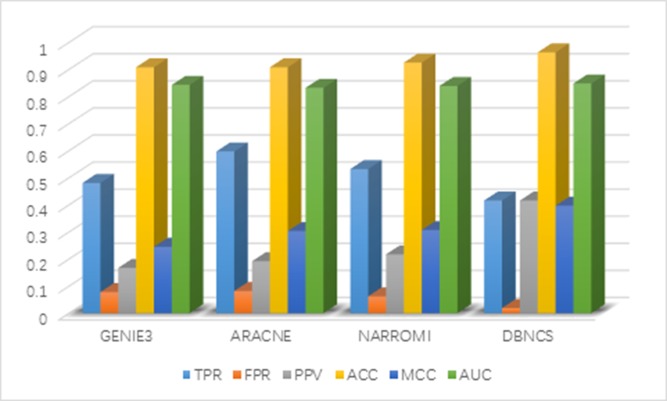
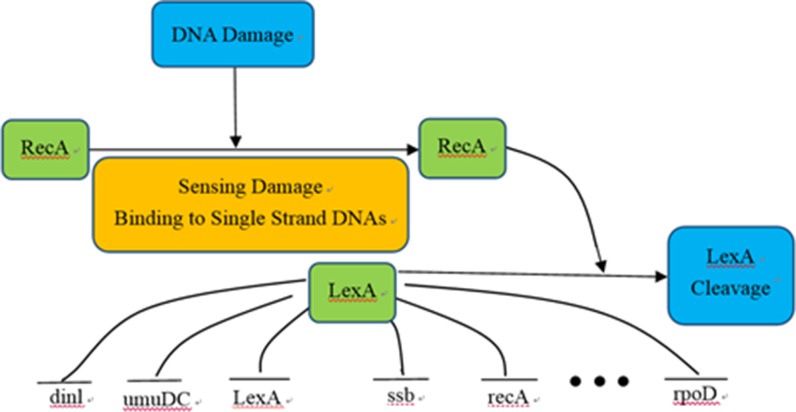
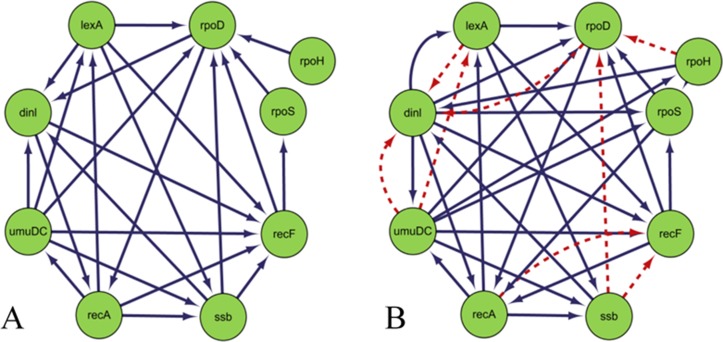
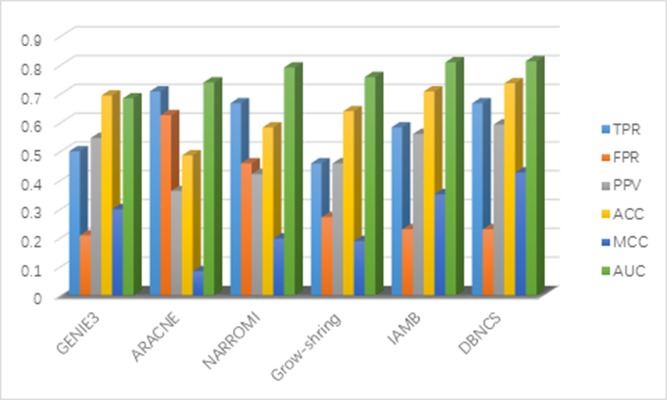
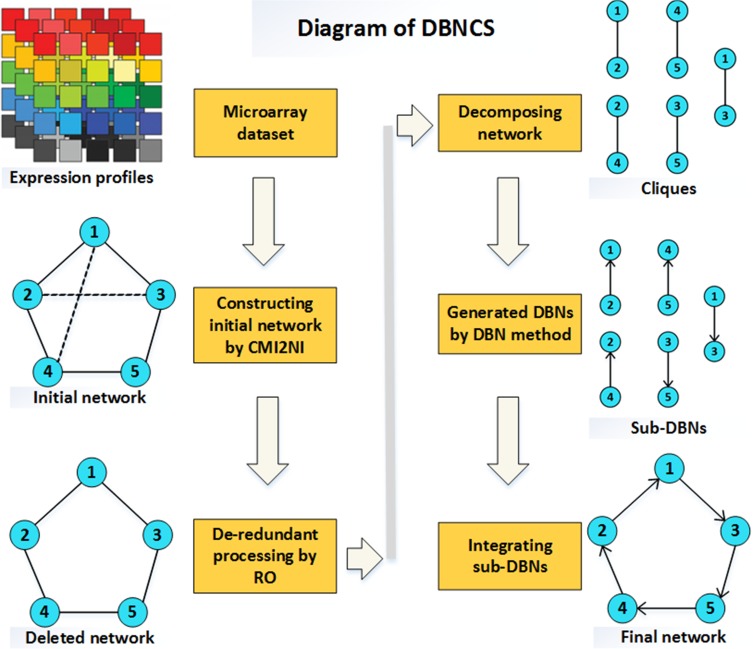
Gene regulatory networks (GRNs) research reveals complex life phenomena from the perspective of gene interaction, which is an important research field in systems biology. Traditional Bayesian networks have a high computational complexity, and the network structure scoring model has a single feature. Information-based approaches cannot identify the direction of regulation. In order to make up for the shortcomings of the above methods, this paper presents a novel hybrid learning method (DBNCS) based on dynamic Bayesian network (DBN) to construct the multiple time-delayed GRNs for the first time, combining the comprehensive score (CS) with the DBN model. DBNCS algorithm first uses CMI2NI (conditional mutual inclusive information-based network inference) algorithm for network structure profiles learning, namely the construction of search space. Then the redundant regulations are removed by using the recursive optimization algorithm (RO), thereby reduce the false positive rate. Secondly, the network structure profiles are decomposed into a set of cliques without loss, which can significantly reduce the computational complexity. Finally, DBN model is used to identify the direction of gene regulation within the cliques and search for the optimal network structure. The performance of DBNCS algorithm is evaluated by the benchmark GRN datasets from DREAM challenge as well as the SOS DNA repair network in Escherichia coli, and compared with other state-of-the-art methods. The experimental results show the rationality of the algorithm design and the outstanding performance of the GRNs.
Keywords: comprehensive score model; dynamic Bayesian network; gene regulatory networks; multiple time-delayed; network structure profiles.
Conflict of interest statement
CONFLICTS OF INTEREST The authors declare no conflicts of interest.
Figures
Similar articles
-
Inference of Gene Regulatory Network Based on Local Bayesian Networks.PLoS Comput Biol. 2016 Aug 1;12(8):e1005024. doi: 10.1371/journal.pcbi.1005024. eCollection 2016 Aug. PLoS Comput Biol. 2016. PMID: 27479082 Free PMC article.
-
MICRAT: a novel algorithm for inferring gene regulatory networks using time series gene expression data.BMC Syst Biol. 2018 Dec 14;12(Suppl 7):115. doi: 10.1186/s12918-018-0635-1. BMC Syst Biol. 2018. PMID: 30547796 Free PMC article.
-
Conditional mutual inclusive information enables accurate quantification of associations in gene regulatory networks.Nucleic Acids Res. 2015 Mar 11;43(5):e31. doi: 10.1093/nar/gku1315. Epub 2014 Dec 24. Nucleic Acids Res. 2015. PMID: 25539927 Free PMC article.
-
A bayesian framework that integrates heterogeneous data for inferring gene regulatory networks.Front Bioeng Biotechnol. 2014 May 20;2:13. doi: 10.3389/fbioe.2014.00013. eCollection 2014. Front Bioeng Biotechnol. 2014. PMID: 25152886 Free PMC article. Review.
-
Statistical and Machine Learning Approaches to Predict Gene Regulatory Networks From Transcriptome Datasets.Front Plant Sci. 2018 Nov 29;9:1770. doi: 10.3389/fpls.2018.01770. eCollection 2018. Front Plant Sci. 2018. PMID: 30555503 Free PMC article. Review.
Cited by
-
Network analysis of multivariate time series data in biological systems: methods and applications.Brief Bioinform. 2025 May 1;26(3):bbaf223. doi: 10.1093/bib/bbaf223. Brief Bioinform. 2025. PMID: 40401349 Free PMC article.
-
Gene Regulatory Identification Based on the Novel Hybrid Time-Delayed Method.Front Genet. 2022 May 19;13:888786. doi: 10.3389/fgene.2022.888786. eCollection 2022. Front Genet. 2022. PMID: 35664311 Free PMC article.
-
Codependency and mutual exclusivity for gene community detection from sparse single-cell transcriptome data.Nucleic Acids Res. 2021 Oct 11;49(18):e104. doi: 10.1093/nar/gkab601. Nucleic Acids Res. 2021. PMID: 34291282 Free PMC article.
References
-
- Davidson EH, Erwin DH. Gene regulatory networks and the evolution of animal body plans. Science. 2006;311:796–800. - PubMed
-
- Teichmann SA, Babu MM. Gene regulatory network growth by duplication. Nat Genet. 2004;36:492–496. - PubMed
-
- Buckingham M, Rigby PW. Gene Regulatory networks and transcriptional mechanisms that control myogenesis. Dev Cell. 2014;28:225–238. - PubMed
-
- Kitano H. Systems Biology: A brief overview. Science. 2002;295:1662–1664. - PubMed
LinkOut - more resources
Full Text Sources
Other Literature Sources
Research Materials
Miscellaneous
