. 2017 Aug 24;8(46):80804-80819.
doi: 10.18632/oncotarget.20534. eCollection 2017 Oct 6.

Combined targeting of Raf and Mek synergistically inhibits tumorigenesis in triple negative breast cancer model systems

Affiliations

Combined targeting of Raf and Mek synergistically inhibits tumorigenesis in triple negative breast cancer model systems

Teddy S Nagaria et al. Oncotarget. .

Abstract

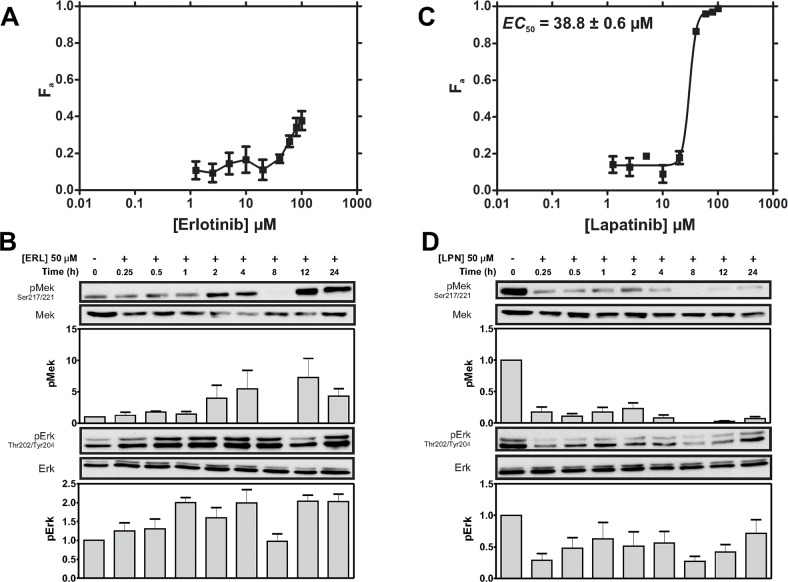
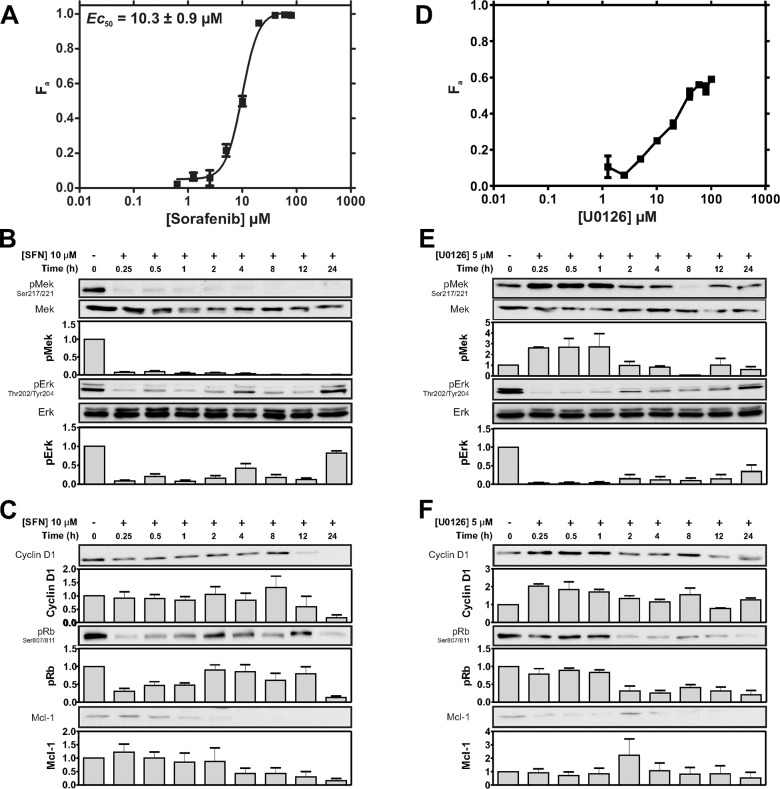
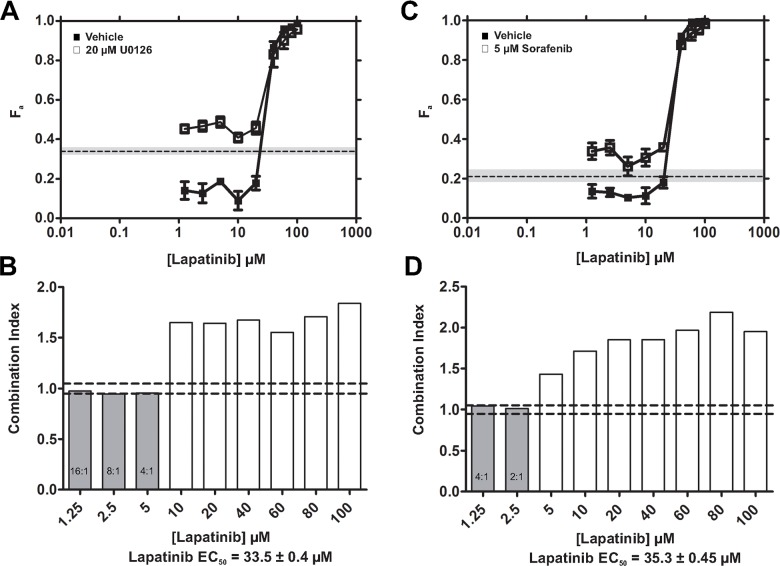
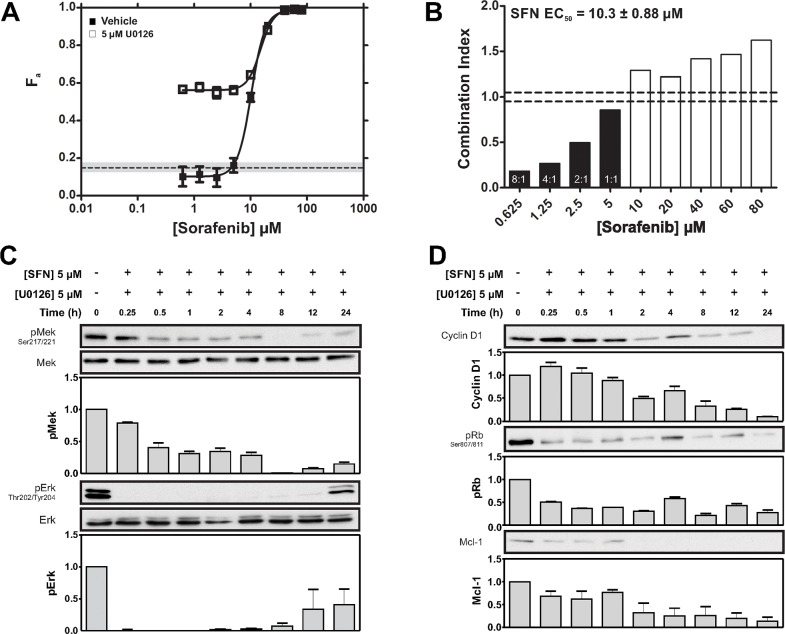
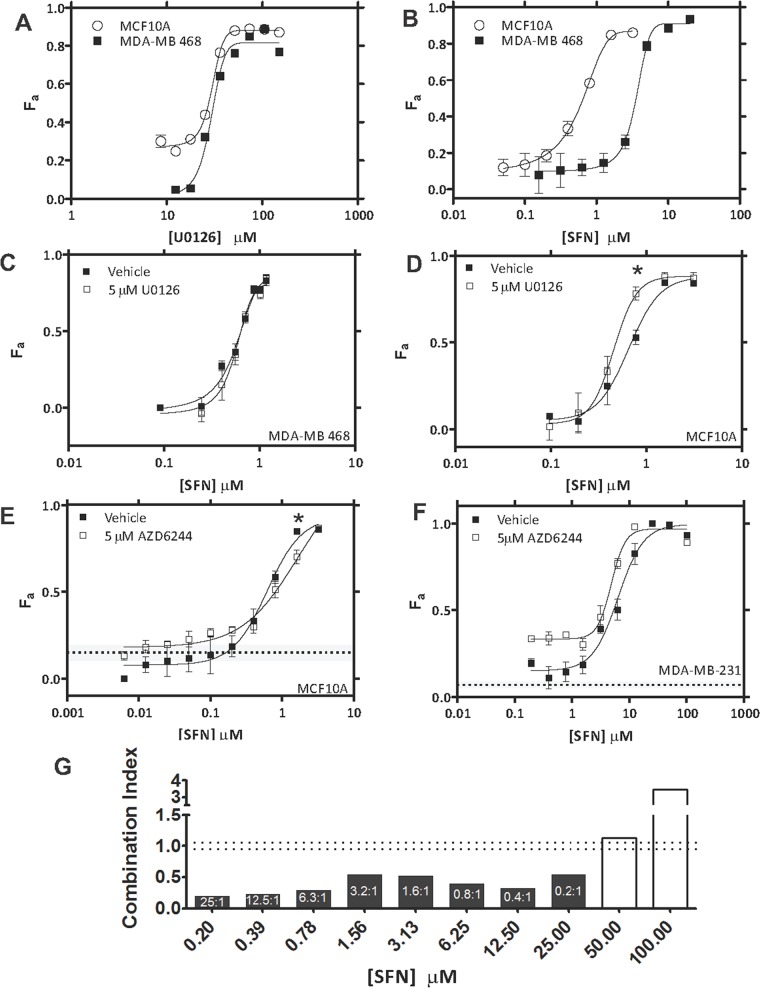
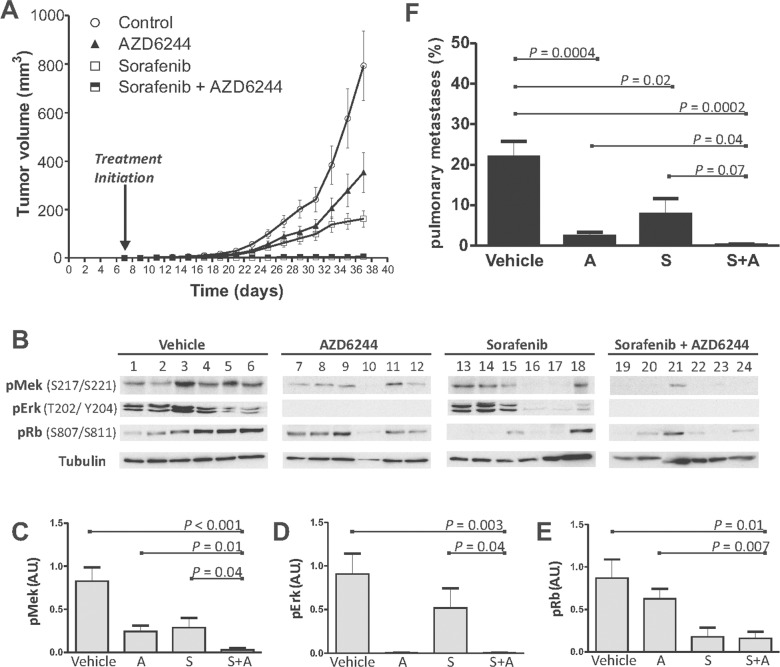
Aberrant Ras-MAPK signaling from receptor tyrosine kinases (RTKs), including epidermal growth factor receptor (EGFR) and human epidermal growth factor receptor-2 (HER2), is a hallmark of triple negative breast cancer (TNBC); thus providing rationale for targeting the Ras-MAPK pathway. Components of this EGFR/HER2-Ras-Raf-Mek-Erk pathway were co-targeted in the MDA-MB-231 and MDA-MB-468 human TNBC cell lines, and in vitro effects on signaling and cytotoxicity, as well as in vivo effects on xenograft tumor growth and metastasis were assessed. The dual EGFR/HER2 inhibitor lapatinib (LPN) displayed greater cytotoxic potency and MAPK signaling inhibition than the EGFR inhibitor erlotinib, suggesting both EGFR and HER2 contribute to MAPK signaling in this TNBC model. The Raf inhibitor sorafenib (SFN) or the Mek inhibitor U0126 suppressed MAPK signaling to a greater extent than LPN; which correlated with greater cytotoxic potency of SFN, but not U0126. However, U0126 potentiated the cytotoxic efficacy of LPN and SFN in an additive and synergistic manner, respectively. This in-series Raf-Mek co-targeting synergy was recapitulated in orthotopic mouse xenografts, where SFN and the Mek inhibitor selumitinib (AZD6244) inhibited primary tumor growth and pulmonary metastasis. Raf and Mek co-inhibition exhibits synergy in TNBC models and represent a promising combination therapy for this aggressive breast cancer type.

Keywords: Mek; Raf; selumitinib; synergy; triple negative breast cancer.


Conflict of interest statement

CONFLICTS OF INTEREST The authors declare no conflicts of interests.

Figures

Figure 1
Figure 1. MDA-MB-231 cells display greater cytotoxic sensitivity to LPN compared to ERL
(A) Cells were treated with ERL (0-100μM) and cell viability was assayed after 72 h. The fraction of cells killed (Fa ± SEM) is shown. An EC50 was not determined because of the low Fa did not reach saturation in the tested concentration range. The cytotoxicity profile is representative of 3 independent experiments. (B) Cells were treated with ERL (50 μM) for 24 h. Mek phosphorylation at Ser217/221 (pMek) and Erk phosphorylation (pErk) at Thr202/Tyr204 were assessed by immunoblotting (IB). Loading was assessed by IB for total Mek and Erk. Representative IBs and density analysis of pMek and pErk IB experiments are shown. pErk and pMek are expressed as a ratio of Mek and Erk intensity values, respectively (mean ± SEM; pMek/Mek, n = 2; pErk/Erk, n = 4). (C) Cells were treated with LPN (0-100 μM) and Fa was assayed after 72 h. The LPN EC50 is was estimated to be 38.8 ± 0.6 μM using non-linear regression analysis. The cytotoxicity profile is representative of 3 independent experiments. (D) Cells were treated with LPN (50 μM) for 24 h and pMek and pErk phosphorylation were determined by IB. Representative IBs and density analysis of Mek and Erk experiments are shown. pErk and pMek are expressed as a ratio of Mek and Erk intensity values, respectively (mean ± SEM; pMek/Mek, n = 2; pErk/Erk, n = 4).
Figure 2
Figure 2. Cytotoxic sensitivity to the Raf inhibitor SFN and the MEK inhibitor U0126
(A) Cells were treated with SFN (0-80 μM) and viability was assayed after 72 h. The SFN EC50 is was estimated to be 10.3 ± 0.9 μM. The cytotoxicity profile is representative of 3 independent experiments. (B) Cells were treated with SFN (10 μM) for 24 h and the indicated proteins or phosphoproteins were assessed by IB. Representative IBs and density analysis of pMek and pErk IBs are shown. pErk and pMek are expressed as a ratio of Mek and Erk intensity values, respectively (mean ± SEM; pMek/Mek, n = 2; pErk/Erk, n = 4). (C) Representative IBs of Rb phosphorylation (at Ser807/811), Cyclin D1 and, Mcl-1 in response to 10 μM SFN. Corresponding density analyses of Rb, Cyclin D1 and Mcl-1 IBs expressed as a ratio of RasGAP intensity levels are shown below (mean ± SEM; pRb, n = 2; Cyclin D1, n = 2 Mcl-1, n = 2). (D) Cells were treated with U0126 (0-100 μM) and viability was assayed after 72 h. An EC50 was not determined because of the low Fa. The cytotoxicity profile is representative of 3 independent experiments. (E) Cells were treated with U0126 (5 μM) for 24 h and the indicated proteins or phosphoproteins were assessed by IB. Representative IBs and density analysis of pMek and pErk IBs are shown. pErk and pMek are expressed as a ratio of Mek and Erk intensity values, respectively (mean ± SEM; pMek/Mek, n = 2; pErk/Erk, n = 3). (F) Representative IBs showing Rb signaling (as assessed by S807/S811 phosphorylation), as well as Cyclin D1 and, Mcl-1 expression are shown in response to 5 μM U0126. Corresponding density analyses of Rb, Cyclin D1 and Mcl-1 IBs expressed as a ratio of RasGAP intensity levels are shown below (mean ± SEM; pRb/RasGAP, n = 2; Cyclin D1/RasGAP n = 2; Mcl-1/RasGAP, n = 2).
Figure 3
Figure 3. LPN-U0126 and LPN-SFN combinations exhibit additive cytotoxicity
(A, C) The fraction of cells killed (Fa ± SEM) by increasing concentrations of LPN in the presence of DMSO (vehicle) or a fixed concentration of U0126 (20 μM) (A), or SFN (5 μM) (C). The fraction of cells killed by U0126 or SFN alone at these fixed concentrations is shown for comparison [dashed lines; grey shading (± SEM)]. (B, D) MDE-CI analysis of drug interactions with LPN + U0126 (B) or LPN + SFN. Shown are combination indices (CI) as a function of LPN concentrations. Grey and white bars denote additive (CI = 0.9-1.1) or antagonistic interactions (CI > 1.1), respectively. No synergistic interactions (CI < 0.9) were observed. Additive ratios (U0126 + LPN or SFN + LPN) are shown within grey bars, and the LPN EC50 values are indicated. Data are representative of 3 independent experiments.
Figure 4
Figure 4. Synergistic potentiation of SFN-induced cytotoxicity by U0126
(A) Fraction of MDA-MB-231 cells killed (Fa ± SEM) by increasing concentrations of SFN in the presence of DMSO (vehicle) or at a fixed U0126 concentration (5 μM; dashed lines; grey shading ± SEM). (B) MDE-CI analysis of drug interactions in the panel A. Shown are combination indices (CI) as a function of SFN concentration. Black and white bars denote synergistic (CI < 0.9) or antagonistic interactions (CI > 1.1), respectively. Synergistic ratios (U0126 + SFN) and SFN EC50 values are indicated. Data are representative of 3 independent experiments. (C) MDA-MB-231 cells were treated with SFN (5 μM) and U0126 (5 μM) for the indicated times and pMek and pErk were assessed by IB. Representative IBs and density analysis of pMek and pErk IBs are shown. pErk and pMek are expressed as a ratio of Mek and Erk intensity values, respectively (mean ± SEM; pMek/Mek, n = 2; pErk/Erk, n = 2). (D) MDA-MB-231 cells were treated with SFN (5 μM) and U0126 (5 μM) for the indicated times. Representative IBs showing Rb signaling (as assessed by S807/S811 phosphorylation as well as Cyclin D1 and, Mcl-1 expression are shown. Corresponding density analyses of Rb, Cyclin D1 and Mcl-1 IBs expressed as a ratio of RasGAP intensity levels are shown below (mean ± SEM; pRb/RasGAP, n = 2; Cyclin D1/RasGAP n = 2; Mcl-1/RasGAP, n = 2).
Figure 5
Figure 5. Assessment of therapeutic index for U0126/AZD6244 – SFN combinations
(A) Cells were treated with varying concentrations of U0126 and viability was assayed after 72 h. U0126 EC50 was estimated to be 28.7 ± 1.0 μM in MDA-MB-468 cells and 27.6 ± 1.1 μM in MCF10A cells. Cytotoxicity profiles are representative of 3 independent experiments. (B) Cells were treated with varying concentrations of SFN and viability was assayed after 72 h. SFN EC50 was estimated to be 3.6 ± 0.3 μM in MDA-MB-468 cells and 0.5 ± 0.2 μM in MCF10A cells. Cytotoxicity profiles are representative of 3 independent experiments. (C) Fraction of MDA-MB-468 cells killed (Fa ± SEM) by increasing concentrations of SFN in the presence of DMSO (vehicle) or at a fixed concentration of U0126 (5 μM). (D) Fraction of MCF10A cells killed (Fa ± SEM) by increasing concentrations of SFN in the presence of DMSO (vehicle) or at a fixed concentration of U0126 (5 μM). (E) Fraction of MCF10A cells killed (Fa ± SEM) by increasing concentrations of SFN in the presence of DMSO (vehicle) or at a fixed concentration of AZD6244 (5 μM; dashed lines; grey shading (± SEM)). (F) Fraction of MDA-MB-231 cells killed (Fa ± SEM) by increasing concentrations of SFN in the presence of DMSO (vehicle) or at a fixed concentration of AZD6244 (5 μM; dashed lines; grey shading (± SEM)). (G) MDE-CI analysis of drug interactions in panel F. Shown are combination indices (CI) as a function of SFN concentration. Black and white bars denote synergistic (CI < 0.9) or antagonistic interactions (CI > 1.1), respectively. Synergistic ratios (AZD6244 + SFN) are indicated. Data are representative of 3 independent experiments.
Figure 6
Figure 6. Combined treatment with SFN and AZD6244 results in enhanced tumor suppression in vivo
(A) Xenograft tumor growth profiles of vehicle (control) or drug-treated mice (6 mice/cohort). Shown are caliper measurement-based estimates of mean Tumor Volume ± SEM. Control versus SFN, AZD6244 or SFN + AZD6244 (p<0.0001; 2-way ANOVA). SFN + AZD6244 versus SFN or AZD6244 (p<0.0001; 2-way ANOVA). (B) IB analysis of tumors assessing phosphorylation of Mek, Erk and Rb in response to Vehicle, AZD6244, SFN or SFN plus AZD6244. Tubulin IBs were used to assess loading. (C-E) Densitometry analyses of the average intensity of phosphorylated Mek (C), Erk (D) and Rb (E). Shown is the mean ± SEM intensity expressed as a ratio of tubulin intensity. Significant P values (t-TEST) are indicated. Arbitrary Units (A.U.) (F) Pulmonary metastatic tumor burden was assessed by morphometric measurements using ePATHOLOGY IMAGESCOPE and IMAGEPRO software. Quantification of the ratio (± SEM) of infiltrative metastatic tumor clusters to normal lung parenchyma was performed (n=6 for each cohort). Significant P values (t-TEST) are indicated. For images of individual tumors and sections, see Supplementary Figure 2, 3.

Similar articles

Cited by

References

    1. Ferraro DA, Gaborit N, Maron R, Cohen-Dvashi H, Porat Z, Pareja F, Lavi S, Lindzen M, Ben-Chetrit N, Sela M, Yarden Y. Inhibition of triple-negative breast cancer models by combinations of antibodies to EGFR. Proc Natl Acad Sci U S A. 2013;110:1815–20. - PMC - PubMed
    1. Klijn JG, Berns PM, Bontenbal M, Alexieva-Figusch J, Foekens JA. Clinical breast cancer, new developments in selection and endocrine treatment of patients. J Steroid Biochem Mol Biol. 1992;43:211–21. - PubMed
    1. Klijn JG, Berns PM, Schmitz PI, Foekens JA. The clinical significance of epidermal growth factor receptor (EGF-R) in human breast cancer: a review on 5232 patients. Endocr Rev. 1992;13:3–17. - PubMed
    1. Salomon DS, Brandt R, Ciardiello F, Normanno N. Epidermal growth factor-related peptides and their receptors in human malignancies. Crit Rev Oncol Hematol. 1995;19:183–232. - PubMed
    1. Tsutsui S, Kataoka A, Ohno S, Murakami S, Kinoshita J, Hachitanda Y. Prognostic and predictive value of epidermal growth factor receptor in recurrent breast cancer. Clin Cancer Res. 2002;8:3454–60. - PubMed