. 2017 Nov 21;113(10):2271-2280.
doi: 10.1016/j.bpj.2017.10.017. Epub 2017 Nov 4.

Computational Lipidomics of the Neuronal Plasma Membrane

Affiliations

Computational Lipidomics of the Neuronal Plasma Membrane

Helgi I Ingólfsson et al. Biophys J. .

Abstract

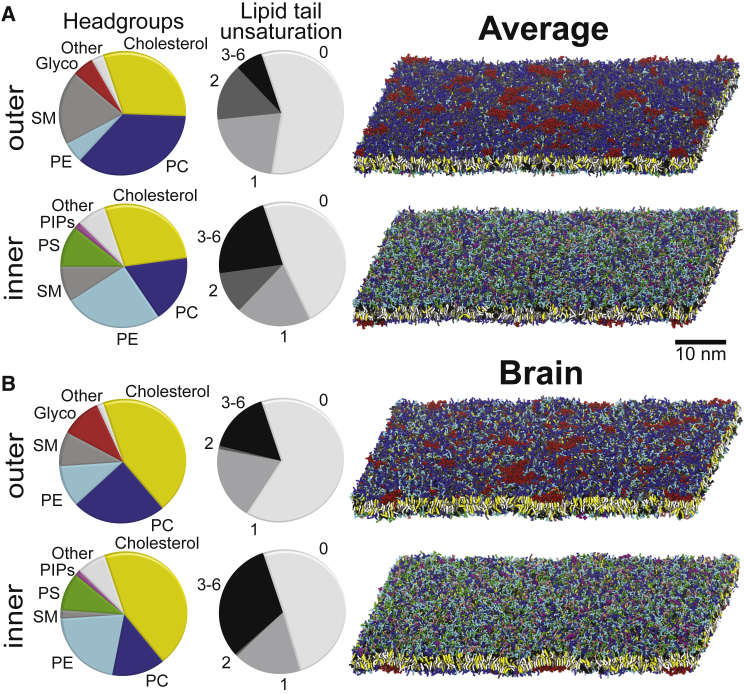
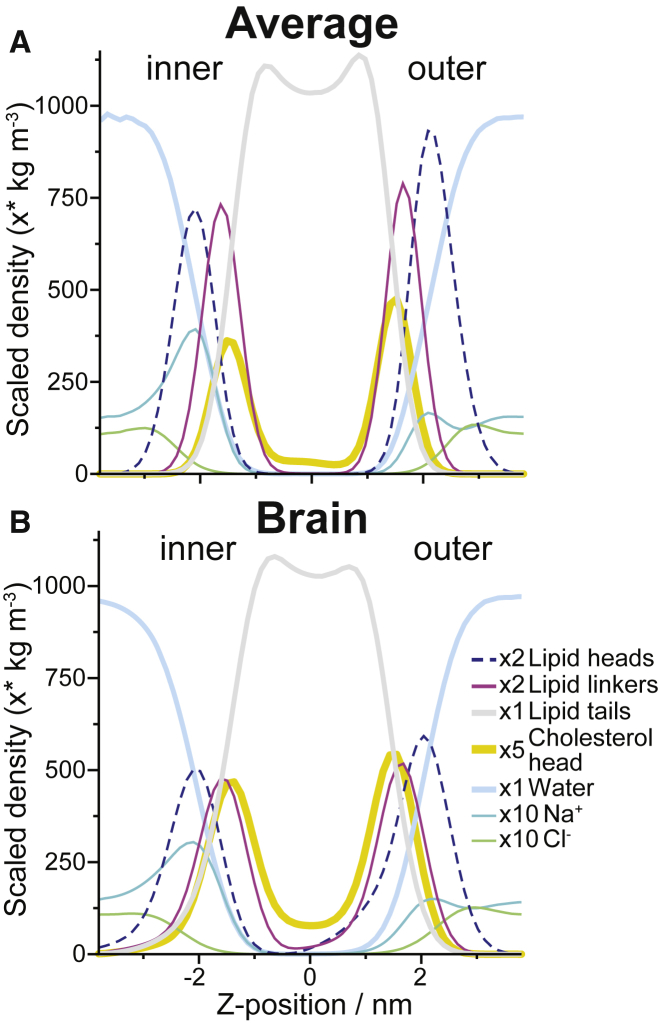
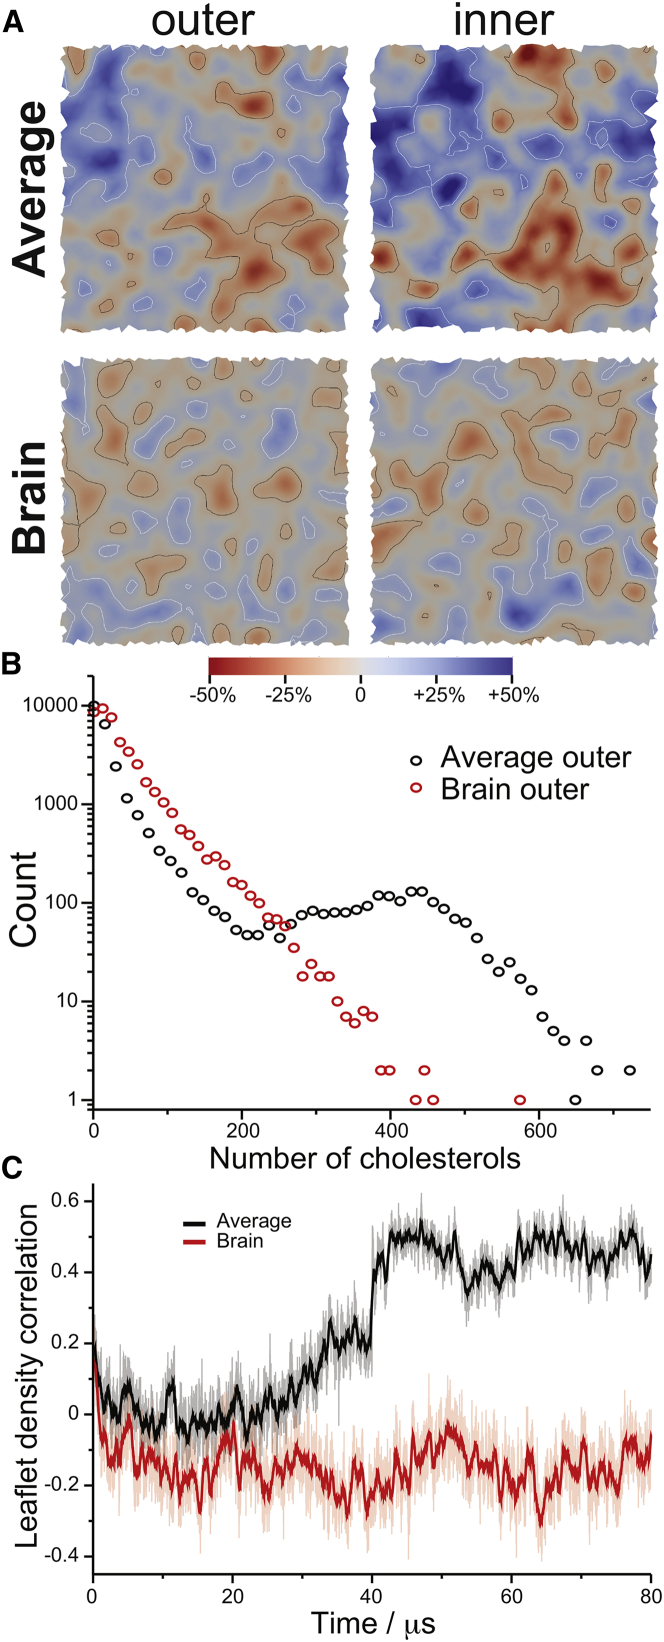
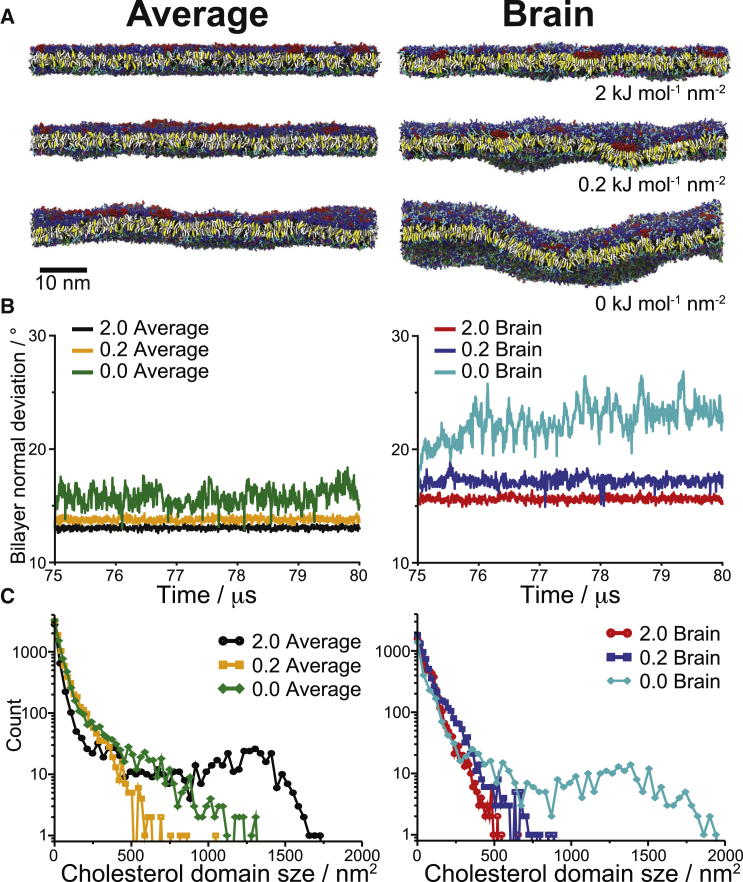
Membrane lipid composition varies greatly within submembrane compartments, different organelle membranes, and also between cells of different cell stage, cell and tissue types, and organisms. Environmental factors (such as diet) also influence membrane composition. The membrane lipid composition is tightly regulated by the cell, maintaining a homeostasis that, if disrupted, can impair cell function and lead to disease. This is especially pronounced in the brain, where defects in lipid regulation are linked to various neurological diseases. The tightly regulated diversity raises questions on how complex changes in composition affect overall bilayer properties, dynamics, and lipid organization of cellular membranes. Here, we utilize recent advances in computational power and molecular dynamics force fields to develop and test a realistically complex human brain plasma membrane (PM) lipid model and extend previous work on an idealized, "average" mammalian PM. The PMs showed both striking similarities, despite significantly different lipid composition, and interesting differences. The main differences in composition (higher cholesterol concentration and increased tail unsaturation in brain PM) appear to have opposite, yet complementary, influences on many bilayer properties. Both mixtures exhibit a range of dynamic lipid lateral inhomogeneities ("domains"). The domains can be small and transient or larger and more persistent and can correlate between the leaflets depending on lipid mixture, Brain or Average, as well as on the extent of bilayer undulations.


Figures

Figure 1
Figure 1
PM lipid distributions. Pie charts with the overall distribution of the main lipid headgroups and level of tail unsaturation in the outer/inner leaflet, as well as snapshots of the outer/inner leaflet of the simulations after 80 μs, are shown for the Average (A) and Brain membranes (B). The lipids in the snapshots are colored as follows: PC, blue; PE, cyan; SM, gray; PS, green; glycolipids (Glyco), red; PI, pink; PA, white; PIPs, magenta; CER, ice blue; Lyso, orange; DAG, brown; and cholesterol, yellow.
Figure 2
Figure 2
Membrane density profile. The density profile of the two different PM mixtures Average (A) and Brain (B) is shown across the Z-dimension, averaged from 78 to 80 μs. The Z-dimension is a reasonable approximation of the bilayer normal for these membranes as their undulations have been restricted. The density of the smaller groups is scaled for clarity, as indicated on the figure key.
Figure 3
Figure 3
Lipid domains. In-plane lateral redistribution of cholesterol was used to track lipid patches of increased/decreased order for the outer/inner leaflets in both the Average and Brain mixtures. (A) Cholesterol density was mapped for each snapshot using a Gaussian filter and colored based on regions of increased (red) or decreased (blue) average density. Thresholds for high-density regions (black contour lines) and low-density regions (white contour lines) were determined as the values that maximized the number of domains in that layer (Fig. S4, A and B). (B) Histograms of domain “size,” in number of cholesterols for the high-density regions of the outer leaflet; Fig. S4C shows the same histograms for all other regions. (C) Cross correlation between the cholesterol densities of the PM’s outer and inner leaflets, shown for every 5 ns (dimmer lines) and averaged over 500 ns (bold lines).
Figure 4
Figure 4
Effects of bilayer undulations. Starting from the main Brain and Average PM simulations at 75 μs, simulations with 10-fold weaker and no restraints on bilayer undulations (0.2 and 0 kJ mol−1 nm−2, respectively) were run for 5 μs. (A) Side-view snapshots of the final structure of each simulation. The lipids are colored according to the same scheme as in Fig. 1. (B) The average bilayer undulations with time are shown as the average angle between the bilayer normal of each lipid (from the fitted bilayer surfaces) and the z-axis. (C) Size histograms of cholesterol-enriched domains in the outer leaflet of each simulation.

References

    1. van Meer G., Voelker D.R., Feigenson G.W. Membrane lipids: where they are and how they behave. Nat. Rev. Mol. Cell Biol. 2008;9:112–124. - PMC - PubMed
    1. Sampaio J.L., Gerl M.J., Shevchenko A. Membrane lipidome of an epithelial cell line. Proc. Natl. Acad. Sci. USA. 2011;108:1903–1907. - PMC - PubMed
    1. Lee A.G. How lipids affect the activities of integral membrane proteins. Biochim. Biophys. Acta. 2004;1666:62–87. - PubMed
    1. Andersen O.S., Koeppe R.E., II Bilayer thickness and membrane protein function: an energetic perspective. Annu. Rev. Biophys. Biomol. Struct. 2007;36:107–130. - PubMed
    1. Lundbaek J.A., Collingwood S.A., Andersen O.S. Lipid bilayer regulation of membrane protein function: gramicidin channels as molecular force probes. J. R. Soc. Interface. 2010;7:373–395. - PMC - PubMed

Substances

LinkOut - more resources