Review
. 2017 Dec;91 Suppl 1(Suppl 1):S36-S45.
doi: 10.1016/j.yrtph.2017.11.001. Epub 2017 Nov 4.

A generic Transcriptomics Reporting Framework (TRF) for 'omics data processing and analysis

Affiliations
Review

A generic Transcriptomics Reporting Framework (TRF) for 'omics data processing and analysis

Timothy W Gant et al. Regul Toxicol Pharmacol. 2017 Dec.

Abstract

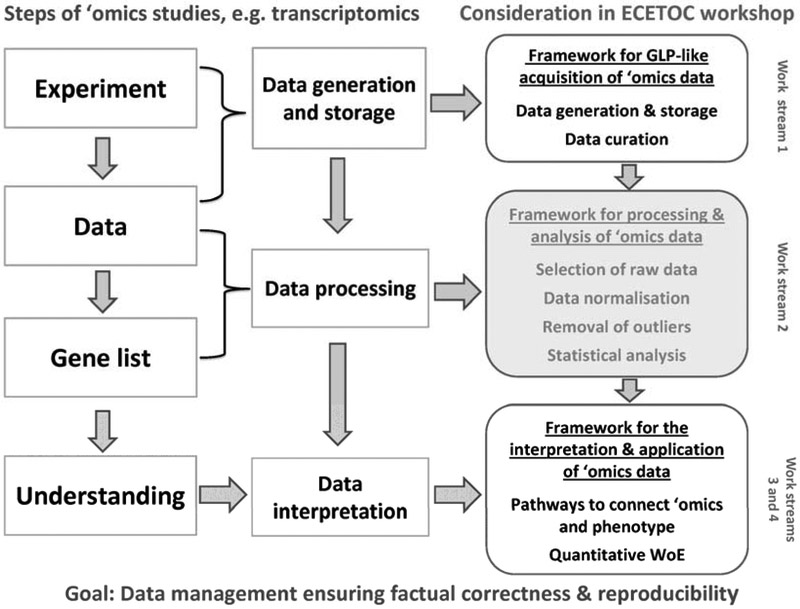
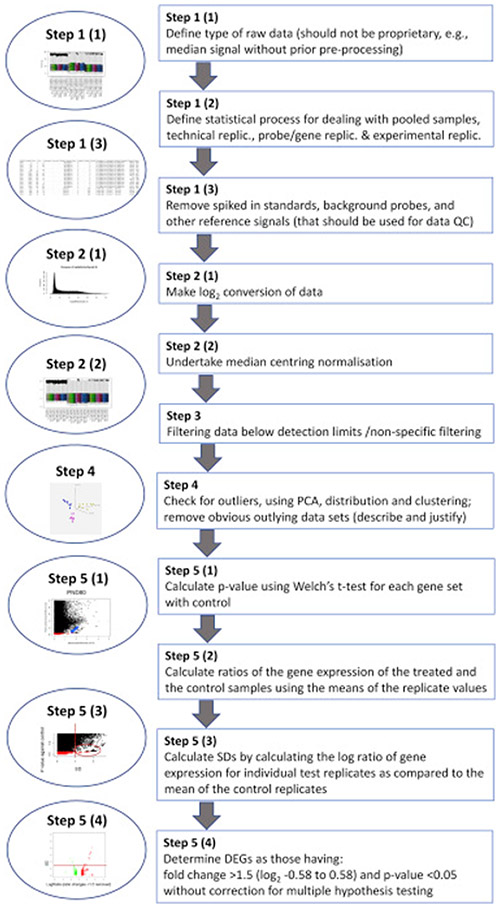
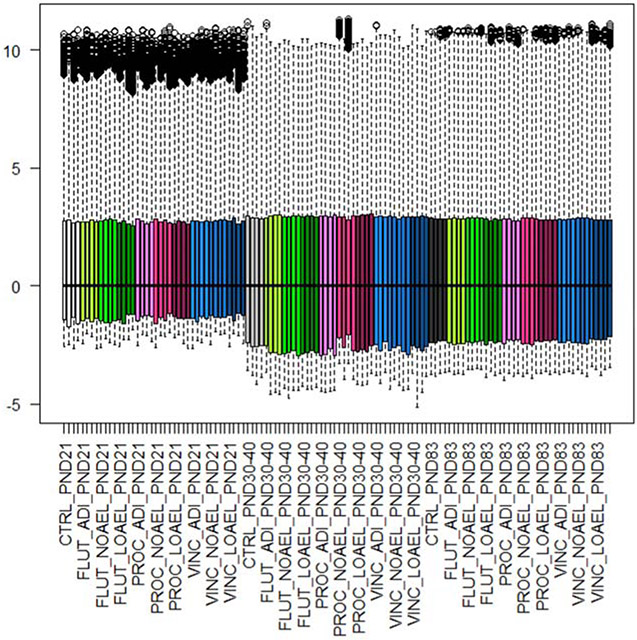
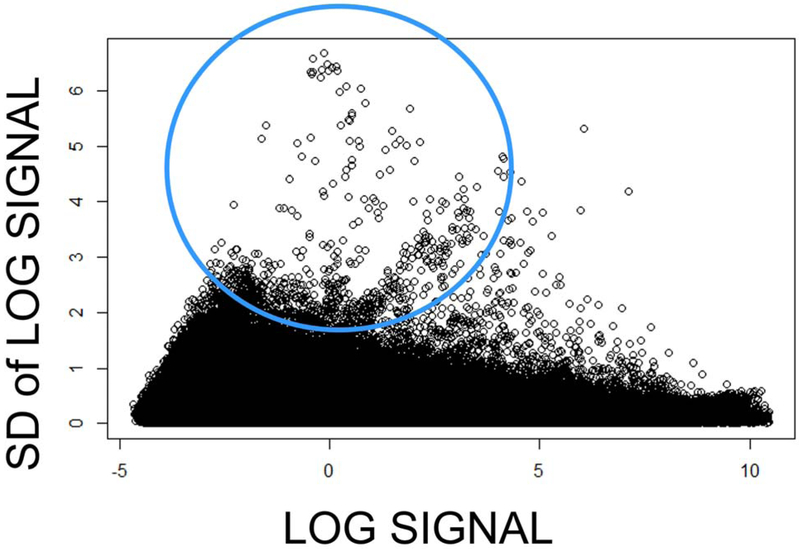
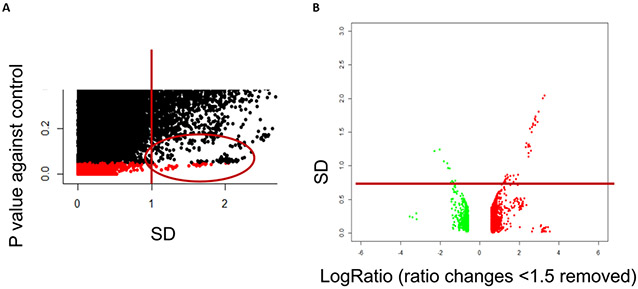
A generic Transcriptomics Reporting Framework (TRF) is presented that lists parameters that should be reported in 'omics studies used in a regulatory context. The TRF encompasses the processes from transcriptome profiling from data generation to a processed list of differentially expressed genes (DEGs) ready for interpretation. Included within the TRF is a reference baseline analysis (RBA) that encompasses raw data selection; data normalisation; recognition of outliers; and statistical analysis. The TRF itself does not dictate the methodology for data processing, but deals with what should be reported. Its principles are also applicable to sequencing data and other 'omics. In contrast, the RBA specifies a simple data processing and analysis methodology that is designed to provide a comparison point for other approaches and is exemplified here by a case study. By providing transparency on the steps applied during 'omics data processing and analysis, the TRF will increase confidence processing of 'omics data, and regulatory use. Applicability of the TRF is ensured by its simplicity and generality. The TRF can be applied to all types of regulatory 'omics studies, and it can be executed using different commonly available software tools.

Keywords: Bioinformatics; Differentially expressed genes; Gene expression; Normalisation of ‘omics data; Regulatory toxicology; Reproducibility; Statistical analysis.


Conflict of interest statement

Conflict of interest

UGS was hired by ECETOC and the CEFIC LRI to assist in the preparation of the manuscript. The other authors were engaged in the course of their normal employment. The authors alone are responsible for the content and writing of the paper.

Figures

Figure 1:
Figure 1:. Overview of the work streams considered at the ECETOC workshop Applying ‘omics technologies in chemical risk assessment (Buesen et al., 2017)
Footnote to Figure 1: The present article ‘A generic Transcriptomics Reporting Framework (TRF) for ‘Omics Data Processing and Analysis’ considers discussions from the ECETOC workshop work stream 2 (highlighted in grey). This box briefly lists bioinformatic processes involved in the use of transcriptomics data. The TRF incorporates a reference baseline analysis (RBA) method for the identification of differential gene expression against which other approaches can be benchmarked. While designed around microarray data analysis, the TRF and the embedded RBA are compatible with high throughput sequencing gene counting data.
Figure 2:
Figure 2:. Boxplots of the non-normalised log2 data from the EMSG56 study comparing data that are based upon the Agilent Technologies gProcessedSignal (left) with those that are based upon the gMedianSignal (right)
Footnote to Figure 2: The data are derived from 120 microarrays across three time points (postnatal days (PND) 21, 30-40, 83). At each time point, a total of 10 samples were measured, i.e. the control and three concentrations each for the three substances flutamide (FLUT), prochloraz (PROC) and vincolzalin (VINC). The three concentrations were set to represent each substance’s acceptable daily intake level (ADI; the low dose), no observed adverse effect level (NOAEL; the mid-dose) and lowest observed adverse effect level (LOAEL; the high dose). Each dose/time combination is indicated by a colour, and there are four experimental sets of data at each combination. The data are either the gProcessedSignal data or the gMedianSignal data and have been transformed to the log2. For each measurement, the coloured boxes represent the first to third quartile, the dotted lines the minimum to maximum values, and the black circles (for the gMedianData) outliers that have exceeded the intensity threshold for the scanner.
Figure 3:
Figure 3:. Overview of the Transcriptomics Reporting Framework (TRF) Reference Baseline Analysis (RBA) method
Footnote to Figure 3: Abbreviations: DEG: Differentially expressed gene, PCA: Principal component analysis; Replic.: Replicates; SD: Standard deviation.
Figure 4:
Figure 4:. Transforming the data by log2 results in a bimodal distribution of data
Footnote to Figure 4: Rat data for all gene expressions at one experimental point (A) are log transformed (B) spreading the data. The bimodal distribution results from the majority of genes being expressed at a similar level with a small set having a distribution over a much greater expression level. Individual genes show a normal distribution across the experiment (C).
Figure 5:
Figure 5:. Effect of median centring normalization on the total data set
Footnote to Figure 5: The log transformed gMedianSignal data is transformed by centring to the median. This ensures that the data distributions in each experiment lie over each other allowing calculation of the ratios of differential gene expression for each experiment. For each measurement, the coloured boxes represent the first to third quartile, the dotted lines the minimum to maximum values, and the black circles outliers that have exceeded the intensity threshold for the scanner.
Figure 6:
Figure 6:. Log signal plotted against the SD of that signal showing that more variance occurs at the lower expression levels
Footnote to Figure 6: Greater intensity of fluorescence is easier and more reproducible to measure leading to a decrease in variance at the higher levels of expression. Circled region: The most pronounced variance occurs in the measurement of lower expressed genes that produce lower signals on the microarray.
Figure 7:
Figure 7:. Statistical analysis applying both the 1.5-fold change and p <0.05 cut-off values
Footnote to Figure 7: p <0.05 cut-off applied to the data. This removes most of the more variable data though some still remain as indicated by the circle (A). These data could result though from a high level of gene expression variance between the control and test groups with one measure being of low intensity and the other high. This would result in some variance from the low expression sample but would still be significant due to the high level of differential gene expression. Panel B indicates that the 1.5-fold change cut off value removes those genes of low variance in the measure of expression but also low differential expression that could still be significant (B).

References

    1. Affymetrix, 2013. Affymetrix® GeneChip® Command Console® (AGCC) 4.0 User Manual, available at: http://www.affymetrix.com/support/technical/byproduct.affx?product=comma....
    1. Affymetrix, 2014. Transcriptome Analysis Console (TAC) 3.0. User Guide, available at: http://www.affymetrix.com/estore/browse/level_seven_software_products_on...
    1. Agilent, 2014. Agilent GeneSpring. User manual, available at: http://www.agilent.com/cs/library/usermanuals/public/GeneSpring-manual.pdf.
    1. Brazma A, Hingamp P, Quackenbush J, Sherlock G, Spellman P, Stoeckert C, Aach J, Ansorge W, Ball CA, Causton HC, Gaasterland T, Glenisson P, Holstege FC, Kim IF, Markowitz V, Matese JC, Parkinson H, Robinson A, Sarkans U, Schulze-Kremer S, Stewart J, Taylor R, Vilo J, Vingron M, 2001. Minimum information about a microarray experiment (MIAME) - toward standards for microarray data. Nat. Genet 29, 365–371. - PubMed
    1. Buesen R, Chorley BN, da Silva Lima B, Daston G, Deferme L, Ebbels T, Gant TW, Goetz A, Greally J, Gribaldo L, Hackermüller J, Hubesch B, Jennen D, Johnson K, Kanno J, Kauffmann H-M, Laffont M, Meehan R, Pemberton M, Perdichizzi S, Piersma AH, Sauer UG, Schmidt K, Seitz H, Sumida K, Tollefsen KE, Tong W, Tralau T, van Ravenzwaay B, Weber R, Worth A, Yauk C, Poole A, 2017. Applying ‘omics technologies in chemicals risk assessment: Report of an ECETOC workshop Regulat. Toxicol. Pharmacol. epub ahead of print 25 September 2017, doi: 10.1016/j.yrtph.2017.09.002. - DOI - PMC - PubMed

MeSH terms