. 2018 Jan 5;293(1):69-88.
doi: 10.1074/jbc.M117.808667. Epub 2017 Nov 7.

Solution structure of an ultra-stable single-chain insulin analog connects protein dynamics to a novel mechanism of receptor binding

Affiliations

Solution structure of an ultra-stable single-chain insulin analog connects protein dynamics to a novel mechanism of receptor binding

Michael D Glidden et al. J Biol Chem. .

Abstract

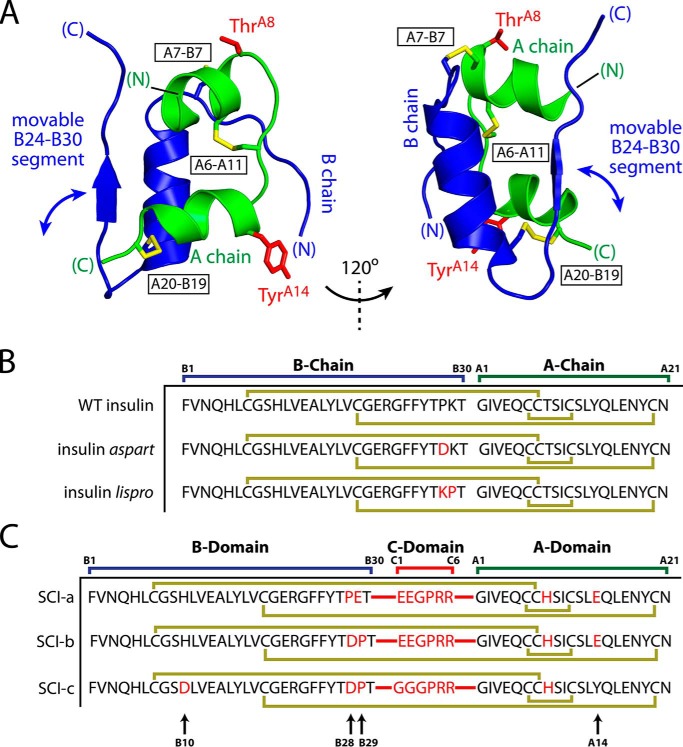
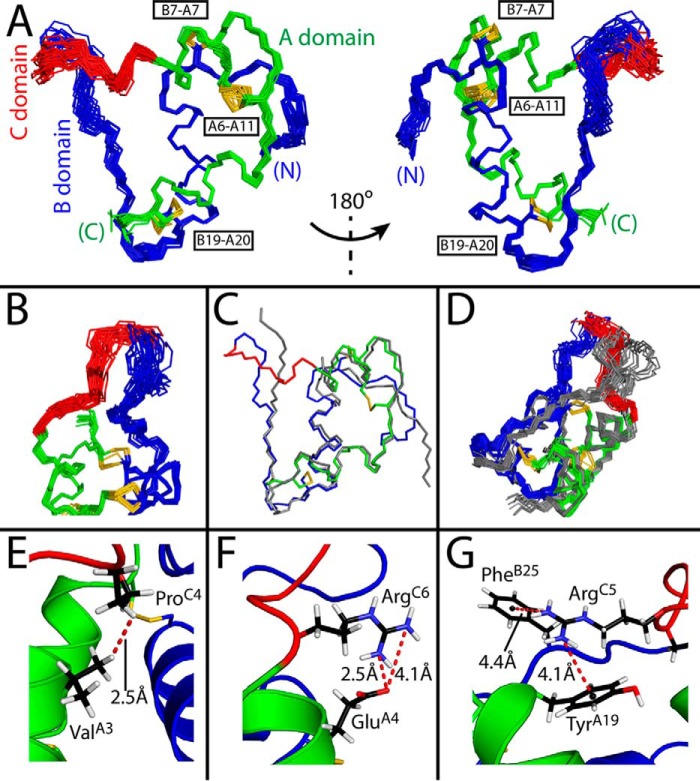
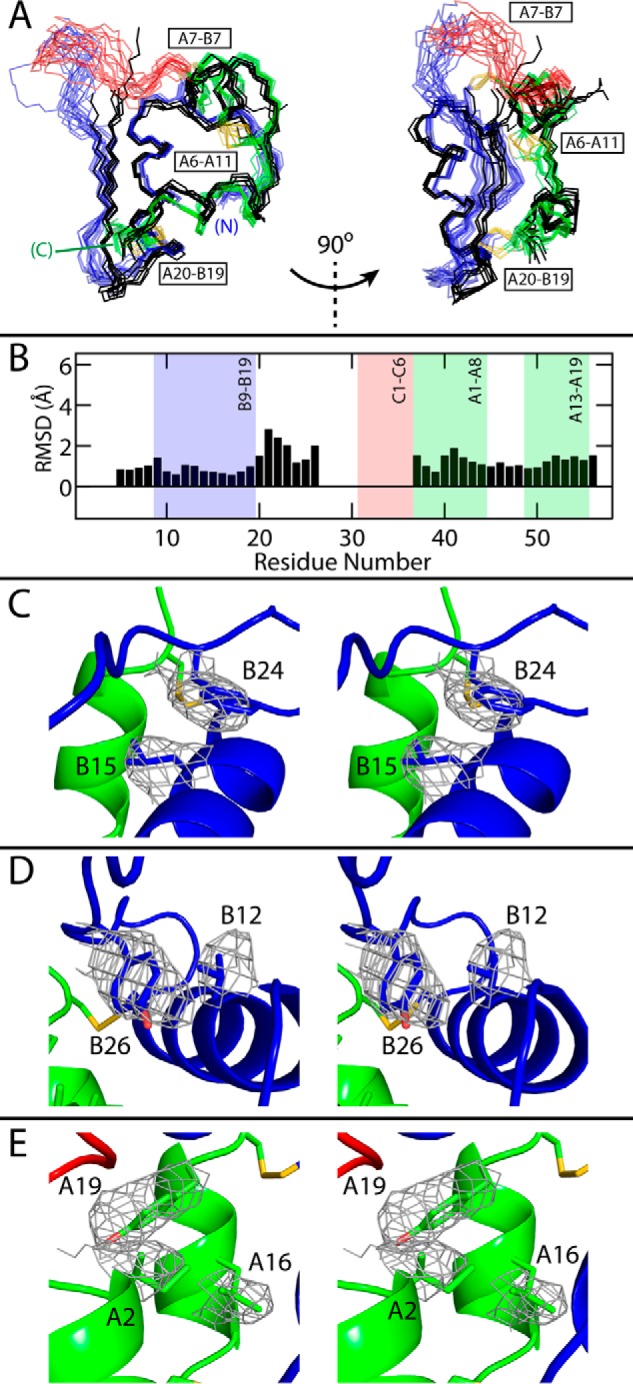
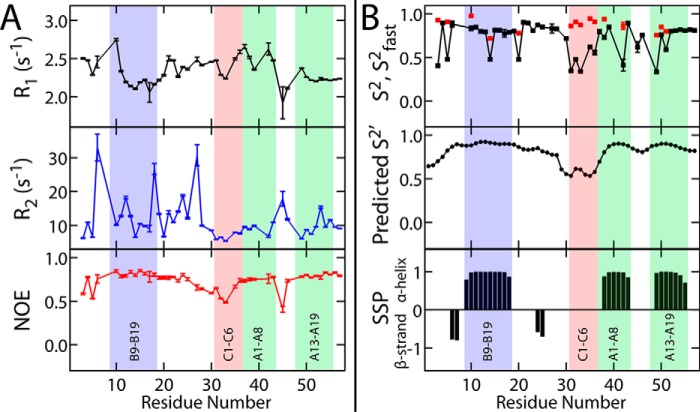
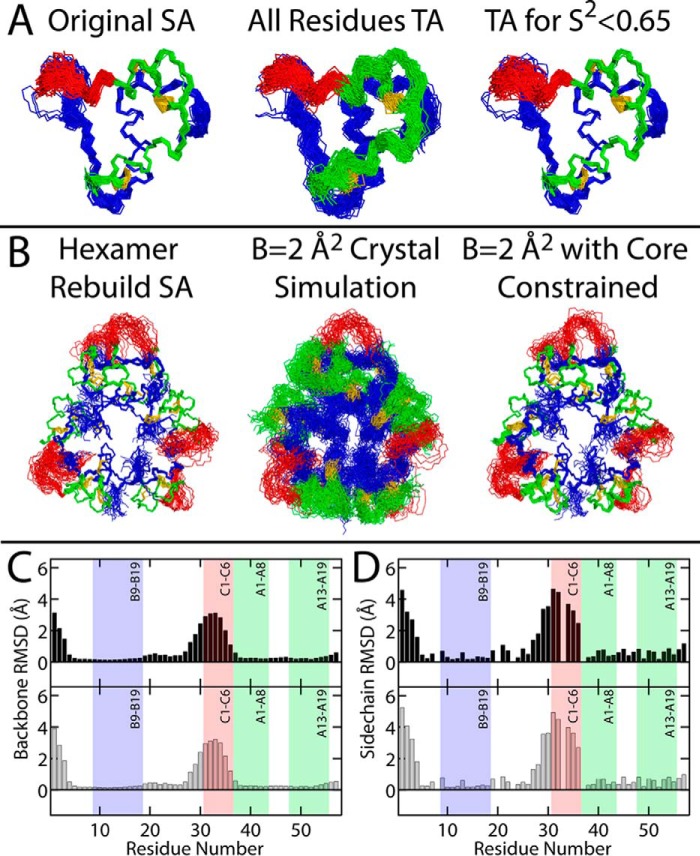
Domain-minimized insulin receptors (IRs) have enabled crystallographic analysis of insulin-bound "micro-receptors." In such structures, the C-terminal segment of the insulin B chain inserts between conserved IR domains, unmasking an invariant receptor-binding surface that spans both insulin A and B chains. This "open" conformation not only rationalizes the inactivity of single-chain insulin (SCI) analogs (in which the A and B chains are directly linked), but also suggests that connecting (C) domains of sufficient length will bind the IR. Here, we report the high-resolution solution structure and dynamics of such an active SCI. The hormone's closed-to-open transition is foreshadowed by segmental flexibility in the native state as probed by heteronuclear NMR spectroscopy and multiple conformer simulations of crystallographic protomers as described in the companion article. We propose a model of the SCI's IR-bound state based on molecular-dynamics simulations of a micro-receptor complex. In this model, a loop defined by the SCI's B and C domains encircles the C-terminal segment of the IR α-subunit. This binding mode predicts a conformational transition between an ultra-stable closed state (in the free hormone) and an active open state (on receptor binding). Optimization of this switch within an ultra-stable SCI promises to circumvent insulin's complex global cold chain. The analog's biphasic activity, which serendipitously resembles current premixed formulations of soluble insulin and microcrystalline suspension, may be of particular utility in the developing world.

Keywords: diabetes; hormone; protein engineering; protein structure; receptor tyrosine kinase.


Conflict of interest statement

M. A. W. has equity in Thermalin Diabetes, LLC (Cleveland, OH), where he serves as Chief Innovation Officer; he has also been a consultant to Merck Research Laboratories and DEKA Research & Development Corp. N. B. P. and F. I.-B. are consultants to Thermalin Diabetes, LLC. Part of M.C.L.'s research is funded by Sanofi (Germany)

Figures

Figure 1.
Figure 1.
Structural overview and insulin analog sequences. A, crystal structure of WT porcine insulin (PDB code 4INS (6)) from two perspectives showing A (green) and B (blue) chains and disulfide bridges (yellow sticks): A20–B19, A7–B7, and A6–A11 (black boxed labels). Side chains of ThrA8 and TyrA14 are highlighted as red sticks. The C-terminal B chain segment is labeled. B, protein sequences of WT insulin, insulin aspart, and insulin lispro. C, protein sequences of novel single chains SCI-a and SCI-b as well as progenitor SCI-c (4). SCIs contain a six-residue C domain; peptide bonds connecting the A and B domains to the C domain are shown as red lines. Substitutions relative to WT insulin in B and C are shown in red. Gold lines in sequences indicate disulfide bonds. Black arrows at bottom of C highlight residues B10, B28, B29, and A14.
Figure 2.
Figure 2.
SCI-b structural ensemble. A, 30 best-fit structures of SCI-b at two views rotated by 180°. B, expanded view of the C domain. C and D, overlay of WT porcine insulin (gray; PDB code 4INS) (C) and published SCI-c NMR ensemble (gray; PDB code 2JZQ) relative to SCI-b (red, green, blue) (D). Superpositions were aligned according to the main-chain atoms of the A1–A8, A13–A19, and B9–B19 segments. A representative model in E–G was selected to demonstrate close proximity of ProC4-Hγ2 and ValA3-Hγ2 extending the A1–A8 helix (E), the salt bridge between ArgC6 guanidinium nitrogen and GluA4 carboxylate (F), and putative π-cation interactions between ArgC5 and TyrA19 or PheB25 (G). Color code: A domain (green); B domain (blue); C domain linker (red); disulfide bridges (yellow sticks); oxygen (red); nitrogen (cyan); carbon (black); and hydrogen (white). Distance measurements are indicated by red dashed lines; π-cation distances were measured from centers of the aromatic rings (small black spheres) to the terminal nitrogen atoms of ArgC5.
Figure 3.
Figure 3.
Comparison of SCI structures. A, backbone traces of 18 SCI-b NMR structures (with the A domain in green; B domain in blue; C domain in red; and disulfide bridges in yellow) with all six monomers of SCI-a (black, crystal refinement from accompanying article (9)); the structures were aligned as in Fig. 2. Two views are given at relative angle 90° to illustrate differences among B24–B30 segments. For clarity, SCI-b structures are at low opacity. B, average pairwise backbone r.m.s.d. comparing all monomers of SCI-a to 18 SCI-b structures. Absent r.m.s.d. values reflect residues with indeterminate electron densities. C–E, stereo models illustrating side-chain packing of residues B15 and B24 (C), B12 and B26 (D), and A2, A16, and A19 (E) within the mean SCI-b structure overlaid with the side-chain electron densities of SCI-a monomer D; structures were aligned as in Fig. 2 (SCI-a structure is hidden for clarity). Disulfide bridges are shown in yellow, and atoms otherwise colored by domain: A domain, green; B domain, blue; C domain, red; and atom colors: oxygen, light red; and nitrogen, light blue.
Figure 4.
Figure 4.
Fast time scale dynamical studies. A, 15N spin-lattice (R1, black) and spin-spin (R2, blue) relaxation rates and heteronuclear NOEs (red). Data were obtained using a 13C,15N-SCI-b sample. Vertical error bars in each plot result from input spectral noise in each T1 or T2 experiment and subsequent error analysis by the Relax NMR software package (90). B, top, generalized (S2, black squares) and fast (S2fast, red squares) order parameters calculated from experimental 1H-15N T1, T2, and heteronuclear NOE data with the DYNAMICS software package (91). Predicted generalized order parameter (S2′; middle plot) and secondary structure prediction scores (bottom plot) were calculated by the TALOS+ software program (60) based on chemical shifts. In all plots, blue-, red-, and green-shaded areas, respectively, highlight the B9–B19 helix, the C1–C6 segment, A1–A8 helix, and the A13–A19 helix. For SSP probabilities (bottom), positive values are associated with α-helix, whereas negative values suggest β-strand; an SSP value of zero implies disorder.
Figure 5.
Figure 5.
Protein folding and thermodynamic stability. A and B, CD spectra of SCI-b (red) and insulin lispro (black) acquired at 25 °C with molar ellipticities calculated and presented as per residue (A) and per molecule (B). C, forward (4 → 88 °C) and reverse (88 → 4 °C) temperature scans of SCI-b (red) and insulin lispro (black) presented as 〈[θ]222 ± 1 nm〉, an average of the ellipticities at helix-sensitive wavelengths of 222(±1) nm. Distinguishable forward and reverse traces for insulin lispro are labeled. D, comparative CD-monitored guanidine denaturation studies of SCI-b (red) and lispro (black) acquired at 25 °C (solid lines are fits; results given in Table 1). E, 1H-15N-HSQC of 15N-SCI-b ∼1500 s after placement of dried protein sample in 100% D2O potassium phosphate buffer. F, exponential decay profiles generated by plotting HSQC cross-peak intensities as a function of time. Only B15, B18, A16, and A19 resonances were present in first and subsequent HSQCs due to rapid baseline base-catalyzed 1H-2H exchange at pH 7.4. Solid lines show single-exponential fits; parameters are given in Table 2.
Figure 6.
Figure 6.
Long time scale dynamics probed by amide-proton exchange kinetics at pD 2.8. A, successive 1H-15N-HSQCs of SCI-b at the stated time points on dissolution of the protein in 100% D2O at pD 2.4 (pH 2.8). B, plots of PFs against residue number: all observed PFs (top) and an enlarged view of non-global sites of exchange (bottom). Color code: putative sites of global 1H-2H exchange (red); sites of local exchange (green); sites of subglobal exchange (blue); and unobserved or absent amide resonances (filled black circles).
Figure 7.
Figure 7.
Model of SCI-b bound to μIR. A, stereo view of bound state of SCI-b (A domain, yellow; B1–B23, gray) in complex with μIR L1 domain (white) and αCT peptide (green) as obtained from MD simulations. The open state of SCI-b enables detachment of the B24–B30 segment from the protein core as in WT insulin with the B24-C6 segment wrapping around the αCT (green) in a thread-like motif. B, overlays of 20 structures from the 30 structure best-fit SCI-b ensemble (red, green, blue) and 20 receptor-bound SCI-b structures (gray), as aligned according to the main-chain atoms of the B9–B19, A1–A8, and A13–A19 helices. Black double arrows highlight open → closed transition in B24–C6 segment. Disulfides are yellow and labeled by black boxes. N and C termini are as labeled. C, per-residue average Cα–Cα distances (〈RCα-Cα〉) between all possible pairwise Cα comparisons across models in an 18-structure free SCI-b selectively time-averaged ensemble (from A, right) and 18 structures from the bound SCI-b simulation, and D, among all models in an 18 structure SCI-a monomer “D” ensemble (from B, right) and the bound SCI-b ensemble. Error bars in C and D represent standard deviations; error in D is systematically larger than in C due to averaging over the six independent SCI-a crystallographic protomers. The B9–B19, A1–A8, and A13–A19 helices and C1–C6 segment are shown as shaded boxes.
Figure 8.
Figure 8.
PD profile of SCI-b resembled that of a 75/25 premixed NPH/regular insulin analog formulation. Shown are rat studies of insulin action following SQ injection of stated dose (in nanomoles) per 300-g rat of the specified SCI or control. A, blood-glucose concentration, and B, percent change relative to initial blood-glucose concentration. Symbols and doses are defined as inset in (A): data pertaining to SCI-b are shown as green triangles. Two doses of the premixed formulation (Humalog Mix75/25®; Lilly) are provided (black and aquarmarine). A solution of insulin lispro provided a rapid-acting control (red). A 360-min time point for 75/25 at 3.4-nmol dose was not acquired. Samples sizes: (diluent control) n = 4; (insulin lispro) n = 21; (SCI-b) n = 22; (75/25 2.6 nmol) n = 7; and (75/25 3.4 nmol) n = 6. Error bars represent standard error. C, schematic of a pancreatic β-cell and its response to increased plasma [glucose]. The glucose transporter (brown) regulates glucose entry, whereupon its metabolism generates ATP as an intracellular ligand for the ligand-gated K+ channel (blue). Binding of ATP closes K+ channels and thereby depolarizes the cell membrane, which in turn opens voltage-gated Ca2+ channels (green). Entry of Ca2+ triggers first-phase exocytosis of secretory vesicles followed by mobilization of storage granules (orange with red borders). D, plasma insulin concentration curve after subcutaneous injection of stated clinical analogs. The isolated soluble insulin and microcrystalline are indicated as green and blue curves, respectively. Premixed soluble and microcrystalline insulin is shown in red. D is adapted from http://watcut.uwaterloo.ca/webnotes/Metabolism/Diabetes.html.
Figure 9.
Figure 9.
Alternative structural ensembles of SCI-b and SCI-a. A, time-averaged NOE-based ensemble of 98 structures of SCI-b using a standard SA protocol (original SA; left). Each structure was run through a TA distance-restrained MD simulation wherein MD time-averaging was activated for all restraints (All Residues TA; middle). A separate simulation was then performed that enforced time-averaged restraints only for residues residing within flexible regions (predicted S2 < 0.65; right). B, each of the 35 hexameric structures generated using carbon–carbon distance restraints derived from the single-structure SCI-a crystallographic refinement (Hexamer Rebuild SA; left) were subjected to multiconformer simulation (see Fig. S6A for schematic description of the simulation procedure) with all thermal B-factors set to 2 Å2 and either no residues constrained (B = 2 Å2 crystal simulation; middle) or with the positions of B5–B26 and A1–A21 constrained (B = 2 Å2 with core constrained; right). The main-chain (C) and heavy-atom side-chain (D) r.m.s.d. per residue for SCI-b (black) or SCI-a (gray) were calculated from ensembles in A (right) and B (right), respectively. The r.m.s.d. for the SCI-a hexamer ensemble are averaged over all monomers. The B9–B19, A1–A8, and A13–A19 helices and C1–C6 segment are shown as shaded boxes. Gly residues at positions B8, B20, B23, C3, and A1 were excluded from heavy-atom side-chain r.m.s.d. calculations.

References

    1. Brange J., Ribel U., Hansen J. F., Dodson G., Hansen M. T., Havelund S., Melberg S. G., Norris F., Norris K., and Snel L. (1988) Monomeric insulins obtained by protein engineering and their medical implications. Nature 333, 679–682 - PubMed
    1. Weiss M. A. (2013) Design of ultra-stable insulin analogues for the developing world. J. Health Spec. 1, 59–70 10.4103/1658-600X.114683 - DOI
    1. Vinther T. N., Norrman M., Ribel U., Huus K., Schlein M., Steensgaard D. B., Pedersen T. Å., Pettersson I., Ludvigsen S., Kjeldsen T., Jensen K. J., and Hubálek F. (2013) Insulin analog with additional disulfide bond has increased stability and preserved activity. Protein Sci. 22, 296–305 10.1002/pro.2211 - DOI - PMC - PubMed
    1. Hua Q. X., Nakagawa S. H., Jia W., Huang K., Phillips N. B., Hu S. Q., and Weiss M. A. (2008) Design of an active ultrastable single-chain insulin analog: synthesis, structure, and therapeutic implications. J. Biol. Chem. 283, 14703–14716 10.1074/jbc.M800313200 - DOI - PMC - PubMed
    1. Shaw J. E., Sicree R. A., and Zimmet P. Z. (2010) Global estimates of the prevalence of diabetes for 2010 and 2030. Diabetes Res. Clin. Pract. 87, 4–14 10.1016/j.diabres.2009.10.007 - DOI - PubMed

Publication types

MeSH terms