. 2018 Jan 5;293(1):47-68.
doi: 10.1074/jbc.M117.808626. Epub 2017 Nov 7.

An ultra-stable single-chain insulin analog resists thermal inactivation and exhibits biological signaling duration equivalent to the native protein

Affiliations

An ultra-stable single-chain insulin analog resists thermal inactivation and exhibits biological signaling duration equivalent to the native protein

Michael D Glidden et al. J Biol Chem. .

Abstract

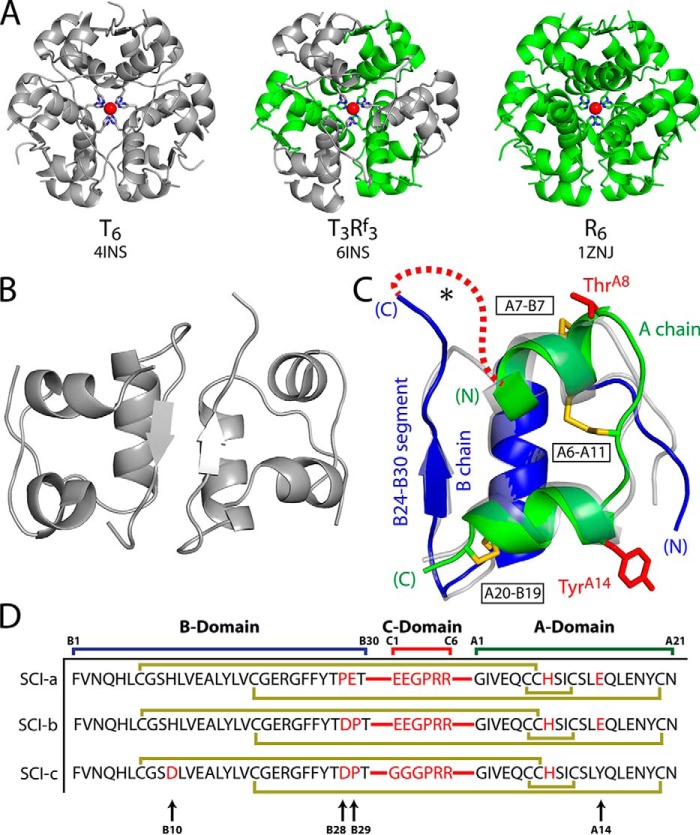
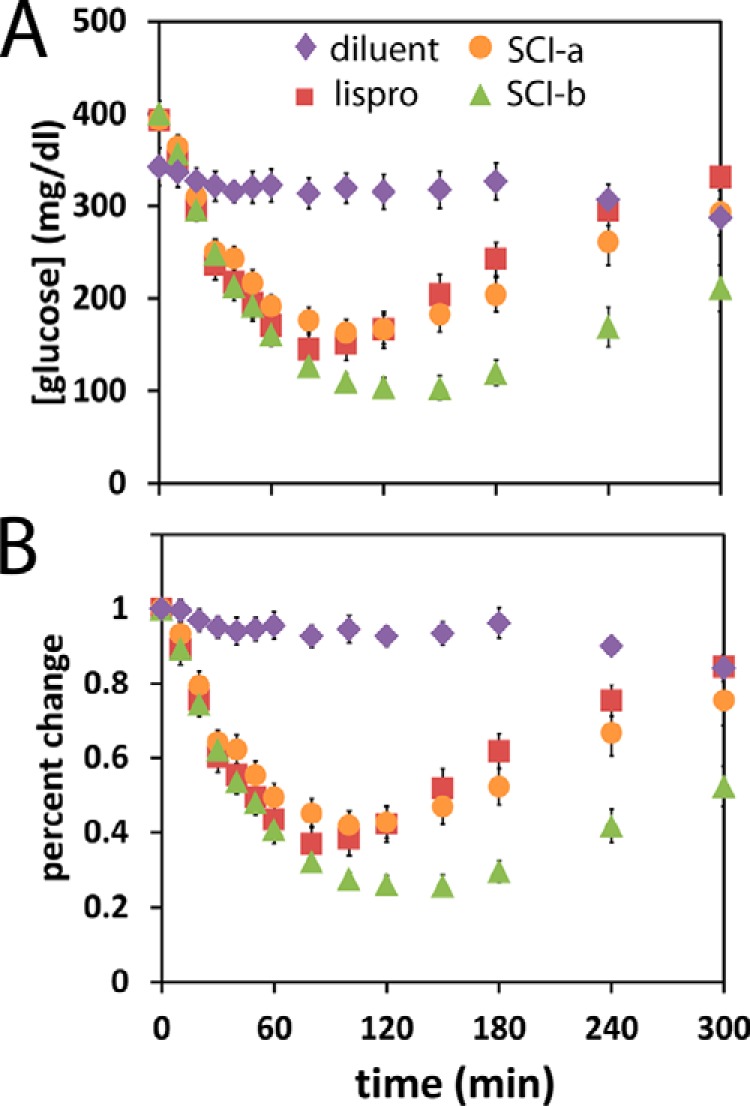
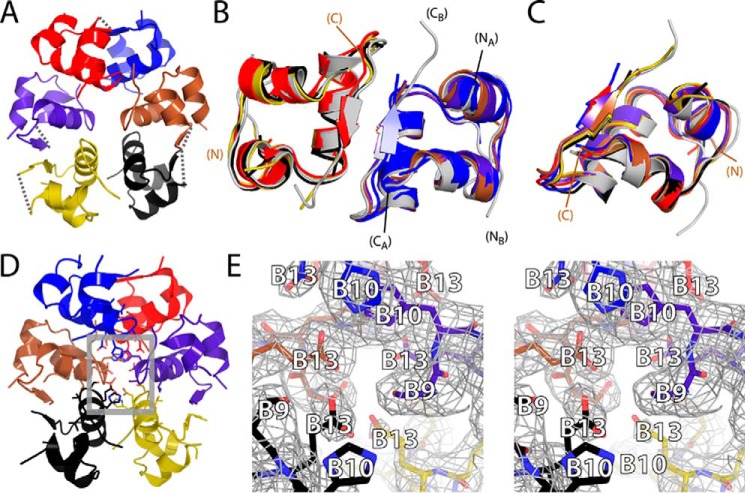
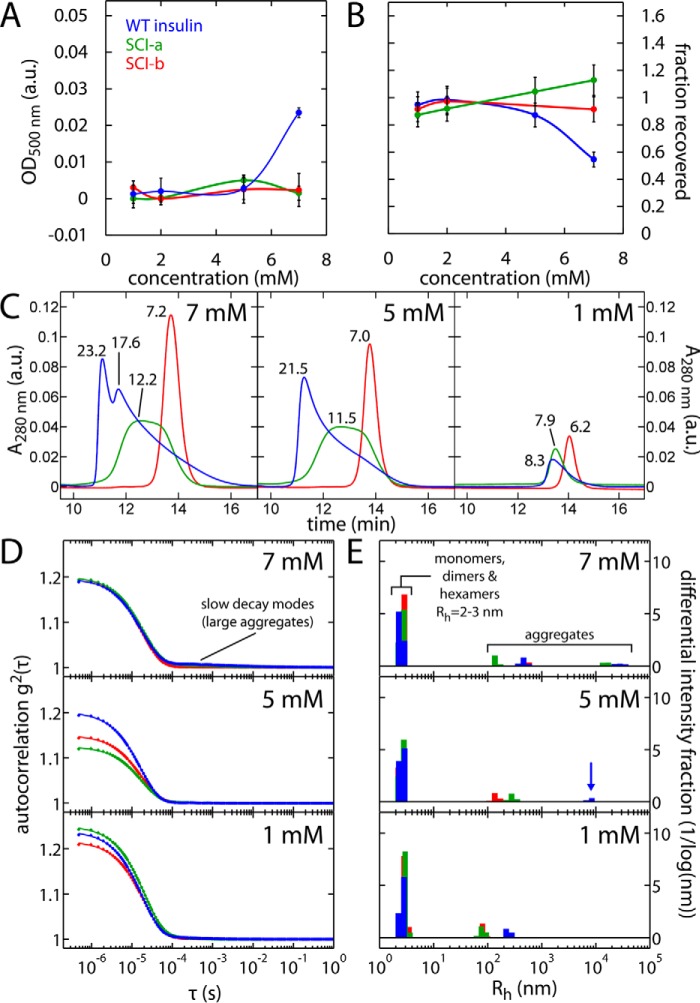
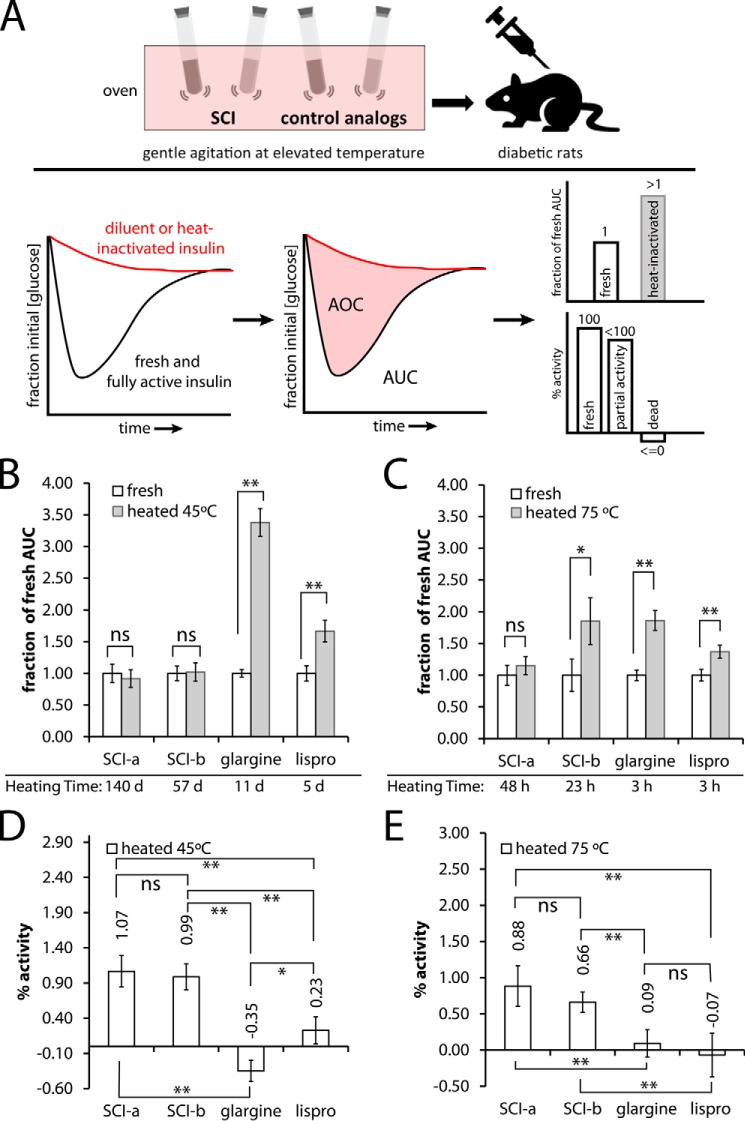
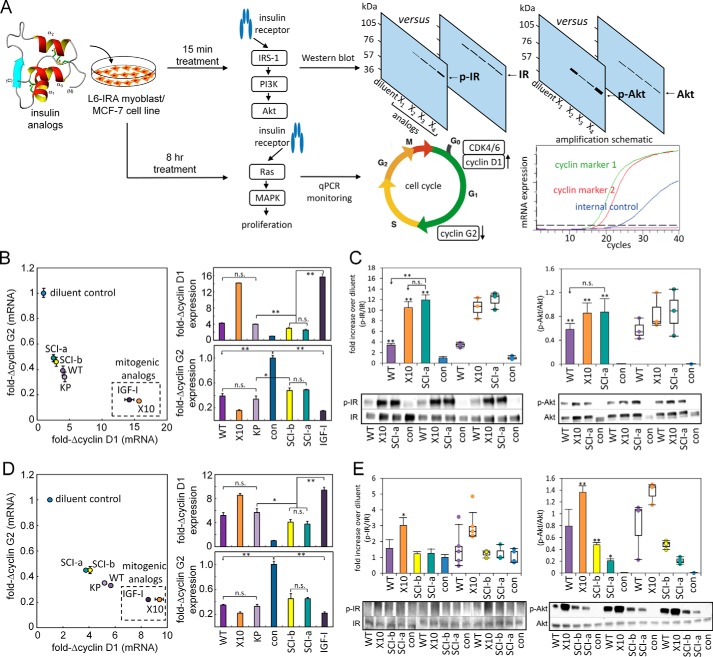
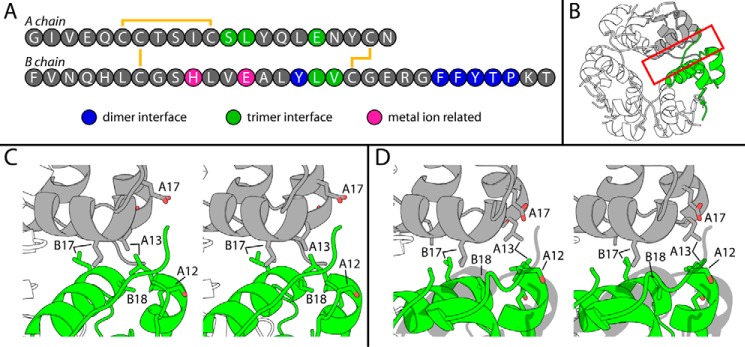
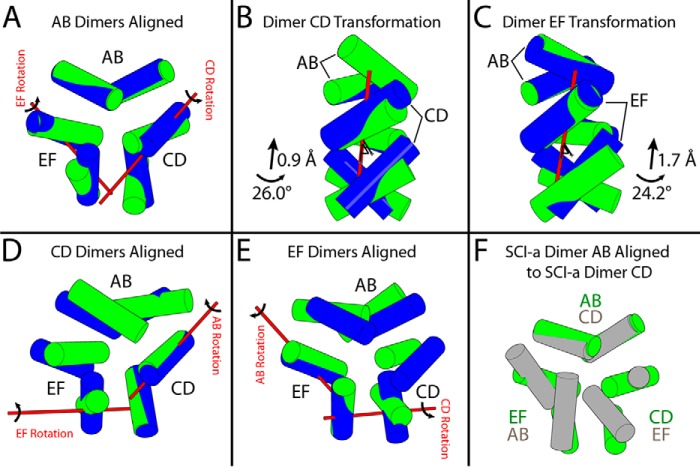
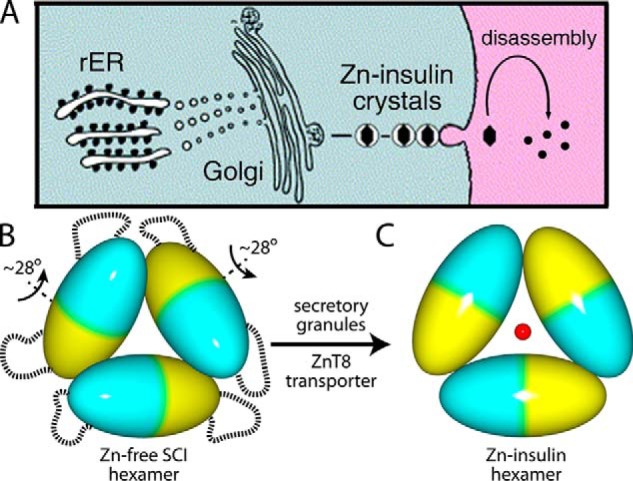
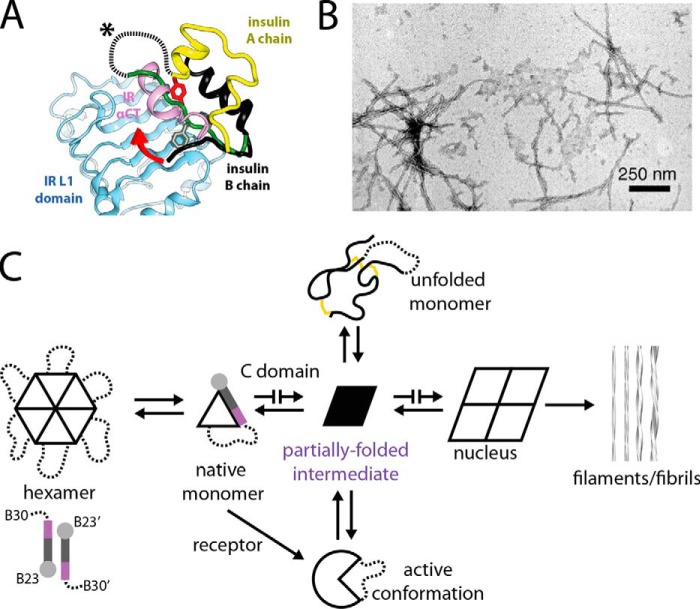
Thermal degradation of insulin complicates its delivery and use. Previous efforts to engineer ultra-stable analogs were confounded by prolonged cellular signaling in vivo, of unclear safety and complicating mealtime therapy. We therefore sought an ultra-stable analog whose potency and duration of action on intravenous bolus injection in diabetic rats are indistinguishable from wild-type (WT) insulin. Here, we describe the structure, function, and stability of such an analog, a 57-residue single-chain insulin (SCI) with multiple acidic substitutions. Cell-based studies revealed native-like signaling properties with negligible mitogenic activity. Its crystal structure, determined as a novel zinc-free hexamer at 2.8 Å, revealed a native insulin fold with incomplete or absent electron density in the C domain; complementary NMR studies are described in the accompanying article. The stability of the analog (ΔGU 5.0(±0.1) kcal/mol at 25 °C) was greater than that of WT insulin (3.3(±0.1) kcal/mol). On gentle agitation, the SCI retained full activity for >140 days at 45 °C and >48 h at 75 °C. These findings indicate that marked resistance to thermal inactivation in vitro is compatible with native duration of activity in vivo Further, whereas WT insulin forms large and heterogeneous aggregates above the standard 0.6 mm pharmaceutical strength, perturbing the pharmacokinetic properties of concentrated formulations, dynamic light scattering, and size-exclusion chromatography revealed only limited SCI self-assembly and aggregation in the concentration range 1-7 mm Such a combination of favorable biophysical and biological properties suggests that SCIs could provide a global therapeutic platform without a cold chain.

Keywords: diabetes; hormone; protein engineering; protein structure; receptor tyrosine kinase.


Conflict of interest statement

M.A.W. has equity in Thermalin Diabetes, LLC (Cleveland, OH), where he serves as Chief Innovation Officer; he has also been a consultant to Merck Research Laboratories and DEKA Research & Development Corp. N. B. P. and F. I.-B. are consultants to Thermalin Diabetes, LLC. Part of M.C.L.'s research is funded by Sanofi (Germany)

Figures

Figure 1.
Figure 1.
Structural overview and insulin analog sequences. A, crystal structures of T6 (porcine insulin; PDB code 4INS (1)), T3Rf3 (B29–A1 single chain insulin; PDB code 6INS (19)), and R6 (human insulin; PDB code 1ZNJ) hexamers, as labeled. In each structure, the T state protomers are gray and R state protomers are green. HisB10 side chains are displayed as sticks with coordinated Zn2+ ions as red spheres. The second axial Zn2+ ion lies directly behind the first. B, anti-parallel β-sheet dimer interface of porcine insulin (PDB code 4INS). C, overlay of a T state protomer of B29–A1 single-chain insulin (transparent gray; PDB code 6INS) and porcine insulin (PDB code 4INS). The latter displays the A (green) and B (blue) chains and three native disulfide bridges (yellow sticks): A20–B19, A7–B7, and A6–A11 (black boxed labels). Side chains of WT residues ThrA8 and TyrA14 are highlighted as red sticks. The C-terminal B chain segment (important in both dimerization and IR binding) is labeled. Red dashed line and asterisk represent C domains of proinsulin and SCIs. D, protein sequences of SCI-a and SCI-b as well as progenitor SCI-c (29). Peptide bonds connecting the A and B domains to the C domain are illustrated with red lines. Substitutions relative to WT insulin are identified by red letters. Gold lines identify the three native disulfide bonds. Black arrows at bottom of D highlight residues B10, B28, B29, and A14, key sites of substitution.
Figure 2.
Figure 2.
Rat studies of fresh insulin analog solutions. Shown are rat studies of insulin action following i.v. injection of 1.7 nmol/300-g rat of the specified SCI or control. A, blood-glucose concentration; B, percent change relative to initial blood-glucose concentration. Symbols are defined as inset in A. Samples sizes: (diluent control) n = 12; (insulin lispro) n = 13; (SCI-a) n = 13; and (SCI-b) n = 10.
Figure 3.
Figure 3.
SCI-a crystal structure and electron density map. A, ribbon model of novel zinc-free hexamer. Electron densities of the B1–B4, B27–B30, and C1–C6 segments were poor in all SCI-a monomers; gray dashed lines (connecting α-carbons) in each monomer denote missing C domains in the hexamer. B and C, backbone superposition of all SCI-a dimers (color scheme as in A) aligned according to the main-chain atoms of residues A1–A8, A13–A19, and B9–B19 (helices) of the 4INS dimer (gray) (B) and all SCI-a monomers aligned according to the above main-chain atoms in 4INS monomer 1 (gray) (C). NA, CA, NB, and CB labels respective chain termini of the A and B chains of 4INS; the termini of one SCI-a monomer (brown) are likewise labeled by N and C. Disulfide bonds are not shown. D, SCI-a hexamer with residues B9, B10, and B13 within hexamer core displayed as sticks. The gray boxed region is expanded in the stereo view of the core in E. E, stick representations of residues B9–B13 and underlying electron density (2m|Fo| − D|Fc|; gray wire frame). Side-chain labels are provided as white text with black outlines. Atom colors: pink/red, oxygen, and blue, nitrogen; carbons are colored as in respective monomers in D.
Figure 4.
Figure 4.
Studies of protein self-assembly and aggregation. A, concentration dependence of optical absorbance at 500 nm (turbidimetry (78)); insulin analogs were dissolved in Tris-HCl buffer (pH 7.4) containing zinc, phenol, and meta-cresol. Error bars represent the standard deviation of four measurements. B, studies of protein solubility; rp-HPLC-based estimates are presented as fraction of protein recovered after centrifugation. Error per measurement in B is fixed at 10% to reflect deviations between multiple injections of 10-μg Humalog® standard (see “Experimental procedures”). C, SEC of insulin analogs at stated concentrations (7, 5, and 1 mm). Elution peaks are labeled with calculated masses (in kDa) as interpolated from a set of molecular mass standards (see under “Experimental procedures” and Fig. S5). D and E, dynamic light scattering. Field autocorrelation functions (D, solid lines are fits) and inferred size distributions (E) by the regularization method (91) for insulin analogs at stated concentrations. Blue arrow in E highlights presence of large aggregates of WT insulin at 5 mm. Color code: WT insulin, blue; SCI-a, green; and SCI-b, red.
Figure 5.
Figure 5.
Rat studies of heat-stressed insulin analogs. A, schematic diagram of the thermal inactivation assay wherein formulations of insulin at U-100 (0.6 mm) in septum-sealed glass vials are gently rocked in an oven set to either 45 or 75 °C. At the indicated times, the vials were removed followed by dilution and SQ injection into diabetic rats to assess residual potency. Bottom panel of A shows the resulting glucose-response curves for a fully active (black) and completely dead analog (red), the latter of which would give an identical curve to a diluent-only control. These curves are integrated and processed to provide AUC and AOC. These metrics provide fractional AUC, a reporter of significant differences between the fresh and heated analog data, and percent activity, which illustrates degree of inactivation following heating. Fractional AUC for the stated fresh (white) or heated (gray) analogs are given for 45 °C (B) and 75 °C (C) experiments. Heated incubation times are given below the appropriate analog name. Percent (%) activities for the experiments in B and C are given in D and E. *, p < 0.1; **, p < 0.05, ns, not significant (p > 0.1). Sample sizes for each SQ experiment were n = 4–5 rats and analog doses ranged from 3.0 to 6.0 nmol/300-g rat. Doses in this range do not produce significantly different glucose-response profiles. The dose and sample size of any given analog set was the same for fresh and heated injections.
Figure 6.
Figure 6.
Cell biological assessment of insulin signaling. A, schematic outline of cell-based assays for the assessment of hormone-induced IR-A signaling and activation of mitogenic pathways. L6 rat myoblasts stably expressing human IR isoform A (IR-A) (developed by De Meyts and co-workers (49)) or MCF-7 human breast cancer cells expressing both IR isoforms (IR-A and IR-B) and high levels of IGF-1R (50) were treated with SCI analogs or control two-chain analogs. After 15 min of treatment, Tyr-phosphorylation of IR and Akt was assessed by Western blotting (51) (upper flowchart). To analyze relative mitogenic potencies, L6-IRA or MCF-7 cells treated for 8 h were collected, and the transcriptional response of cell proliferation markers cyclin D1 and cyclin G2 (cell cycle schematic adapted from Ref. 102) was assessed by rt-qPCR (schematic adapted from Bio-Rad). The increased accumulation of cyclin D1 and decreased cyclin G2 mRNA served as readouts for insulin-induced activation of cellular proliferation pathways (bottom flowchart). B, assessment of insulin-driven cyclin D1 and G2 transcription in L6-IRA cells; known mitogenic analogs (dashed box) yield increased accumulation of cyclin D1 mRNA and repression of cyclin G2. Brackets designate p values: *, <0.05, or **, <0.01; ns indicates p values >0.05. C, histogram representation of the average fold increase over diluent and dot-plot representation of the actual fold increase over diluent for each data point collected from L6-IRA Western blottings of p-IR/IR (left) and histogram average and actual dot-plot representations of the ratio of p-Akt to total cell Akt obtained from L6-IRA blots of p-Akt/Akt (right). D and E, studies in a human breast cancer cell line. MCF-7 cell-derived rt-qPCR (D) and phosphorylation Western blot data (E) are presented as in B and C. Histograms: n = 3; ± standard error. ** or * indicates p value < 0.01 or <0.05. Whiskers for the dot-plot follow Tukey's box plot method: lowest data point within 1.5 Interquartile Range (IQR) of the lower quartile, and the highest data point within 1.5 IQR of the upper quartile. Abbreviations: Con, diluent control; X10, AspB10-insulin; WT insulin; KP, insulin lispro.
Figure 7.
Figure 7.
Self-assembly surfaces of insulin and novel SCI-a hexamer. A, color-coded sequence of WT insulin. Residues at dimer interface (blue), trimer interface (green), or metal ion binding in the hexamer (pink) are highlighted. B, classical 4INS T6 hexamer with trimer interface of monomer B (gray) and monomer C (green) boxed in red. C, stereo view of red-boxed region in A with residues at the trimer interface (B17, B18, A12, A13, and A17) from both protomers shown as sticks. D, stereo view of SCI-a trimer interface with appropriate residues highlighted as sticks. 4INS monomer C is a gray ghost to highlight its rotation relative to its counterpart protomer C in SCI-a. For this, dimer AB of 4INS was aligned to dimer AB of SCI-a. Color code: red, oxygen; blue, nitrogen; carbons are colored as in schematic monomer representations.
Figure 8.
Figure 8.
Structural relationship between SCI-a hexamer and classical T6 zinc hexamer. Shown are minimized cylindrical representations showing only the B9–B19 helices of SCI-a (green) and T6 human insulin (PDB code 1MSO (37); blue). A, alignment of dimer AB of SCI-a to dimer AB of 1MSO via the backbone of all three native helices. Red bars drawn in 3D denote the axis of rotation about which dimers CD and EF must independently be translated and rotated to align to the classic T6 arrangement of dimers CD and EF in 1MSO. B and C, enlarged views of alignment in A with independent alignment transformations for dimers CD and EF, respectively. Alignment via main-chain atoms of the three α-helices and their dimer-related mates within dimer CD to CD (D) and dimer EF to EF (E); independent alignment vectors for remaining dimers (red bars) are illustrated in A. F, dimer CD of an SCI-a copy was aligned to dimer AB of the original (green).
Figure 9.
Figure 9.
Insulin self-assembly in β-cell-specific biosynthetic pathway. A, proinsulin biosynthesis in the β-cells begins in the rough endoplasmic reticulum (rER) (left) followed by trafficking through the Golgi apparatus (middle) and storage into zinc-insulin granules, ultimately leading to glucose-regulated secretion with disassembly in the bloodstream (right). B, ellipsoid model of SCI-a zinc-free hexamer. Each ellipsoid represents an insulin dimer; monomers are denoted by blue or yellow. Dashed lines indicate disordered C domains on hexamer surface. Each ellipsoid is rotated an average of 28° relative to the bottom ellipsoid (see Table 5). C, corresponding model of classical T6 zinc insulin hexamer with two axial zinc ions (red sphere; the second axial zinc ion is hidden directly behind sphere). Packaging of WT insulin hexamers into zinc-containing storage vesicles is enabled by granule-specific zinc transporter ZnT8 (67).
Figure 10.
Figure 10.
Open state of receptor-bound insulin and its implications for mechanism of fibrillation. A, crystal structure of WT insulin (A chain, yellow; B chain, black) bound to the μIR (17). The B24–B30 segment (black; only observed up to B26) of WT insulin inserts between IR L1 (blue) and αCT (pink) domains (18). The classical (unbound) conformation of the insulin B chain is displayed in green; aromatic side chains B24–B26 in the unbound monomer are presented as sticks. Dashed line and asterisk indicate a schematic C domain in unbound SCI-a. The red embossed arrow indicates that the C domain of the bound SCI may wrap about the αCT segment of the IR in an SCI-αCT threading motif. This panel was adapted from Pandyarajan et al. (90) with permission of the authors. This research was originally published in the Journal of Biological Chemistry. Pandyarajan, V., Phillips, N. B., Rege, N. K., Lawrence, M. C., Whittaker, J., and Weiss, M. A. Contribution of TyrB26 to the function and stability of insulin: structure-activity relationships at a conserved hormone-receptor interface. J. Biol. Chem. 2016; 291:12978–12990. © the American Society for Biochemistry and Molecular Biology. B, transmission electron microscopy image of mature insulin fibrils induced by heat (reproduced with permission from Ref. 72). This research was originally published in Journal of Biological Chemistry. Hua, Q. X., and Weiss, M. A. Mechanism of insulin fibrillation: the structure of insulin under amyloidogenic conditions resembles a protein-folding intermediate. J. Biol. Chem. 2004; 279:21449–21460. © the American Society for Biochemistry and Molecular Biology. C, schematic nucleation pathway of insulin fibrillation is mediated by aggregation of a distorted monomeric conformation (black trapezoid at center; adapted with permission from Yang et al. (30) (This research was originally published in the Journal of Biological Chemistry. Yang, Y., Petkova, A., Huang, K., Xu, B., Hua, Q. X., Ye, I. J., Chu, Y. C., Hu, S. Q., Phillips, N. B., Whittaker, J., Ismail-Beigi, F., Mackin, R. B., Katsoyannis, P. G., Tycko, R., and Weiss, M. A. An Achilles' Heel in an amyloidogenic protein and its repair: insulin dynamics, misfolding, and therapeutic design. J. Biol. Chem. 2010; 285:10806–10821. © the American Society for Biochemistry and Molecular Biology.); models of insulin protofilament and their higher-order assembly are shown at far right (reproduced with permission from the authors (70) (Jimenez, J. L., Nettleton, E. J., Bouchard, M., Robinson, C. V., Dobson, C. M., and Saibil, H. R. (2002) The protofilament structure of insulin amyloid fibrils. Proc. Natl. Acad. Sci. U.S.A. 99, 9196–9201. Copyright (2002) National Academy of Sciences)).

References

    1. Baker E. N., Blundell T. L., Cutfield J. F., Cutfield S. M., Dodson E. J., Dodson G. G., Hodgkin D. M., Hubbard R. E., Isaacs N. W., and Reynolds C. D. (1988) The structure of 2Zn pig insulin crystals at 1.5 Å resolution. Philos. Trans. R. Soc. Lond. B Biol. Sci. 319, 369–456 - PubMed
    1. Zaykov A. N., Mayer J. P., and DiMarchi R. D. (2016) Pursuit of a perfect insulin. Nat. Rev. Drug Discov. 15, 425–439 10.1038/nrd.2015.36 - DOI - PubMed
    1. Steiner D. F., Cunningham D., Spigelman L., and Aten B. (1967) Insulin biosynthesis: evidence for a precursor. Science 157, 697–700 10.1126/science.157.3789.697 - DOI - PubMed
    1. Shabanpoor F., Separovic F., and Wade J. D. (2009) The human insulin superfamily of polypeptide hormones. Vitam. Horm. 80, 1–31 10.1016/S0083-6729(08)00601-8 - DOI - PubMed
    1. Rinderknecht E., and Humbel R. E. (1978) The amino acid sequence of human insulin-like growth factor I and its structural homology with proinsulin. J. Biol. Chem. 253, 2769–2776 - PubMed

Publication types