Review
. 2017 Oct 9:2017:6053879.
doi: 10.1155/2017/6053879. eCollection 2017.

Cancer Metabolism and Tumor Heterogeneity: Imaging Perspectives Using MR Imaging and Spectroscopy

Affiliations
Review

Cancer Metabolism and Tumor Heterogeneity: Imaging Perspectives Using MR Imaging and Spectroscopy

Gigin Lin et al. Contrast Media Mol Imaging. .

Abstract

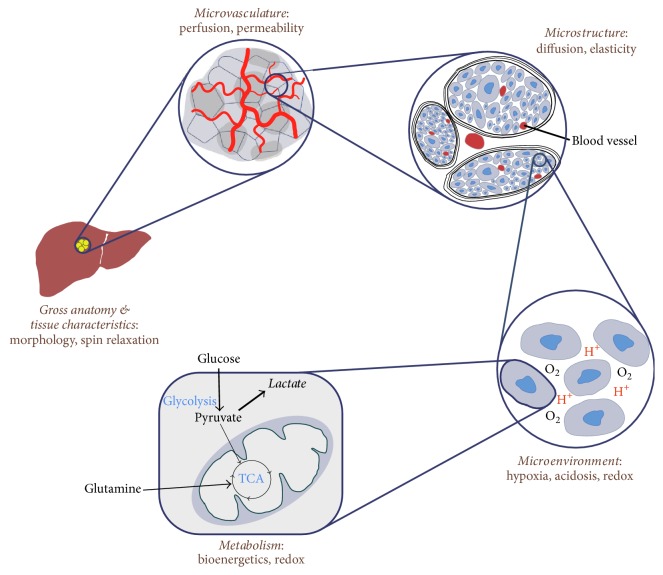
Cancer cells reprogram their metabolism to maintain viability via genetic mutations and epigenetic alterations, expressing overall dynamic heterogeneity. The complex relaxation mechanisms of nuclear spins provide unique and convertible tissue contrasts, making magnetic resonance imaging (MRI) and magnetic resonance spectroscopy (MRS) pertinent imaging tools in both clinics and research. In this review, we summarized MR methods that visualize tumor characteristics and its metabolic phenotypes on an anatomical, microvascular, microstructural, microenvironmental, and metabolomics scale. The review will progress from the utilities of basic spin-relaxation contrasts in cancer imaging to more advanced imaging methods that measure tumor-distinctive parameters such as perfusion, water diffusion, magnetic susceptibility, oxygenation, acidosis, redox state, and cell death. Analytical methods to assess tumor heterogeneity are also reviewed in brief. Although the clinical utility of tumor heterogeneity from imaging is debatable, the quantification of tumor heterogeneity using functional and metabolic MR images with development of robust analytical methods and improved MR methods may offer more critical roles of tumor heterogeneity data in clinics. MRI/MRS can also provide insightful information on pharmacometabolomics, biomarker discovery, disease diagnosis and prognosis, and treatment response. With these future directions in mind, we anticipate the widespread utilization of these MR-based techniques in studying in vivo cancer biology to better address significant clinical needs.


Figures

Figure 1
Figure 1
MRI and MRS in imaging cancer. MRI and MRS provide useful information of cancer metabolism and tumor heterogeneity ranging from anatomical change to microvascular development, biophysical characteristics, microstructural deformation, altered cellular metabolism, and tumor microenvironment.
Figure 2
Figure 2
Perfusion monitoring using dynamic contrast-enhanced (DCE) MRI in liver metastasis after anti-VEGF treatment (bevacizumab). DCE-MRI requires the acquisition of (a) time series of signal intensity data converted into (b) a gadolinium contrast agent concentration–time curve and (c) an arterial input function, Cp(t). (d) Model-fitting enables calculation of bulk transfer coefficient (Ktrans) and a Ktrans map of extensive liver metastasis overlaid on a slice from T2-weighted MRI. (e) Ktrans reduced three days after treatment with bevacizumab. (f) Proportion of decrease in Ktrans over time (adapted from [13]).
Figure 3
Figure 3
Non-Gaussian water diffusion analysis using diffusion kurtosis imaging (DKI) in prostate cancer. A 73-year-old man (prostate-specific antigen level, 12.1 ng/mL) with prostate cancer (arrows). (a) T2-weighted image, (b) diffusion-weighted image (b = 1500 s/mm2), (c) apparent diffusion coefficient (ADC) map, (d) diffusivity map, and (e) kurtosis map. Compared with healthy tissue, prostate cancer in left peripheral zone (indicated by an arrow) showed hypointensity on T2-weighted image, hyperintensity on diffusion-weighted image, hypointensity on ADC, lower diffusivity, and higher kurtosis (adapted from [14]).
Figure 4
Figure 4
Shear stiffness assessment of breast cancer using MR elastography (MRE). (a) An axial MR magnitude image of the right breast of a patient volunteer. A large adenocarcinoma is shown as the outlined, mildly hyperintense region on the lateral side of the breast. (b) A single wave image from MRE performed at 100 Hz is shown along with (c) the corresponding elastogram. (d) An overlay image of the elastogram and the magnitude image shows good correlation between the tumor and the stiff region detected by MRE (adapted from [15]).
Figure 5
Figure 5
Tumor oxygenation and microvascular permeability using Overhauser-enhanced MRI (OMRI). Comparison of Ktrans maps of Gd-DTPA and OX63 (radical) in a squamous cell carcinoma (SCC). (a) SCC tumor region can be detected in a T2-weighted image by using 7-T MRI. (b) Ktrans map of Gd-DTPA. (c) Ktrans map of OX63 using OMRI of the same SCC tumor. Note OMRI/OX63 images were obtained before the 7-T MRI/Gd-DTPA study. (d) Corresponding pO2 map computed from the same OMRI images for Ktrans  OX63 map. ((e), (f)) Based on the anatomical image, ROI of SCC tumor was selected and enlarged. Tumor region with low Ktrans  OX63 values (ROI 1) was relatively oxygenated and normal muscle tissue, and the region with high Ktrans  OX63 values (ROI 2) coincided with hypoxia in pO2 image (adapted from [16]).
Figure 6
Figure 6
Multi-slice assessment of extracellular pH (pHe) of the tumor, kidney, and bladder using acidoCEST MRI and exogenous contrast agent, iopromide, in a mice model of MDA-MB-231 human mammary carcinoma. (a) The tumor showed an average pHe of 6.74. (b) The pHe increased from the renal pelvis (6.54) to the cortex (6.84). (c) The bladder had a pHe of 6.3. The region into which the bladder swells after injection during infusion could not be fit, indicating that the fitting method used is robust against overfitting (adapted from [17]).
Figure 7
Figure 7
Glioma metabolism using hyperpolarized [2-13C]pyruvate before and after dichloroacetate (DCA) administration. 125-mM hyperpolarized [2-13C]pyruvate was injected intravenously into a rat with C6 glioma cells. Metabolite maps of (a) [2-13C]pyruvate, (b) [2-13C]lactate, and (c) [5-13C]glutamate from a tumor slice of a representative glioma-implanted rat brain, measured pre- and post-DCA. (d) Contrast-enhanced T1-weighted 1H MRI of the corresponding slice (adapted from [18]).
Figure 8
Figure 8
2-Hydroxyglutarate (2HG) detection by MRS in isocitrate dehydrogenase- (IDH-) mutated glioma patients. In vivo single-voxel localized spectra from normal brain (a) and tumors ((b)–(f)), at 3 T, are shown together with spectral fits (LCModel) and the components of 2HG, GABA, glutamate, and glutamine, and voxel positioning (2 × 2 × 2 cm3). Spectra are scaled on the water signal from the voxel. Vertical lines are drawn at 2.25 ppm to indicate the H4 multiplet of 2HG. Shown in brackets is the estimated metabolite concentration (mM) ± standard deviation. Cho: choline; Cr: creatine; NAA: N-acetyl aspartate; Glu: glutamate; Gln: glutamine; GABA: γ-aminobutyric acid; Gly: glycine; Lac: lactate; Lip: lipids. Scale bars: 1 cm (adapted from [19]).

References

    1. Hanahan D., Weinberg R. A. Hallmarks of cancer: the next generation. Cell. 2011;144(5):646–674. doi: 10.1016/j.cell.2011.02.013. - DOI - PubMed
    1. Kaddurah-Daouk R., Kristal B. S., Weinshilboum R. M. Metabolomics: a global biochemical approach to drug response and disease. Annual Review of Pharmacology and Toxicology. 2008;48:653–683. doi: 10.1146/annurev.pharmtox.48.113006.094715. - DOI - PubMed
    1. Yauch R. L., Settleman J. Recent advances in pathway-targeted cancer drug therapies emerging from cancer genome analysis. Current Opinion in Genetics and Development. 2012;22(1):45–49. doi: 10.1016/j.gde.2012.01.003. - DOI - PubMed
    1. Vander Heiden M. G. Targeting cancer metabolism: a therapeutic window opens. Nature Reviews Drug Discovery. 2011;10(9):671–684. doi: 10.1038/nrd3504. - DOI - PubMed
    1. Tennant D. A., Durán R. V., Gottlieb E. Targeting metabolic transformation for cancer therapy. Nature Reviews Cancer. 2010;10(4):267–277. doi: 10.1038/nrc2817. - DOI - PubMed

Publication types

MeSH terms

LinkOut - more resources